
|
市場調査レポート
商品コード
1686239
代替乳製品:市場シェア分析、産業動向と統計、成長予測(2025年~2030年)Dairy Alternatives - Market Share Analysis, Industry Trends & Statistics, Growth Forecasts (2025 - 2030) |
||||||
カスタマイズ可能
適宜更新あり
|
|||||||
| 代替乳製品:市場シェア分析、産業動向と統計、成長予測(2025年~2030年) |
|
出版日: 2025年03月18日
発行: Mordor Intelligence
ページ情報: 英文 435 Pages
納期: 2~3営業日
|

全表示
- 概要
- 目次
概要
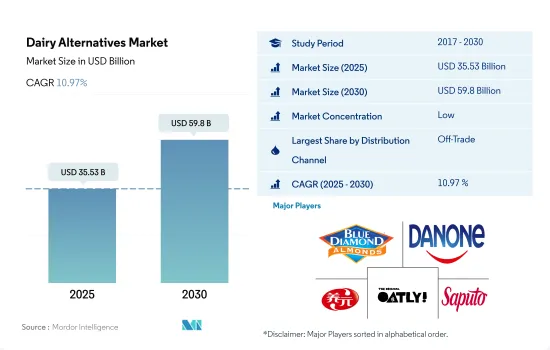
代替乳製品市場規模は2025年に355億3,000万米ドルと推定され、2030年には598億米ドルに達し、予測期間(2025年~2030年)のCAGRは10.97%で成長すると予測されます。
特にスーパーマーケット/ハイパーマーケットとオンラインを通じたオフラインチャネルでの販売がセグメントを牽引しました。
- 流通チャネル別に見ると、世界の代替乳製品市場はオントレード小売とオフトレード小売の2つに大別されます。取引外チャネルは、世界の代替乳製品の販売において主要な役割を果たしています。商取引外のチャネルの中では、スーパーマーケットとハイパーマーケットが最も人気があります。
- スーパーマーケットやハイパーマーケットは、牛乳、ヨーグルト、アイスクリームなどの代替乳製品から製品を選ぶことができ、顧客にとって理想的な買い物の選択肢と考えられています。そのため、このチャネルは代替乳製品の主要販売チャネルと考えられています。世界全体の売上の60%以上を占めています。
- オンライン・チャネルは代替乳製品の流通チャネルとして最も急成長しており、2023~2024年の間に5.59%成長すると予測されています。eコマース、食料品、または食品配達プラットフォームの数は市場で増加しています。戦略的拡大の一環として、大手小売業者は純粋なオンライン小売業者と提携し、独自のオンラインサービスを立ち上げています。例えば、モリソンズ(Morrisons)、ブース(Booths)、コープ(Co-op)の自社ブランド商品も、アマゾンフレッシュ(Amazon Fresh)を通じてオンラインで販売されています。アズダ、テスコ、アマゾン・フレッシュ、セインズベリー、ウェイトローズ、アイスランド、モリソンズ、ゴリラ、ウィジーは、オンラインで即日配達を行っています。
- ビーガン人口や乳糖不耐症の消費者の増加に伴い、オン・トレード部門、特にファーストフード店やカフェからの需要は、様々な代替乳製品への需要を増加させると予想されます。
アジア太平洋の消費者が牽引する植物性乳の爆発的消費が市場成長の原動力となっています。
- 代替乳製品の世界消費量は2019年から2023年にかけて41.7%増加しました。代替乳製品は世界各国で日常的な食生活の一部となっています。北米とアジア太平洋は代替乳製品の消費量において最大の地域となり、2023年の市場数量シェアはそれぞれ35%と34.1%となる見込みです。
- 植物性栄養に対する意識の高まりに伴うビーガン人口の増加が、アジア太平洋における代替乳製品需要を牽引しています。中国、日本、韓国は、他のアジア諸国に比べて代替乳製品の消費が著しく高いです。2023年には、この3カ国の合計がこの地域の代替乳製品の総消費量の79.77%のシェアを占めると予想されます。
- 2021年には、日本で豆乳および豆乳ベースの製品を生産するために約6万7,800トンの大豆が使用され、その結果、約12万3,000キロリットルの豆乳が生産されました。日本では、「豆乳」と表記される飲料は、砂糖、食塩、植物油を添加していない未加工豆乳を指します。代替乳製品の一人当たり消費量は、2023年の0.39kgから15.47%増加し、2029年には年間0.45kgに達すると推定されます。
- 北米では、代替乳製品の販売額は2024~2027年の間に28%拡大し、2027年には137億1,500万米ドルに達すると推定されます。植物性ミルクはこの地域全体でかなり消費されており、米国、カナダ、メキシコなどの主要国では豆乳とアーモンドミルクが最も人気があります。アーモンドの生産量は米国が世界で最も多く、年間約200万2,742トンです。こうした要因により、アーモンドミルクの生産量は年々増加しています。
世界の代替乳製品市場動向
菜食主義者の増加、乳糖不耐症、代替乳製品の健康と環境への利点に関する意識の高まりが、さまざまなタイプの代替乳製品の消費を世界中で促進しています。
- ビーガン人口の大幅な増加と乳糖不耐症人口の増加により、様々なタイプの代替乳製品の消費が世界中で増加しています。ヴィーガンライフスタイルを促進するために、ヴィーガンの展示会や見本市、音楽祭までもが各国で開催されています。例えば、オーストラリアは人口1人当たりのビーガン人口比率が世界で3番目に高いです。2022年現在、250万人が菜食主義者です。
- 植物由来のミルクは、世界中の代替乳製品の中で最も消費量の多いカテゴリーです。豆乳、アーモンドミルク、オートミールの人気が高く、2022年の植物性ミルク消費量全体では合計で70%以上のシェアを記録しました。これは、牛乳アレルギーの蔓延が世界的に植物性ミルクの需要を牽引しているためです。例えば、豆乳はビタミン、タンパク質、カリウムを豊富に含み、牛乳よりも低カロリーです。栄養価が高いため、乳製品の理想的な代替品と考えられています。
- 植物性チーズのような非乳製品チーズ、特にスライスチーズに対する需要は大きく、数カ国で大きな販売額を記録しています。スペインとドイツの消費者は、従来のチーズの代わりに植物性チーズを食べる用意が最もあることを明らかにしています。例えば、ドイツの消費者は、スーパーマーケットで購入できる植物性クリームチーズ(32%)、スライスチーズ(32%)、植物性モッツァレラチーズ(31%)を好みます。植物由来の新たな乳製品イノベーションに対する需要の高まりに伴い、代替乳製品の消費は予測期間中にさらに増加すると予想されます。
代替乳製品産業の概要
代替乳製品市場は断片化されており、上位5社で22.52%を占めています。この市場の主要企業は以下の通り。 Blue Diamond Growers, Danone SA, Hebei Yangyuan Zhihui Beverage, Oatly Group AB and Saputo Inc.(sorted alphabetically).
その他の特典
- エクセル形式の市場予測(ME)シート
- 3ヶ月間のアナリストサポート
目次
第1章 エグゼクティブサマリーと主な調査結果
第2章 レポートのオファー
第3章 イントロダクション
- 調査の前提条件と市場定義
- 調査範囲
- 調査手法
第4章 主要産業動向
- 一人当たり消費量
- 原材料/商品生産
- 代替乳製品-原材料生産
- 規制の枠組み
- オーストラリア
- カナダ
- 中国
- エジプト
- フランス
- ドイツ
- インド
- イタリア
- 日本
- メキシコ
- サウジアラビア
- 南アフリカ
- 韓国
- アラブ首長国連邦
- 英国
- 米国
- バリューチェーンと流通チャネル分析
第5章 市場セグメンテーション
- カテゴリー
- 非乳製品バター
- 非乳製品チーズ
- 非乳製品アイスクリーム
- 非乳製品ミルク
- 製品タイプ別
- アーモンドミルク
- カシューミルク
- ココナッツミルク
- ヘーゼルナッツミルク
- ヘンプミルク
- オートミルク
- 豆乳
- 非乳製品ヨーグルト
- 流通チャネル
- オフトレード
- コンビニエンスストア
- オンライン小売
- 専門小売店
- スーパーマーケットとハイパーマーケット
- その他(倉庫クラブ、ガソリンスタンドなど)
- オン・トレード
- オフトレード
- 地域
- アフリカ
- カテゴリー別
- 流通チャネル別
- 国別
- エジプト
- ナイジェリア
- 南アフリカ
- その他のアフリカ
- アジア太平洋
- カテゴリー別
- 流通チャネル別
- 国別
- オーストラリア
- 中国
- インド
- インドネシア
- 日本
- マレーシア
- ニュージーランド
- パキスタン
- 韓国
- その他のアジア太平洋
- 欧州
- カテゴリー別
- 流通チャネル別
- 国別
- ベルギー
- フランス
- ドイツ
- イタリア
- オランダ
- ロシア
- スペイン
- トルコ
- 英国
- その他の欧州
- 中東
- カテゴリー別
- 流通チャネル別
- 国別
- バーレーン
- イラン
- クウェート
- オマーン
- カタール
- サウジアラビア
- アラブ首長国連邦
- その他の中東
- 北米
- カテゴリー別
- 流通チャネル別
- 国別
- カナダ
- メキシコ
- 米国
- その他の北米
- 南米
- カテゴリー別
- 流通チャネル別
- 国別
- アルゼンチン
- ブラジル
- その他の南米
- アフリカ
第6章 競合情勢
- 主要な戦略動向
- 市場シェア分析
- 企業情勢
- 企業プロファイル.
- Blue Diamond Growers
- Califia Farms LLC
- Danone SA
- Hebei Yangyuan Zhihui Beverage Co. Ltd
- Oatly Group AB
- Otsuka Holdings Co. Ltd
- Sahmyook Foods
- Saputo Inc.
- The Hain Celestial Group Inc.
- VBites Foods Ltd
- Vitasoy International Holdings Ltd
第7章 CEOへの主な戦略的質問
第8章 付録
- 世界概要
- 概要
- ファイブフォース分析フレームワーク
- 世界のバリューチェーン分析
- 市場力学(DROs)
- 情報源と参考文献
- 図表一覧
- 主要洞察
- データパック
- 用語集
目次
Product Code: 50977
The Dairy Alternatives Market size is estimated at 35.53 billion USD in 2025, and is expected to reach 59.8 billion USD by 2030, growing at a CAGR of 10.97% during the forecast period (2025-2030).
The sales through off trade channels particularly through supermarket/ hypermarket and online drove the segment
- By distribution channel, the global dairy alternatives market has been divided into two major segments: on-trade retailing and off-trade retailing. The off-trade channel plays a major role in the sales of dairy alternative products worldwide. Among off-trade channels, supermarkets and hypermarkets are the most popular.
- Supermarkets and hypermarkets are considered ideal options for customers to shop, allowing them to select products from dairy alternatives like milk, yogurt, and ice cream. Thus, this channel is considered the primary sales channel for dairy alternative products. They account for more than 60% of overall sales worldwide.
- The online channel is projected to be the fastest-growing distribution channel for dairy alternatives, and it is anticipated to grow by 5.59% during 2023-2024. The number of e-commerce, grocery, or food delivery platforms is increasing in the market. As part of strategic expansion, leading retailers team up with purely online retailers to launch their own online services. For example, Morrisons, Booths, and Co-op's own-label products are also sold online via Amazon Fresh. Asda, Tesco, Amazon Fresh, Sainsbury's, Waitrose, Iceland, Morrisons, Gorillas, and Weezy offer same-day online delivery.
- With the growing vegan population and lactose intolerant consumers, the demand from the on-trade segment, especially fast food restaurants and cafes, is expected to increase the demand for different dairy alternative products.
Explosive plant-based milk consumption led by Asia Pacific consumers is fueling the market growth
- Global consumption of dairy alternatives grew by 41.7% from 2019 to 2023. Dairy alternatives have become a part of daily diets across countries globally. North America and Asia-Pacific are expected to be the largest regions in terms of dairy alternatives consumption, with market volume shares of 35% and 34.1%, respectively, in 2023.
- The rise in the vegan population, in line with the rising awareness of plant-based nutrition, is driving the demand for dairy alternatives in the Asia-Pacific region. China, Japan, and South Korea exhibit significantly higher consumption of dairy alternatives compared to other Asian countries. In 2023, the three countries are expected to collectively hold a 79.77% share of the total consumption of dairy alternative products in the region.
- In 2021, around 67.8 thousand metric tons of soybeans were used to produce soy milk and soy milk-based products in Japan, resulting in the production of approximately 123 thousand kiloliters of soy milk. In Japan, beverages with the term "soy milk" refer to unprocessed soy milk that does not contain additional sugar, salt, or vegetable oils. The per capita consumption of dairy alternatives is estimated to reach 0.45 kg annually in 2029, up by 15.47% from 0.39 kg in 2023 in Japan.
- In North America, dairy alternatives sales by value are estimated to expand by 28% during 2024-2027, reaching USD 13715 million in 2027. Plant-based milk is significantly consumed across the region, with soy and almond milk being the most popular in key countries such as the United States, Canada, and Mexico. The United States has the highest production volume of almonds of any country worldwide, amounting to around 2,002,742 tons annually. Such factors are increasing the production of almond milk every year.
Global Dairy Alternatives Market Trends
The increasing vegan population, lactose intolerance, and growing awareness about the health and environmental benefits of dairy alternatives are driving the consumption of different types of dairy alternative products worldwide.
- The consumption of different types of dairy alternative products is increasing worldwide due to a significant increase in the vegan population, coupled with a growing lactose-intolerant population. Even vegan exhibitions/trade shows and music festivals are being conducted in different countries to promote a vegan lifestyle. For example, Australia has the third-highest percentage of vegans per capita globally. As of 2022, 2.5 million were vegans and vegetarians in the country.
- Plant-based milk is the largest consumed category among all dairy alternatives worldwide. Soy milk, almond milk, and oat milk were highly popular and collectively registered more than 70% share in the overall plant milk consumption in 2022. This was due to the increasing prevalence of milk allergies driving demand for plant-based milk worldwide. For example, soy milk is a rich source of vitamins, proteins, and potassium and has a lower calorie content than cow milk. Due to its high nutrient content, it is considered an ideal substitute for dairy products.
- There is a huge demand for non-dairy cheese varieties, such as plant-based cheese, especially sliced cheese, with great sales value in several countries. Spanish and German consumers reveal the highest readiness to eat plant-based cheese instead of conventional ones. For instance, German consumers prefer plant-based cream cheese (32%), sliced cheese (32%), and plant-based mozzarella (31%) available in supermarkets. With the growing demand for new plant-based dairy innovations, the consumption of dairy alternatives is anticipated to increase further during the forecast period.
Dairy Alternatives Industry Overview
The Dairy Alternatives Market is fragmented, with the top five companies occupying 22.52%. The major players in this market are Blue Diamond Growers, Danone SA, Hebei Yangyuan Zhihui Beverage Co. Ltd, Oatly Group AB and Saputo Inc. (sorted alphabetically).
Additional Benefits:
- The market estimate (ME) sheet in Excel format
- 3 months of analyst support
TABLE OF CONTENTS
1 EXECUTIVE SUMMARY & KEY FINDINGS
2 REPORT OFFERS
3 INTRODUCTION
- 3.1 Study Assumptions & Market Definition
- 3.2 Scope of the Study
- 3.3 Research Methodology
4 KEY INDUSTRY TRENDS
- 4.1 Per Capita Consumption
- 4.2 Raw Material/commodity Production
- 4.2.1 Dairy Alternative - Raw Material Production
- 4.3 Regulatory Framework
- 4.3.1 Australia
- 4.3.2 Canada
- 4.3.3 China
- 4.3.4 Egypt
- 4.3.5 France
- 4.3.6 Germany
- 4.3.7 India
- 4.3.8 Italy
- 4.3.9 Japan
- 4.3.10 Mexico
- 4.3.11 Saudi Arabia
- 4.3.12 South Africa
- 4.3.13 South Korea
- 4.3.14 United Arab Emirates
- 4.3.15 United Kingdom
- 4.3.16 United States
- 4.4 Value Chain & Distribution Channel Analysis
5 MARKET SEGMENTATION (includes market size in Value in USD and Volume, Forecasts up to 2030 and analysis of growth prospects)
- 5.1 Category
- 5.1.1 Non-Dairy Butter
- 5.1.2 Non-Dairy Cheese
- 5.1.3 Non-Dairy Ice Cream
- 5.1.4 Non-Dairy Milk
- 5.1.4.1 By Product Type
- 5.1.4.1.1 Almond Milk
- 5.1.4.1.2 Cashew Milk
- 5.1.4.1.3 Coconut Milk
- 5.1.4.1.4 Hazelnut Milk
- 5.1.4.1.5 Hemp Milk
- 5.1.4.1.6 Oat Milk
- 5.1.4.1.7 Soy Milk
- 5.1.5 Non-Dairy Yogurt
- 5.2 Distribution Channel
- 5.2.1 Off-Trade
- 5.2.1.1 Convenience Stores
- 5.2.1.2 Online Retail
- 5.2.1.3 Specialist Retailers
- 5.2.1.4 Supermarkets and Hypermarkets
- 5.2.1.5 Others (Warehouse clubs, gas stations, etc.)
- 5.2.2 On-Trade
- 5.2.1 Off-Trade
- 5.3 Region
- 5.3.1 Africa
- 5.3.1.1 By Category
- 5.3.1.2 By Distribution Channel
- 5.3.1.3 By Country
- 5.3.1.3.1 Egypt
- 5.3.1.3.2 Nigeria
- 5.3.1.3.3 South Africa
- 5.3.1.3.4 Rest of Africa
- 5.3.2 Asia-Pacific
- 5.3.2.1 By Category
- 5.3.2.2 By Distribution Channel
- 5.3.2.3 By Country
- 5.3.2.3.1 Australia
- 5.3.2.3.2 China
- 5.3.2.3.3 India
- 5.3.2.3.4 Indonesia
- 5.3.2.3.5 Japan
- 5.3.2.3.6 Malaysia
- 5.3.2.3.7 New Zealand
- 5.3.2.3.8 Pakistan
- 5.3.2.3.9 South Korea
- 5.3.2.3.10 Rest of Asia Pacific
- 5.3.3 Europe
- 5.3.3.1 By Category
- 5.3.3.2 By Distribution Channel
- 5.3.3.3 By Country
- 5.3.3.3.1 Belgium
- 5.3.3.3.2 France
- 5.3.3.3.3 Germany
- 5.3.3.3.4 Italy
- 5.3.3.3.5 Netherlands
- 5.3.3.3.6 Russia
- 5.3.3.3.7 Spain
- 5.3.3.3.8 Turkey
- 5.3.3.3.9 United Kingdom
- 5.3.3.3.10 Rest of Europe
- 5.3.4 Middle East
- 5.3.4.1 By Category
- 5.3.4.2 By Distribution Channel
- 5.3.4.3 By Country
- 5.3.4.3.1 Bahrain
- 5.3.4.3.2 Iran
- 5.3.4.3.3 Kuwait
- 5.3.4.3.4 Oman
- 5.3.4.3.5 Qatar
- 5.3.4.3.6 Saudi Arabia
- 5.3.4.3.7 United Arab Emirates
- 5.3.4.3.8 Rest of Middle East
- 5.3.5 North America
- 5.3.5.1 By Category
- 5.3.5.2 By Distribution Channel
- 5.3.5.3 By Country
- 5.3.5.3.1 Canada
- 5.3.5.3.2 Mexico
- 5.3.5.3.3 United States
- 5.3.5.3.4 Rest of North America
- 5.3.6 South America
- 5.3.6.1 By Category
- 5.3.6.2 By Distribution Channel
- 5.3.6.3 By Country
- 5.3.6.3.1 Argentina
- 5.3.6.3.2 Brazil
- 5.3.6.3.3 Rest of South America
- 5.3.1 Africa
6 COMPETITIVE LANDSCAPE
- 6.1 Key Strategic Moves
- 6.2 Market Share Analysis
- 6.3 Company Landscape
- 6.4 Company Profiles (includes Global Level Overview, Market Level Overview, Core Business Segments, Financials, Headcount, Key Information, Market Rank, Market Share, Products and Services, and Analysis of Recent Developments).
- 6.4.1 Blue Diamond Growers
- 6.4.2 Califia Farms LLC
- 6.4.3 Danone SA
- 6.4.4 Hebei Yangyuan Zhihui Beverage Co. Ltd
- 6.4.5 Oatly Group AB
- 6.4.6 Otsuka Holdings Co. Ltd
- 6.4.7 Sahmyook Foods
- 6.4.8 Saputo Inc.
- 6.4.9 The Hain Celestial Group Inc.
- 6.4.10 VBites Foods Ltd
- 6.4.11 Vitasoy International Holdings Ltd
7 KEY STRATEGIC QUESTIONS FOR DAIRY AND DAIRY ALTERNATIVE CEOS
8 APPENDIX
- 8.1 Global Overview
- 8.1.1 Overview
- 8.1.2 Porter's Five Forces Framework
- 8.1.3 Global Value Chain Analysis
- 8.1.4 Market Dynamics (DROs)
- 8.2 Sources & References
- 8.3 List of Tables & Figures
- 8.4 Primary Insights
- 8.5 Data Pack
- 8.6 Glossary of Terms
