
|
市場調査レポート
商品コード
1693868
米国の代替乳製品:市場シェア分析、産業動向、統計、成長予測(2025~2030年)United States Dairy Alternatives - Market Share Analysis, Industry Trends & Statistics, Growth Forecasts (2025 - 2030) |
||||||
カスタマイズ可能
適宜更新あり
|
|||||||
| 米国の代替乳製品:市場シェア分析、産業動向、統計、成長予測(2025~2030年) |
|
出版日: 2025年03月18日
発行: Mordor Intelligence
ページ情報: 英文 200 Pages
納期: 2~3営業日
|

全表示
- 概要
- 目次
概要
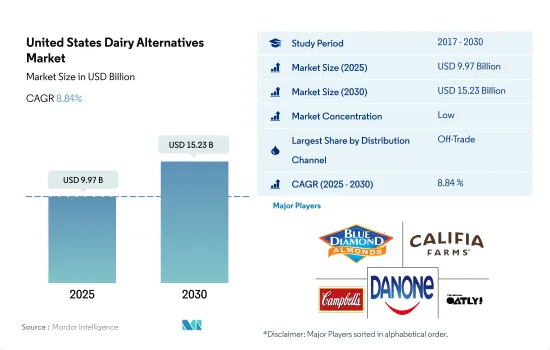
米国の乳製品代替市場規模は2025年に99億7,000万米ドルと推定され、2030年には152億3,000万米ドルに達し、予測期間中(2025~2030年)のCAGRは8.84%で成長すると予測されます。
市場を牽引するのは取引外の小売チャネルが牽引する植物性乳の持続的成長
- 2020年、消費者はこれまで以上に多くの植物性乳製品を食料品小売店(オフトレード)を通じて購入し、売上は14%増加しました。代替乳製品の全カテゴリーが成長を示し、2020年に大幅な成長を記録した後も安定を維持することができました。これは、店内のあらゆる場所やオンラインプラットフォームにおいて、ブランドにとって大きな機会があることを示しています。2021年には、42%の世帯が植物性ミルクを購入し、植物性ミルク購入者の76%が複数回購入しています。
- 消費者はレストランや外食店よりも自宅で代替乳製品を摂取することを好むため、この国では現在、オンチャネルの市場が未成熟です。代替乳を含む食事や軽食の約93%は家庭で消費され、レストランや外食店で消費されるのはわずか7%です。食品サービス産業では、植物性食品は、業務用と非業務用の食品サービス店舗に広範な食品サービス流通を通じて出荷される全食品の1%以下です。
- すべての製品カテゴリーにおいて、植物性乳製品の販売は依然として非売品が中心です。例えば、植物性乳製品は、従来型チャネルでは牛乳小売売上高の16%、Natural Enhancedチャネルでは40%を占めています。後者は50以上の小売業者と約2,000の自然派小売店を代表しています。
- オンラインチャネルは、2023~2025年までの前年比成長率が32%と予測され、オフトレードセグメントで最も急成長する流通チャネルになると予想されます。食料品のオンラインショッピングに移行した買い物客の61.1%にとって、利便性が主要動機となっています。この成長は、2020~2021年にかけて1,100万人増加したスマートフォンユーザーの増加に起因しています。
米国の代替乳製品市場動向
北米における代替乳製品消費の急増:動物福祉への関心の高まりと植物由来の食品企業への投資が原動力
- 米国では、投資と革新的な製品に支えられ、一人当たりの代替乳製品消費量が大きく伸びています。この動向により、米国の消費者の52%以上が植物由来の食品を好むようになっています。この変化の背景にある主要理由のひとつは、動物に対する人道的な扱いを欠く工場畜産が米国に蔓延していることから、動物福祉を支援するために菜食主義者のライフスタイルを採用する人が増えていることです。2022年現在、米国の消費者の7%がフレキシタリアンであるのに対し、植物ベースの食事を好む人は12%を超えています。米国ではすべての年齢層が植物ベースの食品に関心を持っているが、20代と30代の関心が最も高いです。
- 同国における植物性乳製品の生産と消費の促進には、政府の支援が重要な役割を果たしています。米国政府は、植物性食品産業の重要性と成長の可能性を認識し、これを促進するためのイニシアチブを取っています。2021年、米国の植物性食品企業は総額50億米ドルの資金を獲得し、2020年から60%増加しました。代替産業の中で最も成熟したセグメントである植物由来の代替品部門は、2021年に19億米ドルの投資を確保しました。2021年時点で、米国の62%、7,900万世帯が植物由来製品を購入しており、2020年の61%、7,700万世帯から増加しています。食料品店で購入できる選択肢はますます多様化しており、ヨーグルト、牛乳、アイスクリーム、チーズといった乳製品の代替品も充実しています。2021年には、バター(23%)、アイスクリーム(26%)、牛乳(26%)、ヨーグルト(22%)、ヨーグルトベースのスムージーやドリンク(27%)の非乳製品バージョンを選ぶ人がかなりの割合を占めます。
米国の代替乳製品産業概要
米国の代替乳製品市場は細分化されており、上位5社で26.32%を占めています。この市場の主要企業は、Blue Diamond Growers、Califia Farms LLC、Campbell Soup Company、Danone SA、Oatly Group ABなどです。
その他の特典
- エクセル形式の市場予測(ME)シート
- 3ヶ月のアナリストサポート
目次
第1章 エグゼクティブサマリーと主要調査結果
第2章 レポートのオファー
第3章 イントロダクション
- 調査の前提条件と市場定義
- 調査範囲
- 調査手法
第4章 主要産業動向
- 一人当たり消費量
- 原料/商品生産
- 代替乳製品-原料生産
- 規制の枠組み
- 米国
- バリューチェーンと流通チャネル分析
第5章 市場セグメンテーション
- カテゴリー
- 非乳製品バター
- 非乳製品チーズ
- 非乳製品アイスクリーム
- 非乳製品ミルク
- 製品タイプ別
- アーモンドミルク
- カシューミルク
- ココナッツミルク
- ヘンプミルク
- オートミルク
- 豆乳
- 非乳製品ヨーグルト
- 流通チャネル
- オフトレード
- コンビニエンスストア
- オンライン小売
- 専門小売店
- スーパーマーケットとハイパーマーケット
- その他(倉庫クラブ、ガソリンスタンドなど)
- オントレード
- オフトレード
第6章 競合情勢
- 主要な戦略動向
- 市場シェア分析
- 企業情勢
- 企業プロファイル
- Blue Diamond Growers
- Califia Farms LLC
- Campbell Soup Company
- Danone SA
- Miyoko's Creamery
- Nuts for Cheese
- Oatly Group AB
- Ripple Foods PBC
- SunOpta Inc.
- The J.M. Smucker Company
- Tofutti Brands Inc.
第7章 CEOへの主要戦略的質問
第8章 付録
- 世界概要
- 概要
- ファイブフォース分析フレームワーク
- 世界のバリューチェーン分析
- 市場力学(DROs)
- 情報源と参考文献
- 図表一覧
- 主要な洞察
- データパック
- 用語集
目次
Product Code: 50000727
The United States Dairy Alternatives Market size is estimated at 9.97 billion USD in 2025, and is expected to reach 15.23 billion USD by 2030, growing at a CAGR of 8.84% during the forecast period (2025-2030).
Market is driven by sustainable growth in sales of plant-based milk led by off-trade retail channels
- Consumers purchased more plant-based dairy through retail groceries (off-trade) than ever in 2020, resulting in a 14% increase in sales. All categories of dairy alternatives showed growth, which was able to hold steady after recording significant growth in 2020. This demonstrates the incredible opportunities available for brands in every part of the store and across online platforms. In 2021, 42% of households purchased plant-based milk, and 76% of plant-based milk buyers made multiple purchases.
- The country currently has a nascent market for on-trade channels, as consumers prefer to consume dairy alternatives at home rather than at restaurants or food service outlets. Approximately 93% of meals or snacks that include milk alternatives are consumed at home, while only 7% are consumed at a restaurant or food service outlet. Within the food service industry, plant-based foods account for less than 1% of all foods shipped through broadline foodservice distribution to commercial and non-commercial food service outlets.
- Off-trade remains the primary outlet for sales of plant-based dairy across all product categories. For example, plant-based milk occupies 16% of all retail milk dollar sales in conventional channels and 40% in the Natural Enhanced Channel. The latter represents over 50 retailers and approximately 2,000 natural retail stores.
- The online channel is expected to be the fastest-growing distribution channel in the off-trade segment, with a projected Y-o-Y growth rate of 32% from 2023 to 2025. Convenience is the primary motivation for 61.1% of shoppers who have transitioned to shopping for groceries online. This growth can be attributed to the increasing number of smartphone users, which saw an increase of 11 million between 2020 and 2021.
United States Dairy Alternatives Market Trends
The surge in dairy alternatives consumption in North America: driven by growing animal welfare concerns and investments in plant-based food companies
- The consumption of dairy alternatives per person is experiencing significant growth in the United States, supported by investments and innovative products. This trend is leading to more than 52% of US consumers showing a preference for plant-based foods. One of the primary reasons behind this shift is the increasing number of people adopting a vegan lifestyle to support animal welfare, given that factory farming, which lacks humane treatment of animals, is prevalent in the United States. As of 2022, 7% of US consumers adhered to a flexitarian diet, compared to over 12% who prefer a plant-based diet. Although individuals of all age groups in the United States are interested in plant-based foods, those in their 20s and 30s exhibit the highest level of interest.
- Governmental support plays a significant role in boosting the production and consumption of plant-based dairy products in the country. Recognizing the importance and growth potential of the plant-based food industry, the US government has taken initiatives to promote it. In 2021, plant-based food companies in the United States received a total of USD 5 billion in funding, marking a 60% increase from 2020. The most mature segment of the alternative industry, the plant-based alternatives sector, secured USD 1.9 billion in investments in 2021. As of 2021, 62% or 79 million US households purchased plant-based products, representing an increase from 61% or 77 million households in 2020. The options available at grocery stores are becoming increasingly diverse, with a wide range of dairy alternatives such as yogurt, milk, ice cream, and cheese. In 2021, a significant portion of the population chose non-dairy versions of butter (23%), ice cream (26%), milk (26%), yogurt (22%), and yogurt-based smoothies or drinks (27%).
United States Dairy Alternatives Industry Overview
The United States Dairy Alternatives Market is fragmented, with the top five companies occupying 26.32%. The major players in this market are Blue Diamond Growers, Califia Farms LLC, Campbell Soup Company, Danone SA and Oatly Group AB (sorted alphabetically).
Additional Benefits:
- The market estimate (ME) sheet in Excel format
- 3 months of analyst support
TABLE OF CONTENTS
1 EXECUTIVE SUMMARY & KEY FINDINGS
2 REPORT OFFERS
3 INTRODUCTION
- 3.1 Study Assumptions & Market Definition
- 3.2 Scope of the Study
- 3.3 Research Methodology
4 KEY INDUSTRY TRENDS
- 4.1 Per Capita Consumption
- 4.2 Raw Material/commodity Production
- 4.2.1 Dairy Alternative - Raw Material Production
- 4.3 Regulatory Framework
- 4.3.1 United States
- 4.4 Value Chain & Distribution Channel Analysis
5 MARKET SEGMENTATION (includes market size in Value in USD and Volume, Forecasts up to 2030 and analysis of growth prospects)
- 5.1 Category
- 5.1.1 Non-Dairy Butter
- 5.1.2 Non-Dairy Cheese
- 5.1.3 Non-Dairy Ice Cream
- 5.1.4 Non-Dairy Milk
- 5.1.4.1 By Product Type
- 5.1.4.1.1 Almond Milk
- 5.1.4.1.2 Cashew Milk
- 5.1.4.1.3 Coconut Milk
- 5.1.4.1.4 Hemp Milk
- 5.1.4.1.5 Oat Milk
- 5.1.4.1.6 Soy Milk
- 5.1.5 Non-Dairy Yogurt
- 5.2 Distribution Channel
- 5.2.1 Off-Trade
- 5.2.1.1 Convenience Stores
- 5.2.1.2 Online Retail
- 5.2.1.3 Specialist Retailers
- 5.2.1.4 Supermarkets and Hypermarkets
- 5.2.1.5 Others (Warehouse clubs, gas stations, etc.)
- 5.2.2 On-Trade
- 5.2.1 Off-Trade
6 COMPETITIVE LANDSCAPE
- 6.1 Key Strategic Moves
- 6.2 Market Share Analysis
- 6.3 Company Landscape
- 6.4 Company Profiles (includes Global Level Overview, Market Level Overview, Core Business Segments, Financials, Headcount, Key Information, Market Rank, Market Share, Products and Services, and Analysis of Recent Developments).
- 6.4.1 Blue Diamond Growers
- 6.4.2 Califia Farms LLC
- 6.4.3 Campbell Soup Company
- 6.4.4 Danone SA
- 6.4.5 Miyoko's Creamery
- 6.4.6 Nuts for Cheese
- 6.4.7 Oatly Group AB
- 6.4.8 Ripple Foods PBC
- 6.4.9 SunOpta Inc.
- 6.4.10 The J.M. Smucker Company
- 6.4.11 Tofutti Brands Inc.
7 KEY STRATEGIC QUESTIONS FOR DAIRY AND DAIRY ALTERNATIVE CEOS
8 APPENDIX
- 8.1 Global Overview
- 8.1.1 Overview
- 8.1.2 Porter's Five Forces Framework
- 8.1.3 Global Value Chain Analysis
- 8.1.4 Market Dynamics (DROs)
- 8.2 Sources & References
- 8.3 List of Tables & Figures
- 8.4 Primary Insights
- 8.5 Data Pack
- 8.6 Glossary of Terms

