
|
市場調査レポート
商品コード
1685884
北米の代替乳製品:市場シェア分析、産業動向、成長予測(2025年~2030年)North America Dairy Alternatives - Market Share Analysis, Industry Trends & Statistics, Growth Forecasts (2025 - 2030) |
||||||
カスタマイズ可能
適宜更新あり
|
|||||||
| 北米の代替乳製品:市場シェア分析、産業動向、成長予測(2025年~2030年) |
|
出版日: 2025年03月18日
発行: Mordor Intelligence
ページ情報: 英文 228 Pages
納期: 2~3営業日
|

全表示
- 概要
- 目次
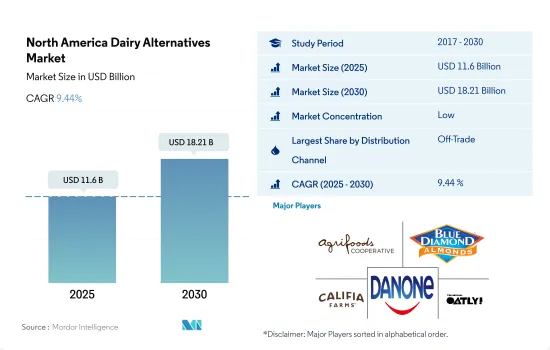
北米の代替乳製品市場規模は2025年に116億米ドルと推定され、2030年には182億1,000万米ドルに達し、予測期間(2025年~2030年)のCAGRは9.44%で成長すると予測されます。
オンライン小売チャネルは多くのブランドと提携して売上を伸ばしている
- 北米代替乳製品市場の流通チャネルは、オン・トレードとオフ・トレードに区分されます。同地域における代替乳製品の販売では、オフトレード・チャネルが主要な役割を果たしています。スーパーマーケットとハイパーマーケットが、北米の代替乳製品市場における最大の商外流通チャネルです。これらのチャネルは、特に大都市や発展した都市では近接性が高く、消費者の購買決定に影響を与えるという利点があります。2022年には、スーパーマーケットとハイパーマーケットを通じた代替乳製品の販売額は、他の小売チャネルと比較して73.4%以上を占めました。
- 植物性ミルクは小売チャネル全体の売上において大きな役割を果たしています。2021年、植物性乳の販売額は2020年比で8.5%増加したが、動物性乳の販売額は2%減少しました。同年、42%の世帯が植物性ミルクを購入し、76%が小売チャネルから複数回購入しています。
- 北米のオンラインチャネルは、代替乳製品の流通チャネルとして最も急成長すると予測されます。2024年には2021年比で44%の成長が見込まれます。オンライン小売業者はブランドと提携し、棚スペースを拡大し、品揃えを増やし、植物由来の製品を幅広く提供することで消費者の買い物体験を向上させています。2021年時点で、カナダ人の22%以上が食料品のオンライン購入を好みます。
爆発的な人口消費と政府の後押しが市場成長を後押し
- 北米の代替乳製品市場は、乳糖不耐症の増加と健康的な食生活の採用により、世界市場を独占しています。2022年現在、3,000万~5,000万人のアメリカ人が乳糖不耐症であることが判明しています。最も好まれる乳製品不使用の製品は、牛乳、バター、冷凍デザート、チーズです。
- 米国は、この地域における代替乳製品の主要市場です。2024年から2027年にかけて、金額ベースで26%という最も速い前年比成長率を記録すると予測されています。需要が高いのは、ナッツ(アーモンド)と大豆の生産量が多いためです。例えば、米国は年間約200万2,742トンのアーモンドを生産しており、世界のアーモンド生産量の80%を占めています。アメリカの消費者は新製品を試すことに非常に前向きであるため、継続的な製品の発売が、同国における代替乳製品の販売を促進する重要な要因となっています。
- 2021年時点で、米国の62%、7,900万世帯が植物由来製品を購入しており、2020年の61%、7,700万世帯から増加しています。
- カナダは代替乳製品市場第2位です。政府の支援が、同国における非乳製品の売上を押し上げる主な要因となっています。2018年、政府は代替乳製品産業をスーパークラスター・イニシアチブに含め、その開発に1億5,000万米ドルを投資しました。2021年にはさらに1億7,300万米ドルを投資しました。
- 生活習慣病や乳糖不耐症の増加が予想されるため、代替乳製品の売上は伸びると予想されます。北米の代替乳製品市場は、2023年と比較して2025年には16%成長すると予測されています。
北米の代替乳製品市場の動向
菜食主義者とフレキシタリアン人口の増加が北米の代替乳製品消費を牽引
- 米国では一人当たりの消費量がかなりの割合で増加しており、投資と技術革新の両方が行われています。2022年には2021年から5.56%の成長を記録したが、これは主に菜食主義を実践する消費者の増加によるものです。環境問題や関連する健康上の利点から、乳製品の代替品を好む消費者がいます。米国の人口の大半は、乳製品やその他の乳製品を排除する代わりに、消費量を減らしています。また、菜食主義者よりもフレキシタリアンである傾向が強いです。米国の消費者の12%近くが植物ベースの食事を好むのに対し、2022年時点では7%がフレキシタリアンです。
- オート麦、大豆、エンドウ豆、アーモンドの一人当たり消費量は、植物性肉製品、菓子類、パン類、飲食品など、さまざまな食品に幅広く応用されているため、常に増加しています。2020年の代替乳飲料の小売売上高は、カナダで3億3,690万米ドル、米国で28億米ドルでした。牛乳や卵などの動物性食品や製品別に対するアレルギーの蔓延は、消費者に代替乳への切り替えを促している理由のひとつです。2022年現在、カナダ人の約59%、メキシコ人の48%が乳糖不耐症です。主に若者の間で流行しているベジタリアンやビーガンの動向の結果、メキシコの消費者の20%が"乳製品や動物から作られる食品の摂取を減らすか、または排除している"。以前は、ベジタリアンとノンベジタリアンの2つのカテゴリーしかありませんでした。
北米の代替乳製品産業の概要
北米の代替乳製品市場は断片化されており、上位5社で26.56%を占めています。この市場の主要企業は以下の通り。 Agrifoods International Cooperative Ltd, Blue Diamond Growers, Califia Farms LLC, Danone SA and Oatly Group AB(sorted alphabetically).
その他の特典
- エクセル形式の市場予測(ME)シート
- 3ヶ月のアナリストサポート
目次
第1章 エグゼクティブサマリーと主な調査結果
第2章 レポートのオファー
第3章 イントロダクション
- 調査の前提条件と市場定義
- 調査範囲
- 調査手法
第4章 主要産業動向
- 一人当たり消費量
- 原材料/商品生産
- 代替乳製品-原材料生産
- 規制の枠組み
- カナダ
- メキシコ
- 米国
- バリューチェーンと流通チャネル分析
第5章 市場セグメンテーション
- カテゴリー
- 非乳製品バター
- 非乳製品チーズ
- 非乳製品アイスクリーム
- 非乳製品ミルク
- 製品タイプ別
- アーモンドミルク
- カシューミルク
- ココナッツミルク
- ヘンプミルク
- オートミルク
- 豆乳
- 非乳製品ヨーグルト
- 流通チャネル
- オフトレード
- コンビニエンスストア
- オンライン小売
- 専門小売店
- スーパーマーケットとハイパーマーケット
- その他(倉庫クラブ、ガソリンスタンドなど)
- オン・トレード
- オフトレード
- 国名
- カナダ
- メキシコ
- 米国
- その他の北米地域
第6章 競争情勢
- 主要な戦略動向
- 市場シェア分析
- 企業情勢
- 企業プロファイル.
- Agrifoods International Cooperative Ltd
- Blue Diamond Growers
- Califia Farms LLC
- Campbell Soup Company
- Danone SA
- Eden Foods Inc.
- Kite Hill
- Land O'Lakes Inc.
- Miyoko's Creamery
- Oatly Group AB
- Otsuka Holdings Co. Ltd
- SunOpta Inc.
- The J.M. Smucker Company
第7章 CEOへの主な戦略的質問
第8章 付録
- 世界概要
- 概要
- ファイブフォース分析フレームワーク
- 世界のバリューチェーン分析
- 市場力学(DROs)
- 情報源と参考文献
- 図表一覧
- 主要洞察
- データパック
- 用語集
The North America Dairy Alternatives Market size is estimated at 11.6 billion USD in 2025, and is expected to reach 18.21 billion USD by 2030, growing at a CAGR of 9.44% during the forecast period (2025-2030).
Online retail channels are partnering with many brands to boost their sales
- The distribution channel of the North American dairy alternatives market is segmented into on-trade and off-trade. The off-trade channel plays a major role in the sales of alternative dairy products in the region. Supermarkets and hypermarkets are the largest off-trade distribution channels in the North American dairy alternatives market. The proximity factor of these channels, especially in large and developed cities, provides them with an added advantage of influencing the consumers' purchasing decisions. In 2022, the sales value of dairy alternatives through supermarkets and hypermarkets accounted for more than 73.4% compared to other retail channels.
- Plant-based milk plays a major role in the overall sales of retail channels. In 2021, the sales value of plant-based milk increased by 8.5% compared to 2020, while animal-based milk sales declined by 2%. In the same year, 42% of households purchased plant-based milk, and 76% bought it multiple times from retail channels.
- The online channel in North America is projected to be the fastest-growing distribution channel for dairy alternatives. It is anticipated to grow by 44% in 2024 compared to 2021. Online retailers are partnering with brands to expand their shelf space, increase assortments, and improve consumers' shopping experience by offering a wide range of plant-based products. As of 2021, more than 22% of Canadians preferred to buy groceries online.
Explosive population consumption and government backing is fueling the market growth
- The North American dairy alternatives market dominates the global market due to the increasing lactose intolerance and adoption of healthy diets. As of 2022, 30-50 million Americans were found to be lactose intolerant. The most preferred dairy-free products are milk, butter, frozen desserts, and cheese.
- The United States is the leading market for dairy alternatives in the region. It is projected to register the fastest Y-o-Y growth rate of 26% by value during 2024-2027. The higher demand is due to the higher production volume of nuts (almonds) and soybeans. For example, the United States produces around 2,002,742 metric tons of almonds annually, accounting for 80% of the world's almond production. Continuous product launches are the key factor promoting the sales of dairy alternatives in the country, as American consumers are highly open to trying new products.
- As of 2021, 62% or 79 million US households bought plant-based products, an increase from 61% or 77 million in 2020.
- Canada is the second-leading market for dairy alternatives. Government support is the primary factor boosting the sales of non-dairy products in the country. In 2018, the government included the dairy alternatives industry in its Supercluster Initiative and invested USD 150 million in its development. In 2021, it invested an additional USD 173 million.
- The sales of dairy alternatives are expected to grow due to an anticipated increase in lifestyle disorders and lactose intolerance. The North American dairy alternatives market is projected to grow by a value of 16% in 2025 compared to 2023.
North America Dairy Alternatives Market Trends
Increasing vegan and flexitarian populations driving the consumption of dairy alternatives in North America
- The per capita consumption is increasing at a considerable rate in the United States, resulting in both investments and innovations. It registered a growth of 5.56% in 2022 from 2021, primarily due to the rise in consumers following a vegan diet. There is a section of consumers that prefer dairy alternatives because of environmental concerns and associated health benefits. The majority of the US population is consuming lesser dairy and other dairy by-products instead of eliminating them. They also tend to be more flexitarian than vegan. Nearly 12% of consumers in the United States preferred a plant-based diet, whereas 7% of consumers followed a flexitarian diet as of 2022.
- There is a constant rise in the per capita consumption of oat, soybeans, pea, and almonds due to their wide applications in different food products like plant-based meat products, confectionery, bakeries, and beverages. In 2020, retail sales of milk alternative beverages were valued at USD 336.9 million in Canada and USD 2.8 billion in the United States. The prevalence of allergies to animal products and by-products, like cow's milk and eggs, is among the reasons that have prompted consumers to switch to dairy alternatives. As of 2022, nearly 59% of the Canadian population and 48% of Mexicans were lactose intolerant. As a result of the current vegetarian or vegan trends, which are primarily popular among young people, 20% of Mexican consumers have "reduced or eliminated the consumption of dairy or foods produced from animals." Previously there were only two categories, i.e., vegetarian and non-vegetarian.
North America Dairy Alternatives Industry Overview
The North America Dairy Alternatives Market is fragmented, with the top five companies occupying 26.56%. The major players in this market are Agrifoods International Cooperative Ltd, Blue Diamond Growers, Califia Farms LLC, Danone SA and Oatly Group AB (sorted alphabetically).
Additional Benefits:
- The market estimate (ME) sheet in Excel format
- 3 months of analyst support
TABLE OF CONTENTS
1 EXECUTIVE SUMMARY & KEY FINDINGS
2 REPORT OFFERS
3 INTRODUCTION
- 3.1 Study Assumptions & Market Definition
- 3.2 Scope of the Study
- 3.3 Research Methodology
4 KEY INDUSTRY TRENDS
- 4.1 Per Capita Consumption
- 4.2 Raw Material/commodity Production
- 4.2.1 Dairy Alternative - Raw Material Production
- 4.3 Regulatory Framework
- 4.3.1 Canada
- 4.3.2 Mexico
- 4.3.3 United States
- 4.4 Value Chain & Distribution Channel Analysis
5 MARKET SEGMENTATION (includes market size in Value in USD and Volume, Forecasts up to 2030 and analysis of growth prospects)
- 5.1 Category
- 5.1.1 Non-Dairy Butter
- 5.1.2 Non-Dairy Cheese
- 5.1.3 Non-Dairy Ice Cream
- 5.1.4 Non-Dairy Milk
- 5.1.4.1 By Product Type
- 5.1.4.1.1 Almond Milk
- 5.1.4.1.2 Cashew Milk
- 5.1.4.1.3 Coconut Milk
- 5.1.4.1.4 Hemp Milk
- 5.1.4.1.5 Oat Milk
- 5.1.4.1.6 Soy Milk
- 5.1.5 Non-Dairy Yogurt
- 5.2 Distribution Channel
- 5.2.1 Off-Trade
- 5.2.1.1 Convenience Stores
- 5.2.1.2 Online Retail
- 5.2.1.3 Specialist Retailers
- 5.2.1.4 Supermarkets and Hypermarkets
- 5.2.1.5 Others (Warehouse clubs, gas stations, etc.)
- 5.2.2 On-Trade
- 5.2.1 Off-Trade
- 5.3 Country
- 5.3.1 Canada
- 5.3.2 Mexico
- 5.3.3 United States
- 5.3.4 Rest of North America
6 COMPETITIVE LANDSCAPE
- 6.1 Key Strategic Moves
- 6.2 Market Share Analysis
- 6.3 Company Landscape
- 6.4 Company Profiles (includes Global Level Overview, Market Level Overview, Core Business Segments, Financials, Headcount, Key Information, Market Rank, Market Share, Products and Services, and Analysis of Recent Developments).
- 6.4.1 Agrifoods International Cooperative Ltd
- 6.4.2 Blue Diamond Growers
- 6.4.3 Califia Farms LLC
- 6.4.4 Campbell Soup Company
- 6.4.5 Danone SA
- 6.4.6 Eden Foods Inc.
- 6.4.7 Kite Hill
- 6.4.8 Land O'Lakes Inc.
- 6.4.9 Miyoko's Creamery
- 6.4.10 Oatly Group AB
- 6.4.11 Otsuka Holdings Co. Ltd
- 6.4.12 SunOpta Inc.
- 6.4.13 The J.M. Smucker Company
7 KEY STRATEGIC QUESTIONS FOR DAIRY AND DAIRY ALTERNATIVE CEOS
8 APPENDIX
- 8.1 Global Overview
- 8.1.1 Overview
- 8.1.2 Porter's Five Forces Framework
- 8.1.3 Global Value Chain Analysis
- 8.1.4 Market Dynamics (DROs)
- 8.2 Sources & References
- 8.3 List of Tables & Figures
- 8.4 Primary Insights
- 8.5 Data Pack
- 8.6 Glossary of Terms
