
中国の屋内用LED照明:市場シェア分析、産業動向・統計、成長予測(2025年~2030年)
China Indoor LED Lighting - Market Share Analysis, Industry Trends & Statistics, Growth Forecasts (2025 - 2030)- 発行日
- ページ情報
- 英文 168 Pages
- 納期
- 2~3営業日
- 商品コード
- 1683934
- カスタマイズ可能 お客様のご希望に応じて、既存データの加工や未掲載情報(例:国別セグメント)の追加などの対応が可能です。詳細はお問い合わせください。
- 適宜更新あり 本レポートは最新情報反映のため適宜更新し、内容構成変更を行う場合があります。ご検討の際はお問い合わせください。
- 翻訳ツール提供対象 PDF対応AI翻訳ツールの無料貸し出しサービスのご利用が可能です
概要
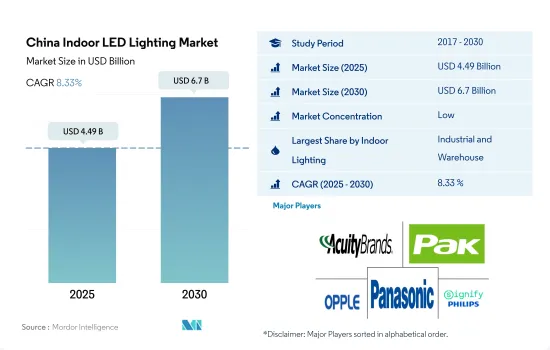
中国の屋内用LED照明市場規模は、2025年に44億9,000万米ドルと推定され、2030年には67億米ドルに達し、予測期間(2025-2030年)のCAGRは8.33%で成長すると予測されています。
スタートアップの増加、製造施設の増加、小売販売の増加が室内照明の需要を高めると予想される
- 2023年には、産業・倉庫(I&W)がシェアの大半(79.6%)を占め、商業、農業、住宅が続きます。市場シェアは今後数年間、すべての用途で最小限の減少にとどまり、(I&W)で増加すると予想されます。中国の産業は、国内消費の低迷、景況感の低下、COVID-19の急増によるサプライチェーンの混乱など、いくつかの内外からの逆風に直面しました。さらに、中国は2021年の工業生産を維持しました。2021年、中国の総生産額は4兆8,658億米ドルとなり、2020年比で26.04%増加しました。このように、工業生産の増加は、今後数年間で屋内照明の需要を創出します。
- 中国全土で自動車製造工場や倉庫の需要が高まっているが、これは世界の自動車市場が、安価な部品や完成車の供給元などの理由で中国に依存しているためです。このような事例から、調査期間中、屋内用LEDの需要が高まることが予想されます。BMWは瀋陽市に新工場を開設し、アウディは長春市の新EV工場で生産を開始しました。
- 中国の小売セクターは引き続き力強い成長の兆しを見せており、2023年5月の小売売上高は前年比12.7%増と急増しました。オンラインショッピング利用者の急増により、同地域では新たな倉庫の必要性がさらに高まり、その結果、屋内照明の需要が高まると予想されます。
- 中国は、10億米ドル規模の新興企業を生み出すトップ企業のひとつです。2022年、中国は新たに74のユニコーンを輩出し、米国に後れを取りました。新ユニコーンの約70%はヘルスケアとスマート・ロジスティクスの分野から生まれており、商業スペースの需要を急増させています。以上のような事例が、来年の屋内LED需要を牽引すると予想されます。
中国の屋内用LED照明市場動向
一人当たり所得の増加が世帯の成長を補完
- 中国の平均世帯人数は2017年に3.03人を記録しました。2021年には2.7人に減少し、個人世帯/住宅所有の増加を示しています。1998年以降、既存の公共住宅が民営化され、持ち家を中心とした民間住宅が大量に供給されたため、中国は公的賃貸住宅が大半を占める国から、持ち家率が最も高い国になりました。2020年までに、中国では90%以上の世帯が住宅を所有するようになる(都市部では87%、農村部では96%)。多くの豊かな国とは対照的に、中国の世帯の20%以上が複数の不動産を所有しています。したがって、不動産数の増加により、国内の照明ニーズに対するLEDの普及が進むと予想されます。
- 中国では、可処分所得が増加しており、その結果、新しい居住スペースにより多くのお金を使う個人の消費力が高まっています。中国の一人当たり所得は、2021年12月の12,615.7米ドルに比べ、2022年12月には12,732.5米ドルに達しました。インドの一人当たり所得は2022年3月時点で2,301.4米ドルであり、中国より低いです。
- 中国では、農村部の1人当たり住宅建築床面積は2019年に48.900㎡と報告され、前年の47.300㎡から増加しました。都市部では、小規模アパート/ワンルームマンションへの投資が増加したため、2020年には38.600㎡となり、2019年の39.800㎡から減少しました。これが国内でのLED照明の成長を後押ししています。例えば、中国の人々は中国の小都市の低価格アパートに投資しています。2012年、中国の家庭は省エネ電球やLEDの使用に対して22億人民元(3,100万米ドル)の補助金プログラムを提供されました。このような事例により、国内でのLED照明の需要が増加すると予想されます。
中国の省エネイニシアチブは同国のLED照明市場を促進する可能性がある
- 2021年、中国の家庭は約1,170テラワット時の電力を使用しました。約5,610テラワット時で、製造業を含む第二次産業部門が最もエネルギーを消費しました。住宅部門と商業部門は2位と3位でした。不動産市場の低迷により、市場の伸びはマイナスです。新規建設は減少しているもの、既存建築物の改修やグリーンビルの建設には大きな成長の可能性があり、中国におけるLED市場の拡大につながります。
- 通常の営業時間中、商業施設の電力使用量はピークに達します。通常、毎日10時間から12時間続きます。産業部門の電力消費は、日中や年中変動がないです。例えば、製造施設は1日24時間、1年365日稼働しています。住宅部門は、夕方に電力需要のピークを迎えることが多く、その時間は5.5時間から7時間です。
- 2021年4月の第14次文化観光開発5ヵ年計画は、200のインテリジェント灯台プロジェクトを設置することで、夜間経済の発展と夜間文化観光国家クラスターの建設を奨励し、LED照明市場の成長を促しました。
- 2022年までに、新基準に基づき、都市部の新建築物の70%をグリーン建築物と認定しなければならないです。同計画によると、すべての公共施設、2万平方メートル以上の建造物、その他の大規模な公共建造物は、中国のグリーン建築評価ラベルの3つ星グリーン建築基準を遵守しなければならないです。LED照明の開発は、中国の省エネルギー重視によって加速されています。
中国の屋内用LED照明産業概要
中国の屋内用LED照明市場は細分化されており、上位5社で28.16%を占めています。この市場の主要企業は以下の通りです。ACUITY BRANDS, INC., Guangdong PAK Corporation, OPPLE Lighting, Panasonic Holdings Corporation and Signify(Philips)(sorted alphabetically).
その他の特典
- エクセル形式の市場予測(ME)シート
- 3ヶ月のアナリストサポート
目次
第1章 エグゼクティブサマリーと主な調査結果
第2章 レポートのオファー
第3章 イントロダクション
- 調査の前提条件と市場定義
- 調査範囲
- 調査手法
第4章 主要産業動向
- 人口
- 一人当たり所得
- LEDの総輸入量
- 照明の電力消費量
- 世帯数
- LED普及率
- 園芸面積
- 規制の枠組み
- 中国
- バリューチェーンと流通チャネル分析
第5章 市場セグメンテーション
- 屋内照明
- 農業用照明
- 商業照明
- オフィス
- 小売
- その他
- 産業・倉庫
- 住宅
第6章 競合情勢
- 主要な戦略動向
- 市場シェア分析
- 企業情勢
- 企業プロファイル(世界レベルの概要、市場レベルの概要、主要な事業セグメント、財務、従業員数、主要情報、市場ランク、市場シェア、製品・サービス、最近の動向分析を含む)
- ACUITY BRANDS, INC.
- Anhui Shilin Lighting Co., Ltd.
- Guangdong PAK Corporation Co.,Ltd.
- Hengdian group tospo lighting co. ltd.
- NVC INTERNATIONAL HOLDINGS LIMITED
- OPPLE Lighting Co., Ltd
- Panasonic Holdings Corporation
- Signify(Philips)
- TCL Lighting(TCL Group)
- Zhejiang Yankon Group Co.,Ltd
第7章 CEOへの主な戦略的質問
第8章 付録
- 世界の概要
- 概要
- ファイブフォース分析フレームワーク
- 世界のバリューチェーン分析
- 市場力学(DROs)
- 情報源と参考文献
- 図表一覧
- 主要洞察
- データパック
- 用語集
目次
The China Indoor LED Lighting Market size is estimated at 4.49 billion USD in 2025, and is expected to reach 6.7 billion USD by 2030, growing at a CAGR of 8.33% during the forecast period (2025-2030).
Growing star-ups, rising manufacturing facilities, and increasing retail sales are expected to raise the demand for indoor lighting
- In 2023, industrial and warehouse (I&W) accounted for the majority of the share (79.6%), followed by commercial, agricultural, and residential. The market share is expected to have a minimal reduction in all applications and a gain in (I&W) in the coming years. Chinese industries faced several internal and external headwinds, such as weak domestic consumption, declining business confidence, and supply chain disruptions caused by the surge of COVID-19. Further, China sustained its industrial production in 2021. In 2021, China produced a total of USD 4865.8 billion, an increase of 26.04% compared to 2020. Thus, the growing industrial production will create demand for Indoor lighting in the coming years.
- The demand for automotive manufacturing plants and warehouses across China is rising, and this is due to the global auto market relying on China because of its cheap components, source of finished cars, and others. Such instances necessitate more requirements for Indoor LEDs during the study period. BMW opened a new factory in the city of Shenyang, and Audi started production at a new EV factory in the city of Changchun.
- China's retail sector continues to show signs of robust growth, with retail sales surging by 12.7% in May 2023 from a year earlier. The rapid increase in online shoppers is further expected to boost the need for new warehouses in the region, resulting in more demand for indoor lighting.
- China is one of the top players in creating billion-dollar start-ups. In 2022, China added 74 new unicorns, falling behind the United States. Around 70% of its new unicorns come from the healthcare and smart logistics sectors, which surges the demand for commercial spaces. The above instances are expected to drive the demand for Indoor LEDs in the coming year.
China Indoor LED Lighting Market Trends
The rising per capita income complements the growth of households
- The average household size in China registered 3.03 persons in 2017. By 2021, it reduced to 2.7, indicating an increase in private households/housing ownerships. After 1998, China went from being a nation dominated by public renters to one with the highest homeownership rates, owing to the privatization of existing public housing and the vast provision of private housing, primarily in the ownership sector. By 2020, more than 90% of households in China owned their homes (87% in urban areas and 96% in rural areas). In contrast to many affluent countries, more than 20% of Chinese households own several properties. Thus, the increase in the number of properties is expected to create more LED penetration for the need for illumination in the country.
- In China, disposable income is growing, resulting in the rising spending power of individuals who spend more money on new residential spaces. China's per capita income reached USD 12,732.5 in December 2022 compared to USD 12,615.7 in December 2021. India's per capita income was USD 2,301.4 as of Mar 2022, which is lower than China's.
- In China, the floor area of residential buildings per capita for rural areas was reported at 48.900 sq. m in 2019, an increase from the previous year of 47.300 sq. m. In urban areas, it was 38.600 sq. m in 2020, a decrease from 39.800 sq. m in 2019 due to an increase in the investment in small-size apartments/studio apartments. This is propelling the growth of LED lighting in the country. For instance, people in China invested in low-cost apartments in small Chinese cities. In 2012, households in China were offered a subsidy program of CNY 2.2 (USD 0.31) billion for the use of energy-conserving light bulbs and LEDs. Such instances are expected to increase the demand for LED lighting in the country.
China's energy conservation initiatives could propel the LED lighting market in the country
- In 2021, Chinese households used approximately 1,170 terawatt hours of electricity. At around 5,610 terawatt hours, the secondary sector, which includes the manufacturing industries, consumed the most energy. The residential and commercial sectors came in second and third. Market growth is negative as a result of the real estate market slump. Despite the decline in new construction, chances for significant growth exist in the renovation of the existing structures and the creation of green buildings, leading to the expansion of the LED market in China.
- During normal business hours, commercial electricity use is at its peak. It usually lasts between 10 and 12 hours every day. Electricity consumption in the industrial sector does not vary during the day or year; for example, manufacturing facilities operate 24 hours a day, 365 days a year. The residential sector often has peak electricity demand in the evenings, ranging from 5.5 to 7 hours.
- The 14th Five-Year Plan for the Development of Culture and Tourism in April 2021 encouraged the development of the night-time economy and the construction of national clusters for culture and tourism at night by installing 200 intelligent lamp post projects, driving the growth of the LED lighting market.
- By 2022, 70% of new urban buildings must be recognized as green buildings, according to the new standards. According to the Plan, all public facilities, structures larger than 20,000 sq. m, and other sizable public structures must adhere to China's Green Building Evaluation Label's 3-Star Green Building Standards. The development of LED lighting is being accelerated by China's emphasis on energy conservation.
China Indoor LED Lighting Industry Overview
The China Indoor LED Lighting Market is fragmented, with the top five companies occupying 28.16%. The major players in this market are ACUITY BRANDS, INC., Guangdong PAK Corporation Co.,Ltd., OPPLE Lighting Co., Ltd, Panasonic Holdings Corporation and Signify (Philips) (sorted alphabetically).
Additional Benefits:
- The market estimate (ME) sheet in Excel format
- 3 months of analyst support
TABLE OF CONTENTS
1 EXECUTIVE SUMMARY & KEY FINDINGS
2 REPORT OFFERS
3 INTRODUCTION
- 3.1 Study Assumptions & Market Definition
- 3.2 Scope of the Study
- 3.3 Research Methodology
4 KEY INDUSTRY TRENDS
- 4.1 Population
- 4.2 Per Capita Income
- 4.3 Total Import Of Leds
- 4.4 Lighting Electricity Consumption
- 4.5 # Of Households
- 4.6 Led Penetration
- 4.7 Horticulture Area
- 4.8 Regulatory Framework
- 4.8.1 China
- 4.9 Value Chain & Distribution Channel Analysis
5 MARKET SEGMENTATION (includes market size in Value in USD and Volume, Forecasts up to 2030 and analysis of growth prospects)
- 5.1 Indoor Lighting
- 5.1.1 Agricultural Lighting
- 5.1.2 Commercial
- 5.1.2.1 Office
- 5.1.2.2 Retail
- 5.1.2.3 Others
- 5.1.3 Industrial and Warehouse
- 5.1.4 Residential
6 COMPETITIVE LANDSCAPE
- 6.1 Key Strategic Moves
- 6.2 Market Share Analysis
- 6.3 Company Landscape
- 6.4 Company Profiles (includes Global level Overview, Market level overview, Core Business Segments, Financials, Headcount, Key Information, Market Rank, Market Share, Products and Services, and analysis of Recent Developments)
- 6.4.1 ACUITY BRANDS, INC.
- 6.4.2 Anhui Shilin Lighting Co., Ltd.
- 6.4.3 Guangdong PAK Corporation Co.,Ltd.
- 6.4.4 Hengdian group tospo lighting co. ltd.
- 6.4.5 NVC INTERNATIONAL HOLDINGS LIMITED
- 6.4.6 OPPLE Lighting Co., Ltd
- 6.4.7 Panasonic Holdings Corporation
- 6.4.8 Signify (Philips)
- 6.4.9 TCL Lighting (TCL Group)
- 6.4.10 Zhejiang Yankon Group Co.,Ltd
7 KEY STRATEGIC QUESTIONS FOR LED CEOS
8 APPENDIX
- 8.1 Global Overview
- 8.1.1 Overview
- 8.1.2 Porter's Five Forces Framework
- 8.1.3 Global Value Chain Analysis
- 8.1.4 Market Dynamics (DROs)
- 8.2 Sources & References
- 8.3 List of Tables & Figures
- 8.4 Primary Insights
- 8.5 Data Pack
- 8.6 Glossary of Terms
- 発行日
- 発行
- Mordor Intelligence
- ページ情報
- 英文 168 Pages
- 納期
- 2~3営業日