
アジア太平洋地域の屋内用LED照明:市場シェア分析、産業動向・統計、成長予測(2025年~2030年)
Asia Pacific Indoor LED Lighting - Market Share Analysis, Industry Trends & Statistics, Growth Forecasts (2025 - 2030)- 発行日
- ページ情報
- 英文 193 Pages
- 納期
- 2~3営業日
- 商品コード
- 1683931
- カスタマイズ可能 お客様のご希望に応じて、既存データの加工や未掲載情報(例:国別セグメント)の追加などの対応が可能です。詳細はお問い合わせください。
- 適宜更新あり 本レポートは最新情報反映のため適宜更新し、内容構成変更を行う場合があります。ご検討の際はお問い合わせください。
- 翻訳ツール提供対象 PDF対応AI翻訳ツールの無料貸し出しサービスのご利用が可能です
概要
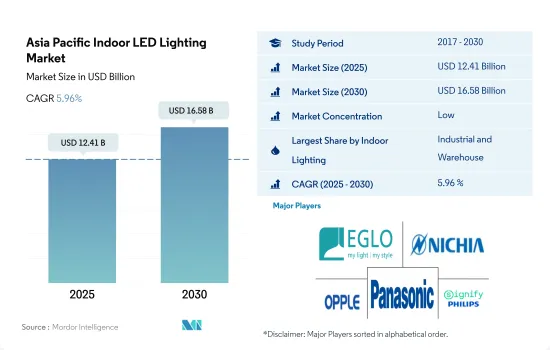
アジア太平洋の屋内用LED照明市場規模は、2025年に124億1,000万米ドルと推定され、2030年には165億8,000万米ドルに達すると予測され、予測期間中(2025-2030年)のCAGRは5.96%で成長します。
産業部門と住宅部門の開発増加が市場成長を牽引
- 金額シェアでは、2023年には工業と倉庫がシェアの大半を占める。中国は2022年現在、世界第2位の経済大国です。中国の倉庫スペースのコストは、COVID-19以前では1平方メートル当たり月平均44.3人民元(6.15米ドル)でした。中国では、倉庫の需要が着実に増加し、パンデミック後の賃貸コストが上昇しています。中国の倉庫業界の収益は、5年間で年率4.3%の増加が見込まれます。
- 同様にインドでは、製造業がパンデミック前にインドのGDPの16~17%を稼ぎ出しており、最も急成長するセクターのひとつになると予想されています。インドの工業・倉庫セクターでは、約1,100万平方フィートの堅調な吸収が報告されており、需要の77%をTier-I都市が牽引しています。このような要因により、LEDの普及需要の増加が期待されます。
- 数量シェアでは、2023年には住宅がシェアの大半を占める。過去30年間、アジアは高い都市化率を経験しました。急速な都市化は経済成長を促進する一助となったが、住宅に対する大きな需要を招き、住宅価格の高騰を招いた。日本では、人口減少に伴う政府の住宅政策の影響もあり、2023年には1,000万戸の供給過剰になる可能性が高いです。世帯数は2023年に5,419万世帯でピークを迎えます。このような要因は、主要なLED需要に対応するものです。
- 新しい住宅の導入には、政府の補助金が大きな役割を果たしています。インドでは、政府がいくつかの省エネプログラムを導入しています。例えば、中央政府の野心的なPMAY(Pradhan Mantri Awas Yojana)プログラムは、2022年までに全国で2,000万戸の手頃な価格の都営住宅を建設することを目指しています。このような要因が大きな売上につながり、今後一定期間、LED需要が増加する可能性があります。
工業生産数の増加と可処分所得が市場の需要を牽引
- 金額シェアと数量シェアでは、2023年の屋内用LED照明のシェアの大半を中国が占めています。金額シェアでは、2023年、中国では産業および倉庫(I&W)がシェアの大半を占めました。中国は2021年に工業生産を維持しました。2021年、中国の総生産額は4兆8,658億米ドルで、2020年と比較して26.04%増加しました。2022年の工業生産は3.6%増加しました。2023年3月の中国の工業生産は前年比3.9%増加しました。このように、パンデミック後の工業生産の増加は、今後数年間の室内照明の需要を生み出しています。
- さらに、同社は2021年のインベスター・デーにおいて、今後5年間で物流網を45から50の物流センターに拡大する意向であることを発表しました。2022年の同国の輸出総額は過去最高を記録し、2021年比7.7%増の42兆700億人民元(6兆3,000億米ドル)を占めました。一方、輸入は1.1%増加しました。物流センター需要の増加に伴い、LED需要も増加すると予想されます。
- インドは金額シェア、数量シェアともに2位につけています。数量シェアについては、2022年には住宅用照明が最大のシェアを占めています。2022年の全国の登録者を含めた平均世帯人数は4.4人であり、個人世帯や持ち家が増加しています。インドでは可処分所得が増加しています。インドの1人当たり所得は、2021年3月の1971.6米ドルに対し、2022年3月には2301.4米ドルに達しました。このことは、インドの人々の購買力がこれらの国々よりも低い可能性を示唆しています。その結果、より多くの住宅が購入され、LED照明の使用が増加すると思われます。
アジア太平洋の屋内用LED照明市場動向
人口増加、一人当たり所得増加、政府補助金がLED市場を牽引
- アジア太平洋には世界の人口の59.7%にあたる約47億人が住んでおり、中国やインドなど世界で最も人口の多い国々が含まれ、人口の46.3%は都市人口である(2019年には21億4,000万人)。この地域全体の出生率は女性1人当たり2.1人に近いです。家族の人数は、東アジアでは女性1人当たり1.7人まで減少しているが、南アジアでは女性1人当たり2.5人の高水準を維持しています。さらに、この地域では現在、5人に2人が都市部に住んでいます。数百万人が雇用やより良い機会を求めて田舎から町や都市に移り住むため、この比率は今後大幅に増加すると思われます。したがって、都市部の世帯数の増加により、この地域の照明ニーズに対するLEDの普及が進むと予想されます。
- この地域にはいくつかの新興諸国が含まれており、パンデミックにもかかわらず、可処分所得は途上国で伸びています。中国の一人当たり所得は、2021年12月の12,615.7米ドルに比べ、2022年12月には12,732.5米ドルに達しました。インドの一人当たり所得は、2021年3月の1971.6米ドルに対し、2022年3月には2301.4米ドルに達しました。日本の一人当たり所得は、2021年12月の39,916.1米ドルに対し、2022年12月には33,911.2米ドルに達しました。その結果、個人の消費力が高まり、新しい住居スペースにより多くの資金が投入されることになります。家庭向けには、2012年に中国政府が省エネ電球やLEDの使用に22億人民元の補助金を提供しました。日本政府は2010年4月、エコポイント制度を導入しました。利用者はエコポイントを利用して、2対1のエコポイント比率でLEDランプを購入することができ、LED照明の需要がさらに高まると予想されます。
インフラ開発への取り組みとエネルギー効率の高い照明の普及がLED照明の成長を牽引
- アジア太平洋地域では、2021年には産業部門が最大のエネルギー消費量となり、次いで住宅部門と商業部門が続く予定です。さらに、アジア太平洋は現在進行中および将来のインフラ構想、特にスマートシティプロジェクトで知られており、ビル運営の需要を生み出す可能性があります。産業・商業部門も急速に拡大しています。東京とインドは2022年に世界のインフラ開発プロジェクトで協力する予定です。ネパールのように両国がすでにプロジェクトに取り組んでいる国では、インフラ・プロジェクトの計画、設計、実施を共同で行うことで、ニューデリーと東京が最大限の効果を発揮できるかもしれないです。こうした開発の結果、この地域のLED需要は増加すると予想されます。
- 商業部門の電力需要は11~13時間程度になる傾向があります。産業部門の電力使用量は、1日や1年を通して変動しない傾向があります。住宅部門の電力需要は、照明が点灯する夕方に最も高くなる傾向があり、平均点灯時間は約6~8時間変動します。さらに、コーチン・スマート・ミッション社(CSML)は、2022年にインドの高知にLED照明を設置し、車両と歩行者の安全を保証する40カロールインドルピーのプロジェクトを準備しています。これらのプログラムは、LED分野の拡大に拍車をかけています。
- アジア太平洋の国々は、LEDの使用による省エネを促進しています。例えば、オーストラリア政府は2018年1月、照明のエネルギー効率規制をさらに改善する方法として、EUの要件に準拠したLED電球の最低基準をオーストラリアとニュージーランドで導入し、非効率なハロゲンランプを段階的に廃止することを決定しました。この取り組みは、国の電力使用量を削減し、LED照明の使用を促進します。
アジア太平洋地域の屋内用LED照明産業概要
アジア太平洋地域の屋内用LED照明市場は細分化されており、主要企業5社で26.26%を占めています。この市場の主要企業は以下の通りです。EGLO Leuchten GmbH, Nichia Corporation, OPPLE Lighting, Panasonic Holdings Corporation and Signify(Philips)(sorted alphabetically).
その他の特典
- エクセル形式の市場予測(ME)シート
- 3ヶ月間のアナリストサポート
目次
第1章 エグゼクティブサマリーと主な調査結果
第2章 レポートのオファー
第3章 イントロダクション
- 調査の前提条件と市場定義
- 調査範囲
- 調査手法
第4章 主要産業動向
- 人口
- 一人当たり所得
- LEDの総輸入量
- 照明の電力消費量
- 世帯数
- LED普及率
- 園芸面積
- 規制の枠組み
- 中国
- インド
- 日本
- バリューチェーンと流通チャネル分析
第5章 市場セグメンテーション
- 屋内照明
- 農業用照明
- 商業照明
- オフィス
- 小売
- その他
- 産業・倉庫
- 住宅
- 国
- 中国
- インド
- 日本
- その他アジア太平洋地域
第6章 競争情勢
- 主要な戦略動向
- 市場シェア分析
- 企業情勢
- 企業プロファイル(世界レベルの概要、市場レベルの概要、主要な事業セグメント、財務、従業員数、主要情報、市場ランク、市場シェア、製品・サービス、最近の動向分析を含む)
- ACUITY BRANDS, INC.
- ams-OSRAM AG
- EGLO Leuchten GmbH
- Endo Lighting Corporation
- Guangdong PAK Corporation Co.,Ltd.
- Nichia Corporation
- OPPLE Lighting Co., Ltd
- Panasonic Holdings Corporation
- Signify(Philips)
- Toshiba Corporation
第7章 CEOへの主な戦略的質問
第8章 付録
- 世界の概要
- 概要
- ファイブフォース分析フレームワーク
- 世界のバリューチェーン分析
- 市場力学(DROs)
- 情報源と参考文献
- 図表一覧
- 主要洞察
- データパック
- 用語集
目次
The Asia Pacific Indoor LED Lighting Market size is estimated at 12.41 billion USD in 2025, and is expected to reach 16.58 billion USD by 2030, growing at a CAGR of 5.96% during the forecast period (2025-2030).
Increasing development in the industrial sector and residential sector drives the market growth
- In terms of value share, in 2023, industrial and warehouse accounts for most of the share. China is the second-largest economy in the world as of 2022. Warehouse space in China cost an average of CNY 44.3 (USD 6.15) per square meter per month during pre-COVID-19. In China, there has been a steady rise in the demand for warehouses, raising the cost of renting them post-pandemic. Revenue for the storage industry in China is expected to increase at an annualized 4.3% over the five years.
- Similarly, in India, manufacturing generated 16-17% of India's GDP before the pandemic and is expected to be one of the fastest-growing sectors. India's industrial and warehousing sector reported a nearly 11 million square feet robust absorption, with tier-I cities driving 77% of the demand. Such factors are expected to increase the LED penetration demand.
- In terms of volume share, in 2023, residential accounts for most of the share. Over the past three decades, Asia experienced a high urbanization rate. While rapid urbanization helped to fuel economic growth, it has led to major demand for housing, resulting in high housing prices. Japan will likely see an excess supply of 10 million dwelling units in 2023, partly due to government housing policy with a shrinking population. The number of households will peak at 54.19 million in 2023. Such a factor caters to a major LED demand.
- Government subsidy plays a major role in the adoption of new housing. In India, the government has introduced several energy-saving programs. For example, the central government's ambitious Pradhan Mantri Awas Yojana (PMAY) program aims to build 20 million affordable metropolitan housing units nationwide by 2022. Such factors might lead to major sales, leading to more LED demand in the coming period.
Growing number of industrial production and disposable income drive the demand for market
- In terms of value and volume share, China stood with the majority of the share in indoor LED lighting in 2023. In terms of value share, in 2023, industrial and warehouse (I&W) accounted for the majority of the share in China. China sustained its industrial production in 2021. In 2021, China produced a total of USD 4865.8 billion, an increase of 26.04% compared to 2020. In 2022, industrial production grew by 3.6%. China's industrial production increased by 3.9% year-on-year in March 2023. Thus, the growing industrial production post-pandemic is creating demand for indoor lighting in the coming years.
- In addition, during its Investor Day in 2021, the company announced that it intends to expand its logistics network over the following five years to 45 to 50 distribution centers. The country's total exports hit an all-time high in 2022, accounting for CNY 42.07 trillion (USD 6.3 trillion), up 7.7% from 2021. On the other hand, imports increased by 1.1%. With the increasing demand for distribution centers, the LED demand is expected to rise.
- India stands at the second spot in terms of value and volume share. Regarding volume share, residential lighting had the largest share in 2022. In 2022, the average household size, including all registrants nationwide, was 4.4, leading to an increase in private households and homeowners. In India, disposable income is increasing. India's per capita income reached USD 2301.4 in March 2022, compared to USD 1971.6 in March 2021. This suggests that people in India may have lower purchasing power than those countries. As a result, more homes will be purchased and the use of LED lighting will increase.
Asia Pacific Indoor LED Lighting Market Trends
The LED market is driven by increasing population, rising per capita income, and government subsidies
- Asia-Pacific is home to 59.7% of the world's population, which is around 4.7 billion people, and includes the world's most populous countries, such as China and India, and 46.3 % of the population is urban (2.14 billion people in 2019). The region's overall fertility rate is close to 2.1 births per woman. Family size has decreased to 1.7 children per woman in East Asia while maintaining a high of 2.5 children per woman in South Asia. Further, two out of every five people in the region currently live in urban areas. This ratio will increase significantly in the coming as millions move from the countryside to towns and cities in search of employment and better opportunities. Thus, the increase in the number of households in urban areas is expected to create more LED penetration for the need for illumination in the region.
- This region includes several developing nations, and despite the pandemic, disposable income is growing in developing countries. China's per capita income reached USD 12,732.5 in December 2022, compared to USD 12,615.7 in December 2021. India's per capita income reached USD 2301.4 in March 2022, compared to USD 1971.6 in March 2021. Japan's per capita income reached USD 33,911.2 in December 2022, compared to USD 39,916.1 in December 2021. Such instances result in the rising spending power of individuals and affording more money for new residential spaces. For households, in 2012, the Chinese government offered a subsidy of CNY 2.2 billion for the use of energy-conserving light bulbs and LEDs. The Japanese government introduced a consumer rebate program known as the "Eco-Point" program in April 2010. Users may use their Eco-Points to purchase LED lamps at a 2 to 1 Eco-point ratio, which is further expected to surge the demand for LED lighting.
Initiatives related to infrastructure development and increasing use of energy-efficient lighting to drive the growth of LED lights
- The industrial sector in the Asia-Pacific had planned to have the biggest energy consumption in 2021, followed by the residential and commercial sectors. Additionally, Asia-Pacific is known for its ongoing and future infrastructure initiatives, notably smart city projects, which could generate demand for building operations. The industrial and commercial sector is also expanding quickly. Tokyo and India will collaborate on global infrastructure development projects in 2022. In countries like Nepal, where both countries are already working on projects, joint planning, design, and implementation of infrastructure projects might help New Delhi and Tokyo maximize their impact. The demand for LED in the area is anticipated to rise as a result of these developments.
- Electricity demand in the commercial sector tends to be around 11-13 hours. Electricity use in the industrial sector tends not to fluctuate through the day or year. Electricity demand in the residential sector tends to be highest in the evenings, when lights are turned on, and the average lighting time varies for about 6 to 8 hours. Additionally, Cochin Smart Mission Limited (CSML) is preparing an INR 40 crore project to install LED lighting in Kochi, India, to guarantee the security of vehicles and pedestrians in 2022. These programs fuel the expansion of the LED sector.
- Countries in Asia-Pacific have expedited energy savings through the use of LEDs. For instance, the Australian Government decided in January 2018 to introduce minimum LED bulb standards in Australia and New Zealand that comply with EU requirements and phase out inefficient halogen lamps as a way to improve lighting energy efficiency regulation further. The effort will reduce the nation's electricity use and encourage the usage of LED lighting.
Asia Pacific Indoor LED Lighting Industry Overview
The Asia Pacific Indoor LED Lighting Market is fragmented, with the top five companies occupying 26.26%. The major players in this market are EGLO Leuchten GmbH, Nichia Corporation, OPPLE Lighting Co., Ltd, Panasonic Holdings Corporation and Signify (Philips) (sorted alphabetically).
Additional Benefits:
- The market estimate (ME) sheet in Excel format
- 3 months of analyst support
TABLE OF CONTENTS
1 EXECUTIVE SUMMARY & KEY FINDINGS
2 REPORT OFFERS
3 INTRODUCTION
- 3.1 Study Assumptions & Market Definition
- 3.2 Scope of the Study
- 3.3 Research Methodology
4 KEY INDUSTRY TRENDS
- 4.1 Population
- 4.2 Per Capita Income
- 4.3 Total Import Of Leds
- 4.4 Lighting Electricity Consumption
- 4.5 # Of Households
- 4.6 Led Penetration
- 4.7 Horticulture Area
- 4.8 Regulatory Framework
- 4.8.1 China
- 4.8.2 India
- 4.8.3 Japan
- 4.9 Value Chain & Distribution Channel Analysis
5 MARKET SEGMENTATION (includes market size in Value in USD and Volume, Forecasts up to 2030 and analysis of growth prospects)
- 5.1 Indoor Lighting
- 5.1.1 Agricultural Lighting
- 5.1.2 Commercial
- 5.1.2.1 Office
- 5.1.2.2 Retail
- 5.1.2.3 Others
- 5.1.3 Industrial and Warehouse
- 5.1.4 Residential
- 5.2 Country
- 5.2.1 China
- 5.2.2 India
- 5.2.3 Japan
- 5.2.4 Rest of Asia-Pacific
6 COMPETITIVE LANDSCAPE
- 6.1 Key Strategic Moves
- 6.2 Market Share Analysis
- 6.3 Company Landscape
- 6.4 Company Profiles (includes Global level Overview, Market level overview, Core Business Segments, Financials, Headcount, Key Information, Market Rank, Market Share, Products and Services, and analysis of Recent Developments)
- 6.4.1 ACUITY BRANDS, INC.
- 6.4.2 ams-OSRAM AG
- 6.4.3 EGLO Leuchten GmbH
- 6.4.4 Endo Lighting Corporation
- 6.4.5 Guangdong PAK Corporation Co.,Ltd.
- 6.4.6 Nichia Corporation
- 6.4.7 OPPLE Lighting Co., Ltd
- 6.4.8 Panasonic Holdings Corporation
- 6.4.9 Signify (Philips)
- 6.4.10 Toshiba Corporation
7 KEY STRATEGIC QUESTIONS FOR LED CEOS
8 APPENDIX
- 8.1 Global Overview
- 8.1.1 Overview
- 8.1.2 Porter's Five Forces Framework
- 8.1.3 Global Value Chain Analysis
- 8.1.4 Market Dynamics (DROs)
- 8.2 Sources & References
- 8.3 List of Tables & Figures
- 8.4 Primary Insights
- 8.5 Data Pack
- 8.6 Glossary of Terms
- 発行日
- 発行
- Mordor Intelligence
- ページ情報
- 英文 193 Pages
- 納期
- 2~3営業日

