
|
市場調査レポート
商品コード
1692162
アジア太平洋のLED照明:市場シェア分析、産業動向、成長予測(2025年~2030年)Asia Pacific LED Lighting - Market Share Analysis, Industry Trends & Statistics, Growth Forecasts (2025 - 2030) |
||||||
カスタマイズ可能
適宜更新あり
|
|||||||
| アジア太平洋のLED照明:市場シェア分析、産業動向、成長予測(2025年~2030年) |
|
出版日: 2025年03月18日
発行: Mordor Intelligence
ページ情報: 英文 280 Pages
納期: 2~3営業日
|

全表示
- 概要
- 目次
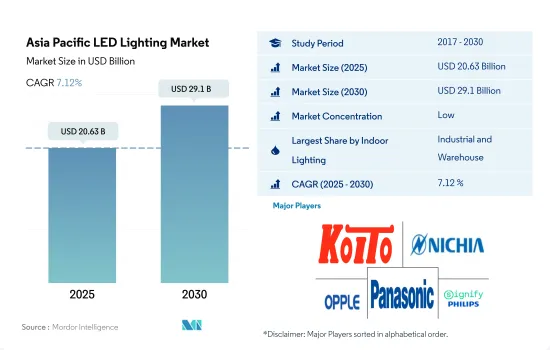
アジア太平洋のLED照明市場規模は、2025年に206億3,000万米ドルと推定され、2030年には291億米ドルに達すると予測され、予測期間中(2025年~2030年)のCAGRは7.12%で成長します。
産業部門と住宅部門の開発増加が市場成長を牽引
- 金額シェアでは、2023年には産業と倉庫がシェアの大半を占める。中国は2022年現在、世界第2位の経済大国です。中国の倉庫スペースのコストは、COVID-19以前では1平方メートル当たり月平均44.3人民元(6.15米ドル)でした。中国では、倉庫の需要が着実に増加し、パンデミック後の賃貸コストが上昇しています。中国の倉庫業界の収益は、5年間で年率4.3%の増加が見込まれます。
- 同様にインドでは、製造業がパンデミック前にインドのGDPの16~17%を稼ぎ出しており、最も急成長するセクターのひとつになると予想されています。インドの工業・倉庫セクターでは、約1,100万平方フィートの堅調な吸収が報告されており、需要の77%をティアI都市が牽引しています。このような要因により、LEDの普及需要が増加すると予想されます。
- 数量シェアでは、2023年には住宅がシェアの大半を占める。過去30年間、アジアは高い都市化率を経験しました。急速な都市化は経済成長を促進する一助となったが、住宅に対する大きな需要を招き、住宅価格の高騰を招いた。日本では、人口減少に伴う政府の住宅政策の影響もあり、2023年には1,000万戸の供給過剰になる可能性が高いです。世帯数は2023年に5,419万世帯でピークを迎えます。このような要因は、主要なLED需要に対応するものです。
- 新しい住宅の導入には、政府の補助金が大きな役割を果たしています。インドでは、政府がいくつかの省エネプログラムを導入しています。例えば、中央政府の野心的なPMAY(Pradhan Mantri Awas Yojana)プログラムは、2022年までに全国で2,000万戸の手頃な価格の都営住宅を建設することを目指しています。このような要因により、大規模な販売が行われ、今後LED需要が増加する可能性があります。
各国の不動産インフラ開発と自動車分野の旺盛な需要が市場需要を拡大
- 2023年の金額と数量シェアでは、中国が最も多く、インドが2位です。中国は持ち家大国で、90%以上の世帯が家を所有しています。同時に、中国の世帯の20%以上が複数の住宅を所有しており、多くの先進国よりも高いです。このような統計は、LED照明の需要を促進するかもしれないです。
- 中国の自動車総生産は、2021年には10兆人民元(1兆4,000億米ドル)以上となり、中国のGDPのほぼ10%に貢献しました。自動車市場の力強い成長は、政策的インセンティブ、資本支援、消費者需要の増加に起因しています。2022年5月、中国は農村部での新エネルギー車(NEV)販売を促進する政策を発表しました。
- インド企業は2022年にインフラと不動産投資信託を通じて3兆5,000億インドルピー以上の資金を調達すると予想されました。上位8都市のオフィス市場は、2020年7月から2020年12月までに22.2msfの取引を記録しました。現在、インドでは1兆3,000億米ドルに相当する大規模なインフラ・産業プロジェクトが進められています。このような開発がLED照明の需要を促進しています。
- インドの自動車産業はインドのGDPに6.4%近く貢献しています。2019年現在、マハラシュトラ州、グジャラート州、デリー州、カルナータカ州など一人当たり所得の高い州の自動車販売台数は、業界平均よりも急速に縮小しています。タクシーアグリゲーターと乗用車所有者の飽和状態の高まりが、自動車販売の成長に打撃を与えています。2019年10月時点で、LEDはテールランプで40%以上の普及率を獲得したが、ヘッドランプでは15%未満のシェアにとどまりました。自動車販売台数の増加に伴い、テールランプとヘッドランプLEDのシェアは大幅に増加すると予想されます。
アジア太平洋のLED照明市場動向
住宅建設・販売の増加がLED市場の成長を牽引
- アジア太平洋は世界人口の60%を擁する地域です。この地域の数多くの国、特に中国は人口増加率トップ10に入っています。中国の低社会経済層では、2019年現在、住民の60%以上が持ち家です。大都市の市民と比較すると、所有率はかなり高いです。低層の市や町では、持ち家の41%が住宅ローンを組んでいませんでした。LEDの使用が増えたのは、中国における住宅購入の増加が影響しているのかもしれないです。さらに、インドでは、企業が推進するキャンペーンによって、LED技術を迅速かつ広範囲に導入することが可能であることを示しています。
- 他の国々の建設業界は、原住民と移民の人口がともに急速に増加するにつれて繁栄しています。例えば、インドネシアでは2017年に5%、2019年に1%住宅建築量が増加しており、この動向は各国の人口増加により予測期間を通じて続くと思われます。その結果、アジア太平洋の建築セクターの急拡大は、地域市場のLED需要を増加させる。
- 2021年時点でアジア太平洋で最も世帯数が多いのは中国で、総世帯数は4億4,970万を超えます。さらに、インド、インドネシア、日本ではそれぞれ2億9,510万世帯、6,890万世帯、4,850万世帯となっています。これらの国の世帯数は着実に増加しており、アジア太平洋地域でより多くの住宅が建設され、LEDの需要が高まっていることを示唆しています。2022年にアジア太平洋で販売された乗用車3,750万台のうち、2,360万台以上が中国でした。比較的、アジア太平洋では2021年に約3,457万台の乗用車が販売されました。この地域のLED需要は、アジア太平洋の自動車販売台数の増加が後押しします。
LED市場を牽引するのは人口増加、一人当たり所得増加、政府補助金
- アジア太平洋は世界人口の59.7%、約47億人を擁し、中国やインドなど世界で最も人口の多い国を含み、人口の46.3%が都市人口である(2019年は21億4,000万人)。この地域全体の出生率は女性1人当たり2.1人に近いです。家族の人数は、東アジアでは女性1人当たり1.7人まで減少しているが、南アジアでは女性1人当たり2.5人の高水準を維持しています。さらに、この地域では現在、5人に2人が都市部に住んでいます。数百万人が雇用とより良い機会を求めて田舎から町や都市に移り住むため、この比率は今後数年で大幅に増加すると思われます。したがって、都市部の世帯数の増加により、この地域の照明ニーズに対するLEDの普及が進むと予想されます。
- この地域にはいくつかの新興諸国が含まれており、パンデミックにもかかわらず、可処分所得は途上国で伸びています。中国の一人当たり所得は、2021年12月のUSD 12,615.7に比べ、2022年12月にはUSD 12,732.5に達しました。インドの一人当たり所得は、2021年3月の1971.6米ドルに対し、2022年3月には2301.4米ドルに達しました。日本の一人当たり所得は、2021年12月の39,916.1米ドルに対し、2022年12月には33,911.2米ドルに達しました。その結果、個人の消費力が高まり、新しい住居スペースにより多くの資金が投入されることになります。家庭向けには、2012年に中国政府がLED使用に対して22億人民元(3億1,000万米ドル)の補助金を提供しました。日本政府は2010年4月、「エコポイント」として知られる消費者向けリベート制度を導入しました。ユーザーはエコポイントを使って、エコポイント2対1の割合でLEDランプを購入することができ、LED照明の需要をさらに急増させることが期待されています。
アジア太平洋のLED照明産業概要
アジア太平洋のLED照明市場は断片化されており、主要企業5社で26.83%を占めています。同市場の主要企業は以下の通り。 KOITO MANUFACTURING, Nichia Corporation, OPPLE Lighting, Panasonic Holdings Corporation and Signify Holding(Philips)(sorted alphabetically).
その他の特典
- エクセル形式の市場予測(ME)シート
- 3ヶ月のアナリストサポート
目次
第1章 エグゼクティブサマリーと主な調査結果
第2章 レポートのオファー
第3章 イントロダクション
- 調査の前提条件と市場定義
- 調査範囲
- 調査手法
第4章 主要産業動向
- 自動車生産台数
- 人口
- 一人当たり所得
- 自動車ローン金利
- 充電ステーション数
- 自動車走行台数
- LED総輸入量
- 照明消費電力
- #世帯数
- 道路網
- LED普及率
- #スタジアム数
- 園芸面積
- 規制の枠組み
- 屋内照明
- 中国
- インド
- 日本
- 屋外照明
- 中国
- インド
- 日本
- 自動車用照明
- 中国
- インド
- 日本
- 韓国
- 屋内照明
- バリューチェーンと流通チャネル分析
第5章 市場セグメンテーション
- 屋内照明
- 農業用照明
- 商業照明
- オフィス
- 小売
- その他
- 産業・倉庫
- 住宅照明
- 屋外照明
- 公共施設
- 道路
- その他
- 自動車用ユーティリティ照明
- デイタイム・ランニング・ライト(DRL)
- 方向指示器
- ヘッドライト
- リバースライト
- ストップライト
- テールライト
- その他
- 自動車用照明
- 2輪車
- 商用車
- 乗用車
- 国名
- 中国
- インド
- 日本
- その他のアジア太平洋
第6章 競争情勢
- 主要な戦略動向
- 市場シェア分析
- 企業情勢
- 企業プロファイル
- EGLO Leuchten GmbH
- GRUPO ANTOLIN IRAUSA, S.A.
- KOITO MANUFACTURING CO., LTD.
- Marelli Holdings Co., Ltd.
- Nichia Corporation
- OPPLE Lighting Co., Ltd
- OSRAM GmbH.
- Panasonic Holdings Corporation
- Signify Holding(Philips)
- Stanley Electric Co., Ltd.
第7章 CEOへの主な戦略的質問
第8章 付録
- 世界概要
- 概要
- ファイブフォース分析フレームワーク
- 世界のバリューチェーン分析
- 市場力学(DROs)
- 情報源と参考文献
- 図表一覧
- 主要洞察
- データパック
- 用語集
The Asia Pacific LED Lighting Market size is estimated at 20.63 billion USD in 2025, and is expected to reach 29.1 billion USD by 2030, growing at a CAGR of 7.12% during the forecast period (2025-2030).
Increasing development in the industrial sector and residential sector drives the market growth
- In terms of value share, in 2023, industrial and warehouse accounts for most of the share. China is the second-largest economy in the world as of 2022. Warehouse space in China cost an average of CNY 44.3 (USD 6.15) per square meter per month during pre-COVID-19. In China, there has been a steady rise in the demand for warehouses, raising the cost of renting them post-pandemic. Revenue for the storage industry in China is expected to increase at an annualized 4.3% over the five years.
- Similarly, in India, manufacturing generated 16-17% of India's GDP before the pandemic and is expected to be one of the fastest-growing sectors. India's industrial and warehousing sector reported a nearly 11 million square feet robust absorption, with tier-I cities driving 77% of the demand. Such factors are expected to increase the LED penetration demand.
- In terms of volume share, in 2023, residential accounts for most of the share. Over the past three decades, Asia experienced a high urbanization rate. While rapid urbanization helped to fuel economic growth, it has led to major demand for housing, resulting in high housing prices. Japan will likely see an excess supply of 10 million dwelling units in 2023, partly due to government housing policy with a shrinking population. The number of households will peak at 54.19 million in 2023. Such a factor caters to a major LED demand.
- Government subsidy plays a major role in the adoption of new housing. In India, the government has introduced several energy-saving programs. For example, the central government's ambitious Pradhan Mantri Awas Yojana (PMAY) program aims to build 20 million affordable metropolitan housing units nationwide by 2022. Such factors might lead to major sales, leading to more LED demand in the coming period.
Increase in development in real estate infrastructure and strong demand in automotive sector in various countries increase the market demand
- In terms of value and volume share, in 2023, China comprised most of the share, and India stood second. China is a country of homeowners, with more than 90% of households owning homes. At the same time, more than 20% of Chinese households own multiple homes, higher than many developed nations. Such stats may propel the demand for LED lighting.
- China's automobile gross output was more than CNY 10 trillion (USD 1.4 trillion) in 2021, contributing to almost 10% of China's GDP. The strong growth of the automotive market can be attributed to policy incentives, capital support, and increasing consumer demand. In May 2022, China released a policy to boost new energy vehicle (NEV) sales in rural parts.
- Indian firms were expected to raise more than INR 3.5 trillion through infrastructure and real estate investment trusts in 2022. The office market in the top eight cities recorded transactions of 22.2 msf from July 2020 to December 2020. In 2022, office absorption in the top seven cities stood at 38.25 million sq. ft. Currently, India is undertaking major infrastructure and industrial projects worth USD 1.3 trillion. Such development fuels the demand for LED lighting.
- The Indian automobile industry contributes almost 6.4% to India's GDP. As of 2019, vehicle sales in higher per capita income states such as Maharashtra, Gujarat, Delhi, and Karnataka were shrinking faster than the industry average. Taxi aggregators and rising saturation among passenger car owners have hit vehicle sales growth. As of October 2019, LEDs gained more than 40% penetration in tail lamps, but they accounted for less than 15% of the share in headlamps. With increasing vehicle sales, the shares of tail lamps and headlamp LEDs are expected to increase significantly.
Asia Pacific LED Lighting Market Trends
Increase in construction and sales of residential houses to drive the growth of the LED market
- Asia-Pacific is home to 60% of the world's population. Numerous nations in the region, notably China, are in the top ten in terms of population growth. In China's lower socioeconomic strata, as of 2019, more than 60% of residents were homeowners. In comparison to citizens of big cities, the ownership rate was substantially greater. In lower-tier cities and towns, 41% of homeowners did not have a mortgage on their home. The increased use of LEDs may be influenced by the rise in home purchases in China. Moreover, India has shown that it is possible to install LED technology quickly and extensively via campaigns promoted by the companies.
- The other nations' construction industries are prospering as their native and immigrant populations both grow quickly. For instance, the volume of residential buildings climbed by 5% in Indonesia in 2017 and by 1% in 2019, and this trend will continue throughout the forecast period due to the countries' growing populations. As a result, the rapidly expanding building sector in Asia-Pacific will increase the demand for LEDs in the regional market.
- China had the most households in Asia-Pacific as of 2021, with a total of over 449.7 million. In addition, there are 295.1 million, 68.9 million, and 48.5 million households in India, Indonesia, and Japan, respectively. There is a steady rise in the number of households in these nations, which suggests that more homes are being built and that the demand for LEDs in the Asia-Pacific is rising. Over 23.6 million of the 37.5 million passenger cars sold in 2022 in Asia-Pacific were in China. Comparatively, Asia-Pacific sold about 34.57 million passenger cars in 2021. The demand for LEDs in the region will be aided by the rise in automotive vehicle sales in Asia-Pacific.
The LED market is driven by increasing population, rising per capita income, and government subsidies
- Asia-Pacific is home to 59.7% of the world's population, which is around 4.7 billion people, and includes the world's most populous countries, such as China and India, and 46.3 % of the population is urban (2.14 billion people in 2019). The region's overall fertility rate is close to 2.1 births per woman. Family size has decreased to 1.7 children per woman in East Asia while maintaining a high of 2.5 children per woman in South Asia. Further, two out of every five people in the region currently live in urban areas. This ratio will increase significantly in the coming years as millions move from the countryside to towns and cities in search of employment and better opportunities. Thus, the increase in the number of households in urban areas is expected to create more LED penetration for need for illumination in region.
- This region includes several developing nations, and despite pandemic, disposable income is growing in developing countries. China's per capita income reached USD 12,732.5 in December 2022, compared to USD 12,615.7 in December 2021. India's per capita income reached USD 2301.4 in March 2022, compared to USD 1971.6 in March 2021. Japan's per capita income reached USD 33,911.2 in December 2022, compared to USD 39,916.1 in December 2021. Such instances result in the rising spending power of individuals and affording more money for new residential spaces. For households, in 2012, the Chinese government offered a subsidy of CNY 2.2 billion (USD 0.31 billion) for the use LEDs. The Japanese government introduced a consumer rebate program known as the "Eco-Point" program in April 2010. Users may use their Eco-Points to purchase LED lamps at a 2 to 1 Eco-point ratio, which is further expected to surge the demand for LED lighting.
Asia Pacific LED Lighting Industry Overview
The Asia Pacific LED Lighting Market is fragmented, with the top five companies occupying 26.83%. The major players in this market are KOITO MANUFACTURING CO., LTD., Nichia Corporation, OPPLE Lighting Co., Ltd, Panasonic Holdings Corporation and Signify Holding (Philips) (sorted alphabetically).
Additional Benefits:
- The market estimate (ME) sheet in Excel format
- 3 months of analyst support
TABLE OF CONTENTS
1 EXECUTIVE SUMMARY & KEY FINDINGS
2 REPORT OFFERS
3 INTRODUCTION
- 3.1 Study Assumptions & Market Definition
- 3.2 Scope of the Study
- 3.3 Research Methodology
4 KEY INDUSTRY TRENDS
- 4.1 Automotive Production
- 4.2 Population
- 4.3 Per Capita Income
- 4.4 Interest Rate For Auto Loans
- 4.5 Number Of Charging Stations
- 4.6 Number Of Automobile On-road
- 4.7 Total Import Of Leds
- 4.8 Lighting Electricity Consumption
- 4.9 # Of Households
- 4.10 Road Networks
- 4.11 Led Penetration
- 4.12 # Of Stadiums
- 4.13 Horticulture Area
- 4.14 Regulatory Framework
- 4.14.1 Indoor Lighting
- 4.14.1.1 China
- 4.14.1.2 India
- 4.14.1.3 Japan
- 4.14.2 Outdoor Lighting
- 4.14.2.1 China
- 4.14.2.2 India
- 4.14.2.3 Japan
- 4.14.3 Automotive Lighting
- 4.14.3.1 China
- 4.14.3.2 India
- 4.14.3.3 Japan
- 4.14.3.4 South Korea
- 4.14.1 Indoor Lighting
- 4.15 Value Chain & Distribution Channel Analysis
5 MARKET SEGMENTATION (includes market size in Value in USD and Volume, Forecasts up to 2030 and analysis of growth prospects)
- 5.1 Indoor Lighting
- 5.1.1 Agricultural Lighting
- 5.1.2 Commercial
- 5.1.2.1 Office
- 5.1.2.2 Retail
- 5.1.2.3 Others
- 5.1.3 Industrial and Warehouse
- 5.1.4 Residential
- 5.2 Outdoor Lighting
- 5.2.1 Public Places
- 5.2.2 Streets and Roadways
- 5.2.3 Others
- 5.3 Automotive Utility Lighting
- 5.3.1 Daytime Running Lights (DRL)
- 5.3.2 Directional Signal Lights
- 5.3.3 Headlights
- 5.3.4 Reverse Light
- 5.3.5 Stop Light
- 5.3.6 Tail Light
- 5.3.7 Others
- 5.4 Automotive Vehicle Lighting
- 5.4.1 2 Wheelers
- 5.4.2 Commercial Vehicles
- 5.4.3 Passenger Cars
- 5.5 Country
- 5.5.1 China
- 5.5.2 India
- 5.5.3 Japan
- 5.5.4 Rest of Asia-Pacific
6 COMPETITIVE LANDSCAPE
- 6.1 Key Strategic Moves
- 6.2 Market Share Analysis
- 6.3 Company Landscape
- 6.4 Company Profiles (includes Global level Overview, Market level overview, Core Business Segments, Financials, Headcount, Key Information, Market Rank, Market Share, Products and Services, and analysis of Recent Developments)
- 6.4.1 EGLO Leuchten GmbH
- 6.4.2 GRUPO ANTOLIN IRAUSA, S.A.
- 6.4.3 KOITO MANUFACTURING CO., LTD.
- 6.4.4 Marelli Holdings Co., Ltd.
- 6.4.5 Nichia Corporation
- 6.4.6 OPPLE Lighting Co., Ltd
- 6.4.7 OSRAM GmbH.
- 6.4.8 Panasonic Holdings Corporation
- 6.4.9 Signify Holding (Philips)
- 6.4.10 Stanley Electric Co., Ltd.
7 KEY STRATEGIC QUESTIONS FOR LED CEOS
8 APPENDIX
- 8.1 Global Overview
- 8.1.1 Overview
- 8.1.2 Porter's Five Forces Framework
- 8.1.3 Global Value Chain Analysis
- 8.1.4 Market Dynamics (DROs)
- 8.2 Sources & References
- 8.3 List of Tables & Figures
- 8.4 Primary Insights
- 8.5 Data Pack
- 8.6 Glossary of Terms
