
米国の植物性たんぱく質:市場シェア分析、産業動向・統計、成長予測(2025年~2030年)
United States Plant Protein - Market Share Analysis, Industry Trends & Statistics, Growth Forecasts (2025 - 2030)- 発行日
- ページ情報
- 英文 260 Pages
- 納期
- 2~3営業日
- 商品コード
- 1683495
- カスタマイズ可能 お客様のご希望に応じて、既存データの加工や未掲載情報(例:国別セグメント)の追加などの対応が可能です。詳細はお問い合わせください。
- 適宜更新あり 本レポートは最新情報反映のため適宜更新し、内容構成変更を行う場合があります。ご検討の際はお問い合わせください。
- 翻訳ツール提供対象 PDF対応AI翻訳ツールの無料貸し出しサービスのご利用が可能です
概要
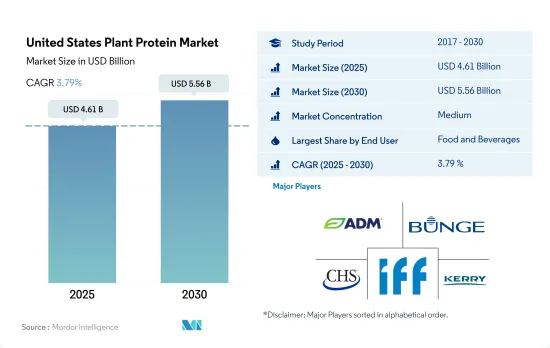
米国の植物性たんぱく質市場規模は2025年に46億1,000万米ドルと推定・予測され、2030年には55億6,000万米ドルに達し、予測期間(2025-2030年)のCAGRは3.79%で成長すると予測されます。
2022年には、持続可能な代替品としての植物性食品への嗜好の高まりと相まって菜食主義が台頭しているため、食品・飲料と動物飼料が合わせてシェアの50%以上を占めました。
- 2022年には、飲食品セグメントが最も高い需要を目の当たりにし、次いで動物飼料が続きます。飲食品セグメントは成長し、調査期間中に金額ベースで4.11%のCAGRを記録しました。動物飼料と化粧品における植物性たんぱく質の利用率の上昇が、近年の成長を牽引しています。大豆、小麦、エンドウ豆のような飼料組成物におけるたんぱく質タイプの高い使用率が、動物飼料市場を牽引しています。乳製品や肉の代替品における植物性たんぱく質の需要の増加は、予測期間中にこのセグメントを牽引すると思われます。
- 飲食品セクターのアプリケーションは、国内の植物性たんぱく質需要を牽引し、2022年には54.2%の数量シェアを記録しました。これは主に、持続可能な代替品として植物性食品への嗜好が高まっているためです。食肉代替製品サブセグメントは、飲食品用途から莫大な需要を目の当たりにしており、2022年の数量シェアは38.03%、次いで乳製品代替製品サブセグメントとなっています。植物由来の肉が急速に拡大し、食料品店やファーストフード・レストランで広く提供されるようになったことで、こうした食生活はより便利で継続しやすくなっています。
- サプリメントは、その計り知れない健康効果により、予測期間中にCAGR 6.30%を記録し、市場で最も急成長する分野と予想されます。植物性プロテインパウダーは食物繊維が豊富で、乳製品プロテインパウダーよりも栄養密度が高いため、カゼインやホエイパウダーの代替品として適しています。米やエンドウ豆などの植物性たんぱく質は、低アレルギー性であり、乳糖不耐症に悩む人々の栄養価の高い代替品として人気を集めています。2022年には、米国人口の36%が乳糖不耐症であり、代替たんぱく質の高い需要につながっています。
米国の植物性たんぱく質市場動向
植物性たんぱく質消費の成長は、原料市場の主要企業に機会を提供します。
- 米国では、投資と技術革新に支えられて、植物性たんぱく質の一人当たり消費量がかなりの割合で増加しており、その結果、消費量は1日当たり40.28グラムに達しています。これは主に、動物愛護を推進するために菜食主義を志向する消費者が増えているためです。米国では、動物が虐待される工場畜産が常態化しているからです。多くのアメリカ人は肉や動物性食品の摂取量を減らしているが、完全に排除しているわけではないです。また、ビーガンやベジタリアンよりもフレキシタリアンである傾向が強いです。米国では12%近くの消費者が植物性の食事を好み、7%の消費者がフレキシタリアンです。米国ではあらゆる世代の消費者が植物ベースの食事に関心を持っているが、20代と30代が最も植物ベースの食事に熱心です。
- 肉、鶏肉、ベーカリー製品など、さまざまな食品に幅広く利用されているため、一人当たりのエンドウタンパク消費量は常に増加しています。約41%の消費者がエンドウタンパク由来の植物性食品に関心を持っています。エンドウ豆プロテインは主にスポーツ栄養や肉の代替食品に使用されています。エンドウ豆プロテインパウダーの典型的な1食分は30グラムで、25グラムのたんぱく質が含まれています。アスリートは通常1日1食を使用するが、1日3食摂取することもあります。
- 大豆プロテインと乳清プロテインは、主に飲食品、サプリメント、スポーツ栄養産業で使用されています。2021年には、約36%の消費者が大豆たんぱく質を知っており、摂取したことがあるのに対し、米国では31%の人がホエイプロテインを摂取していました。同様に、大豆ベースの飲食品消費は2014年から2019年にかけて12.9%増加し、予測期間中も一貫して増加し続けると思われます。
大豆、小麦、エンドウ豆の生産は、植物性たんぱく質原料メーカーの原料として大きく貢献しています。
- グラフは、乾燥エンドウ豆、米、小麦、大豆などの原材料の生産データです。レビュー期間中に記録された生産により、国内での植物性たんぱく質成分の範囲が増加しています。米国は世界の大豆全体の約3分の1を生産し、ブラジルとアルゼンチンが僅差で続きます。2021年、米国は1億1,988万MTの大豆を生産し、世界の大豆生産量の31%を占めました。小麦は、作付面積、生産量、農家総収入において、米国畑作物の中でトウモロコシ、大豆に次いで第3位です。2023/24年産では、米国農家は冬小麦、デュラム小麦、その他春小麦を合計18億ブッシェル生産し、収穫面積は3,730万エーカーです。冬小麦の生産量は米国全体の70%近くを占める。
- 硬質赤色春小麦(HRS)は主要小麦品目のひとつであり、生産量のほぼ20%を占める。主にノースダコタ、モンタナ、ミネソタ、サウスダコタのような北部平原で栽培されています。硬質赤色春小麦は高たんぱく質で、特殊パンや低たんぱく質小麦とのブレンドに適しています。小麦たんぱく質市場の主な抑制要因は、グルテンフリー食品への関心の高まりと低炭水化物ダイエットへの関心の復活です。これらは小麦の消費量を減少させる可能性があります。
- アーカンソー・グランドプレーリー、ミシシッピ・デルタ、メキシコ湾岸、カリフォルニアのサクラメント・バレーは、米国産米のほぼ全量を生産する4つの地域です。これらの地域は通常、特定の種類の米に特化しており、米国では粒の長さ、すなわち長粒種、中粒種、短粒種で呼ばれています。一般的に、長粒種は米国米生産の約75%を占めています。
米国の植物性たんぱく質産業の概要
米国の植物性たんぱく質市場は適度に統合されており、上位5社で52.48%を占めています。この市場の主要企業は以下の通り。 Archer Daniels Midland Company, Bunge Limited, CHS Inc., International Flavors & Fragrances, Inc. and Kerry Group PLC(sorted alphabetically).
その他の特典
- エクセル形式の市場予測(ME)シート
- 3ヶ月のアナリストサポート
目次
第1章 エグゼクティブサマリーと主な調査結果
第2章 イントロダクション
- 調査の前提条件と市場定義
- 調査範囲
- 調査手法
第3章 主要産業動向
- エンドユーザー市場規模
- ベビーフードおよび乳児用調製乳
- ベーカリー
- 飲料
- 朝食用シリアル
- 調味料/ソース
- 菓子類
- 乳製品および乳製品代替製品
- 高齢者栄養・医療栄養
- 肉・鶏肉・魚介類および肉代替製品
- RTE/RTC食品
- スナック
- スポーツ/パフォーマンス栄養
- 動物飼料
- パーソナルケアと化粧品
- たんぱく質消費動向
- 植物
- 生産動向
- 植物
- 規制の枠組み
- 米国
- バリューチェーンと流通チャネル分析
第4章 市場セグメンテーション
- たんぱく質タイプ
- ヘンプたんぱく質
- エンドウ豆たんぱく質
- ポテトたんぱく質
- 米たんぱく質
- 大豆たんぱく質
- 小麦たんぱく質
- その他の植物性たんぱく質
- エンドユーザー
- 動物飼料
- 飲食品
- サブエンドユーザー別
- ベーカリー
- 飲料
- 朝食用シリアル
- 調味料/ソース
- 菓子類
- 乳製品・乳製品代替品
- 肉・鶏肉・魚介類および肉代替製品
- RTE/RTC食品
- スナック
- パーソナルケアと化粧品
- サプリメント
- サブエンドユーザー別
- ベビーフードおよび乳児用調製粉乳
- 高齢者栄養と医療栄養
- スポーツ/パフォーマンス栄養
第5章 競合情勢
- 主要な戦略動向
- 市場シェア分析
- 企業情勢
- 企業プロファイル(世界レベルの概要、市場レベルの概要、主要な事業セグメント、財務、従業員数、主要情報、市場ランク、市場シェア、製品・サービス、最近の動向分析を含む)
- AGT Food and Ingredients Inc.
- AMCO Proteins
- Anchor Ingredients Co. LLC
- Archer Daniels Midland Company
- Axiom Foods Inc.
- Bunge Limited
- Cargill Incorporated
- CHS Inc.
- Farbest-Tallman Foods Corporation
- Foodchem International Corporation
- Glanbia PLC
- Ingredion Incorporated
- International Flavors & Fragrances, Inc.
- Kerry Group PLC
- MB-Holding GmbH & Co. KG
- MGP
- Roquette Freres
- Sudzucker Group
- The Scoular Company
第6章 CEOへの主な戦略的質問
第7章 付録
- 世界概要
- 概要
- ファイブフォース分析フレームワーク
- 世界のバリューチェーン分析
- 市場力学(DROs)
- 情報源と参考文献
- 図表一覧
- 主要洞察
- データパック
- 用語集
目次
The United States Plant Protein Market size is estimated at 4.61 billion USD in 2025, and is expected to reach 5.56 billion USD by 2030, growing at a CAGR of 3.79% during the forecast period (2025-2030).
F&B and Animal feed together accounted for more than 50% of share in 2022, due to rising veganism coupled with growing preference for plant-based foods as a sustainable alternative.
- The food and beverage segment witnessed the highest demand, followed by animal feed, in 2022. The food and beverages segment grew, registering a CAGR of 4.11% by value during the study period. The rising utilization of plant proteins in animal feed and cosmetics has driven growth in recent years. The high usage of protein types in feed composition, such as soy, wheat, and pea drives the animal feed market. The increase in demand for plant proteins in dairy and meat alternatives will drive the segment during the forecast period.
- The food and beverages sector applications drive the demand for plant proteins in the country, and they registered a volume share of 54.2% in 2022. This was majorly due to the increasing preference for plant-based foods as a sustainable alternative. The meat alternative products sub-segment is witnessing huge demand from food and beverages applications, with a share of 38.03% by volume in 2022, followed by the dairy alternative products sub-segment. The rapid expansion of plant-based meats, which are now widely available in grocery stores and offered in fast-food restaurants, makes these diets more convenient and easier to maintain.
- Supplements are anticipated to be the fastest-growing sector in the market, registering a CAGR of 6.30% during the forecast period, owing to their immense health benefits. Plant protein powder is rich in fiber and is more nutrient dense than dairy protein powder, making it a suitable alternative to casein and whey powder. Plant proteins, such as rice and peas, are gaining popularity for being hypoallergenic and a nutritious alternative for people suffering from lactose intolerance. In 2022, 36% of the US population was lactose-intolerant people, leading to high demand for alternative proteins.
United States Plant Protein Market Trends
Growth in plant protein consumption provides opportunities for key players in the ingredients market
- The per capita consumption rate of plant proteins is increasing at a considerable rate in the United States, supported by investments and innovations, resulting in a consumption rate of 40.28 grams per day, primarily due to a rising number of consumers turning vegan to promote animal welfare. This is because factory farming, where animals are maltreated, is a norm in the United States. Most Americans eat less meat and animal products, but they do not eliminate their consumption entirely. They also tend to be more flexitarian than vegan or vegetarian. Nearly 12% of consumers in the country prefer a plant-based diet, whereas 7% of consumers follow a flexitarian diet. Although consumers of all generations in the United States are interested in plant-based meals, individuals in their 20s and 30s are the keenest to adopt plant-based diets.
- There is a constant rise in the per capita consumption of pea protein due to its wide applications in different food products, like meat, poultry, and bakery products. Around 41% of consumers are interested in plant-based food derived from pea protein. Pea protein is mainly used in sports nutrition and meat alternatives. A typical serving of pea protein powder is 30 grams, with 25 grams of protein. Athletes usually use one serving per day but may take as many as three servings per day.
- Soy and whey proteins are used primarily in the food and beverage, supplement, and sports nutrition industries. In 2021, around 36% of consumers were familiar with soy protein and had consumed the same, whereas 31% of individuals consumed whey protein in the US. Similarly, the consumption of soy-based food and beverages favorably increased by 12.9% during 2014-2019, and it is likely to remain consistent throughout the forecast period.
Soy, wheat, and pea production contributes majorly as raw material for plant protein ingredients manufacturers
- The graph given depicts the production data for raw materials such as dry peas, rice, wheat, and soya beans. There is an increasing scope for plant protein ingredients in the country due to the production recorded during the review period. The United States produces about one-third of the total soybeans in the world, followed closely by Brazil and Argentina. In 2021, the country produced 119.88 million MT of soybeans and accounted for 31% of the global soybean production. Wheat ranks third among the US field crops in planted acreage, production, and gross farm receipts behind corn and soybeans. In the marketing year 2023/24, the US farmers produced a total of 1.8 billion bushels of winter, durum, and other spring wheat from a harvested area of 37.3 million acres. Winter wheat production represents nearly 70% of total US production, on average.
- Hard red spring (HRS) wheat is one of the major wheat categories, accounting for almost 20% of the production. It is grown primarily in the northern plains, like North Dakota, Montana, Minnesota, and South Dakota. Hard red spring wheat is valued for its high protein level, making it suitable for specialty bread and blending with lower-protein wheat. Major restraints for the wheat protein market are the rising interest in gluten-free foods and the revived interest in low-carbohydrate diets. These may reduce the level of wheat consumption.
- Arkansas Grand Prairie, Mississippi Delta, Gulf Coast, and Sacramento Valley of California are four regions producing almost the entire US rice crop. Each of these regions normally specializes in a specific type of rice, referred to in the United States by length of grain, i.e., long, medium, and short. In general, long-grain production accounts for approximately 75% of the US rice production.
United States Plant Protein Industry Overview
The United States Plant Protein Market is moderately consolidated, with the top five companies occupying 52.48%. The major players in this market are Archer Daniels Midland Company, Bunge Limited, CHS Inc., International Flavors & Fragrances, Inc. and Kerry Group PLC (sorted alphabetically).
Additional Benefits:
- The market estimate (ME) sheet in Excel format
- 3 months of analyst support
TABLE OF CONTENTS
1 EXECUTIVE SUMMARY & KEY FINDINGS
2 INTRODUCTION
- 2.1 Study Assumptions & Market Definition
- 2.2 Scope of the Study
- 2.3 Research Methodology
3 KEY INDUSTRY TRENDS
- 3.1 End User Market Volume
- 3.1.1 Baby Food and Infant Formula
- 3.1.2 Bakery
- 3.1.3 Beverages
- 3.1.4 Breakfast Cereals
- 3.1.5 Condiments/Sauces
- 3.1.6 Confectionery
- 3.1.7 Dairy and Dairy Alternative Products
- 3.1.8 Elderly Nutrition and Medical Nutrition
- 3.1.9 Meat/Poultry/Seafood and Meat Alternative Products
- 3.1.10 RTE/RTC Food Products
- 3.1.11 Snacks
- 3.1.12 Sport/Performance Nutrition
- 3.1.13 Animal Feed
- 3.1.14 Personal Care and Cosmetics
- 3.2 Protein Consumption Trends
- 3.2.1 Plant
- 3.3 Production Trends
- 3.3.1 Plant
- 3.4 Regulatory Framework
- 3.4.1 United States
- 3.5 Value Chain & Distribution Channel Analysis
4 MARKET SEGMENTATION (includes market size in Value in USD and Volume, Forecasts up to 2030 and analysis of growth prospects)
- 4.1 Protein Type
- 4.1.1 Hemp Protein
- 4.1.2 Pea Protein
- 4.1.3 Potato Protein
- 4.1.4 Rice Protein
- 4.1.5 Soy Protein
- 4.1.6 Wheat Protein
- 4.1.7 Other Plant Protein
- 4.2 End User
- 4.2.1 Animal Feed
- 4.2.2 Food and Beverages
- 4.2.2.1 By Sub End User
- 4.2.2.1.1 Bakery
- 4.2.2.1.2 Beverages
- 4.2.2.1.3 Breakfast Cereals
- 4.2.2.1.4 Condiments/Sauces
- 4.2.2.1.5 Confectionery
- 4.2.2.1.6 Dairy and Dairy Alternative Products
- 4.2.2.1.7 Meat/Poultry/Seafood and Meat Alternative Products
- 4.2.2.1.8 RTE/RTC Food Products
- 4.2.2.1.9 Snacks
- 4.2.3 Personal Care and Cosmetics
- 4.2.4 Supplements
- 4.2.4.1 By Sub End User
- 4.2.4.1.1 Baby Food and Infant Formula
- 4.2.4.1.2 Elderly Nutrition and Medical Nutrition
- 4.2.4.1.3 Sport/Performance Nutrition
5 COMPETITIVE LANDSCAPE
- 5.1 Key Strategic Moves
- 5.2 Market Share Analysis
- 5.3 Company Landscape
- 5.4 Company Profiles (includes Global Level Overview, Market Level Overview, Core Business Segments, Financials, Headcount, Key Information, Market Rank, Market Share, Products and Services, and Analysis of Recent Developments).
- 5.4.1 AGT Food and Ingredients Inc.
- 5.4.2 AMCO Proteins
- 5.4.3 Anchor Ingredients Co. LLC
- 5.4.4 Archer Daniels Midland Company
- 5.4.5 Axiom Foods Inc.
- 5.4.6 Bunge Limited
- 5.4.7 Cargill Incorporated
- 5.4.8 CHS Inc.
- 5.4.9 Farbest-Tallman Foods Corporation
- 5.4.10 Foodchem International Corporation
- 5.4.11 Glanbia PLC
- 5.4.12 Ingredion Incorporated
- 5.4.13 International Flavors & Fragrances, Inc.
- 5.4.14 Kerry Group PLC
- 5.4.15 MB-Holding GmbH & Co. KG
- 5.4.16 MGP
- 5.4.17 Roquette Freres
- 5.4.18 Sudzucker Group
- 5.4.19 The Scoular Company
6 KEY STRATEGIC QUESTIONS FOR PROTEIN INGREDIENTS INDUSTRY CEOS
7 APPENDIX
- 7.1 Global Overview
- 7.1.1 Overview
- 7.1.2 Porter's Five Forces Framework
- 7.1.3 Global Value Chain Analysis
- 7.1.4 Market Dynamics (DROs)
- 7.2 Sources & References
- 7.3 List of Tables & Figures
- 7.4 Primary Insights
- 7.5 Data Pack
- 7.6 Glossary of Terms
- 発行日
- 発行
- Mordor Intelligence
- ページ情報
- 英文 260 Pages
- 納期
- 2~3営業日


