
植物性たんぱく質:市場シェア分析、産業動向・統計、成長予測(2025年~2030年)
Plant Protein - Market Share Analysis, Industry Trends & Statistics, Growth Forecasts (2025 - 2030)- 発行日
- ページ情報
- 英文 439 Pages
- 納期
- 2~3営業日
- 商品コード
- 1692032
- カスタマイズ可能 お客様のご希望に応じて、既存データの加工や未掲載情報(例:国別セグメント)の追加などの対応が可能です。詳細はお問い合わせください。
- 適宜更新あり 本レポートは最新情報反映のため適宜更新し、内容構成変更を行う場合があります。ご検討の際はお問い合わせください。
- 翻訳ツール提供対象 PDF対応AI翻訳ツールの無料貸し出しサービスのご利用が可能です
概要
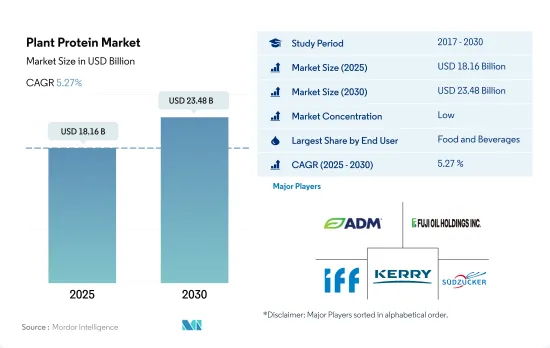
植物性たんぱく質市場規模は2025年に181億6,000万米ドルと推定され、2030年には234億8,000万米ドルに達すると予測され、予測期間中(2025-2030年)のCAGRは5.27%で成長します。
乳糖不耐症人口の増加と天然製品に対する需要の高まりが飲食品セグメントの成長を牽引している
- 飲食品部門は、無農薬食品への幅広いシフトを反映した肉と乳製品の代替品に対する需要の急増に牽引され、市場を独占しました。このシフトは、主に消費者の嗜好の進化に後押しされたもので、たんぱく質が豊富な飲料やスナック菓子に顕著な重点が置かれています。例えば、米国の55%の家庭は、食料品の選択において高たんぱく質を優先しています。主要なF&Bサブセグメントのひとつであるベーカリーは、2022年の前年比成長率が18.17%でした。
- F&Bセグメントに僅差で続く動物飼料セグメントは、予測期間中に5.26%の健全なCAGRを示すと見られています。この成長は、家畜に最適な栄養を供給するためのコスト効率の高い手段を農家に提供する植物性たんぱく質の経済的利点に支えられています。必須アミノ酸を豊富に含む植物性たんぱく質は、栄養、抗酸化物質、食物繊維を強化し、家畜の健康を強化するため、家畜用飼料としてますます好まれるようになっています。特に、低抗原性濃縮大豆たんぱく質は、その栄養プロファイルで際立っており、海産魚と淡水魚の両方を含む様々な魚種用の栄養豊富な水産飼料として好まれています。
- スポーツ・パフォーマンス栄養サブセグメントは主要な市場促進要因として浮上し、調査期間中に堅調な業績を示しました。予測によると、この勢いは続き、予測期間中に予想CAGR 5.84%を記録します。この上昇の背景には、ジムやヘルスクラブに入会する人の増加、菜食主義、動物由来成分不使用、植物性製品への関心の高まりがあります。また、メーカー各社はスポーツ用たんぱく質パウダーやサプリメントの植物由来バージョンを発売しており、立証された成分の需要をさらに高めています。
菜食主義の動向と持続可能性への要求の高まりが北米の成長を促進すると予測されます。
- フレキシタリアンやビーガンの数は世界的に増加しており、植物性食品の需要を押し上げています。消費者の多くはたんぱく質と健康を強く結び付けており、植物性たんぱく質に対する考え方は近年著しく前向きになっています。世界中の消費者の61%が、植物を好ましい蛋白源と考えています。欧州とアジア太平洋は植物性蛋白質に対して特に好意的で、2021年にはそれぞれ16%と21%が植物性蛋白質を好むようになりました。
- 北米は、その幅広い消費者層と世界的に確固たる地位を築いている堅調な食品産業により、最大の地域市場となっています。同地域は、2024年から2029年にかけて4.03%という大幅な成長率を記録するとみられています。この地域はまた、菜食主義の動向と持続可能性に対する消費者の要求の高まりからも恩恵を受けています。アメリカ人の約5%が自らをベジタリアンと考え、3%がビーガンと考えています。
- 成長という点では、南米が2024~2029年に金額ベースで最速のCAGR 6.13%を記録すると予測されます。フィットネスやスポーツ活動が盛んなブラジルでは需要が高いです。また、同国には膨大な消費者基盤があり、市場の成長に寄与しています。例えば、ブラジルのフィットネスセンターであるサンタンデールは、ラテンアメリカ全土に1,200以上のジムを展開しています。
- アジア太平洋は、2024~2029年の間に金額ベースで5.96%のCAGRで推移すると予想されています。同地域では自然食品への嗜好が高まっており、これが同セグメントの成長を飛躍的に促進しています。例えば、同地域の消費者の81%が食品購入において天然成分を重視しており、植物たんぱく質の応用を促進しています。
世界の植物性たんぱく質市場動向
植物性たんぱく質をベースとした食事にはいくつかの健康上の利点があるため、顧客はビーガン向けの製品に移行しています。
- 世界において、消費者の食生活の嗜好は変化しています。特に、欧州と北米の消費者の間で、乳製品と肉の代替品への嗜好が高まっています。2022年には、植物由来の牛乳が植物由来の食品売上全体の38%を占め、欧州がリードし、植物由来の肉が僅差でこれに続きます。この進化する動向は、フレキシタリアンやビーガンの消費者の数を押し上げ、メーカーが植物性たんぱく質分野でイノベーションを起こすための扉を開いています。
- 植物性たんぱく質代替食品の人気は、その栄養価によるもので、環境への影響、倫理、健康に対する懸念の高まりに起因します。炭水化物に比べて消化が遅いことで知られるたんぱく質は、少ないカロリーで満腹感を長時間持続させることで、体重管理に重要な役割を果たしています。新たな研究によると、2022年から2023年にかけて、世界で10億人以上が肥満とともに暮らしていることが明らかになりました。
- さらに、若年層のスポーツやフィットネス活動への関与の高まりと、健康上の利点を付加するために機能性成分で飲食品を強化する傾向の高まりが、植物性たんぱく質の需要を促進しています。2023年には、6歳以上の米国人(人口の約80%)が少なくとも1つのスポーツやフィットネス活動に参加し、過去最高の2億4,200万人に達し、2022年から2.2%増加しました。このアクティブなライフスタイルの変化が、植物性たんぱく質食品の需要を牽引しています。さらに、カナダの保健省が食品ガイドを刷新し、野菜と果物、全粒穀物、植物性たんぱく質という3つの主要カテゴリーを強調するなど、政府の取り組みが消費者の代替たんぱく質に対する認識と需要を促進しています。
大豆、小麦、エンドウ豆の生産は、植物性たんぱく質原料メーカーの原料として大きく貢献しています。
- 大豆、米、小麦からの植物性たんぱく質原料は植物性たんぱく質の消費を支配しており、そのため世界的に生産量を押し上げています。2019年、米国は2018-2019年の生産量が1億2,052万トンで、大豆の世界の主要生産国でした。ブラジルは米国を抜いて大豆生産国のトップに立ち、2020-2021年の生産量は1億3,800万トンとなりました。中国とインドは合わせて3億8,900万トンを生産し、2021年の世界生産量の半分以上を占めました。同年にそれぞれ約5,460万トンを生産した3位と4位の国、すなわちインドネシアとバングラデシュを大きく引き離しています。
- 南米のエンドウ豆生産量は増加し、2020年には16万7,541ヘクタールに達しました。世界輸出の約7%を占めるアルゼンチンは、この地域における小麦の主要生産国および輸出国です。共通農業政策(CAP)の下、ドイツのような一部の国で新たな緑化対策が導入されたことが、調査期間中のエンドウ豆の生産量を押し上げました。
- また、多くの国で政府の取り組みが、たんぱく質種子生産の成長に貢献しています。例えば、サウジアラビア政府は、特定の作物の生産において比較優位性を持つ外国に投資し、その製品をサウジアラビアに再輸出するよう農業企業を奨励しています。この構想の対象となる作物には、小麦、米、大麦、イエローコーン、大豆、青刈り飼料などがあります。サウジアラビア政府はまた、地元の投資家(企業および個人)が食料安全保障の取り組みに参加することを奨励するため、財政的インセンティブを提供しています。
植物性たんぱく質産業の概要
植物蛋白市場は細分化されており、上位5社で25.13%を占めています。この市場の主要企業は以下の通りです。 Archer Daniels Midland Company, Fuji Oil Group, International Flavors & Fragrances Inc., Kerry Group PLC and Sudzucker AG(sorted alphabetically).
その他の特典
- エクセル形式の市場予測(ME)シート
- 3ヶ月間のアナリストサポート
目次
第1章 エグゼクティブサマリーと主な調査結果
第2章 イントロダクション
- 調査の前提条件と市場定義
- 調査範囲
- 調査手法
第3章 主要産業動向
- エンドユーザー市場数量
- ベビーフードおよび乳児用調製乳
- ベーカリー
- 飲料
- 朝食用シリアル
- 調味料/ソース
- 菓子類
- 乳製品および乳製品代替製品
- 高齢者栄養・医療栄養
- 肉・鶏肉・魚介類および肉代替製品
- RTE/RTC食品
- スナック
- スポーツ/パフォーマンス栄養
- 動物飼料
- パーソナルケアと化粧品
- たんぱく質消費動向
- 植物
- 生産動向
- 植物
- 規制の枠組み
- オーストラリア
- ブラジル、アルゼンチン
- カナダ
- 中国
- フランス
- ドイツ
- インド
- イタリア
- 日本
- 南アフリカ
- UAEおよびサウジアラビア
- 英国
- 米国
- バリューチェーンと流通チャネル分析
第4章 市場セグメンテーション
- たんぱく質タイプ
- ヘンプたんぱく質
- エンドウ豆たんぱく質
- ポテトたんぱく質
- 米たんぱく質
- 大豆たんぱく質
- 小麦たんぱく質
- その他の植物性たんぱく質
- エンドユーザー
- 動物飼料
- 飲食品
- サブエンドユーザー別
- ベーカリー
- 飲料
- 朝食用シリアル
- 調味料/ソース
- 菓子類
- 乳製品・乳製品代替品
- 肉・鶏肉・魚介類および肉代替製品
- RTE/RTC食品
- スナック
- パーソナルケアと化粧品
- サプリメント
- サブエンドユーザー別
- ベビーフードおよび乳児用調製乳
- 高齢者栄養と医療栄養
- スポーツ/パフォーマンス栄養
- 地域別
- アフリカ
- たんぱく質タイプ別
- エンドユーザー別
- 国別
- ナイジェリア
- 南アフリカ
- その他のアフリカ
- アジア太平洋
- たんぱく質タイプ別
- エンドユーザー別
- 国別
- オーストラリア
- 中国
- インド
- インドネシア
- 日本
- マレーシア
- ニュージーランド
- 韓国
- タイ
- ベトナム
- その他アジア太平洋地域
- 欧州
- たんぱく質タイプ別
- エンドユーザー別
- 国別
- ベルギー
- フランス
- ドイツ
- イタリア
- オランダ
- ロシア
- スペイン
- トルコ
- 英国
- その他欧州
- 中東
- たんぱく質タイプ別
- エンドユーザー別
- 国別
- イラン
- サウジアラビア
- アラブ首長国連邦
- その他中東
- 北米
- たんぱく質タイプ別
- エンドユーザー別
- 国別
- カナダ
- メキシコ
- 米国
- その他北米
- 南米
- たんぱく質タイプ別
- エンドユーザー別
- 国別
- アルゼンチン
- ブラジル
- その他南米地域
- アフリカ
第5章 競合情勢
- 主要な戦略動向
- 市場シェア分析
- 企業情勢
- 企業プロファイル.
- Archer Daniels Midland Company
- Bunge Limited
- CHS Inc.
- Fuji Oil Group
- International Flavors & Fragrances Inc.
- Kerry Group PLC
- Lantmannen
- Roquette Frere
- Sudzucker AG
- Tereos SCA
- Wilmar International Ltd
第6章 CEOへの主な戦略的質問
第7章 付録
- 世界概要
- 概要
- ファイブフォース分析フレームワーク
- 世界のバリューチェーン分析
- 市場力学(DROs)
- 情報源と参考文献
- 図表一覧
- 主要洞察
- データパック
- 用語集
目次
The Plant Protein Market size is estimated at 18.16 billion USD in 2025, and is expected to reach 23.48 billion USD by 2030, growing at a CAGR of 5.27% during the forecast period (2025-2030).
The increasing lactose-intolerant population and the growing demand for natural products are driving the growth of the food and beverages segment
- The food and beverages segment dominated the market, driven by a surge in demand for meat and dairy alternatives, reflecting a broader shift toward cruelty-free food. This shift was primarily fueled by evolved consumer preferences, with a notable emphasis on protein-rich beverages and snacks. For example, 55% of US households prioritize high protein content in their grocery choices. Bakery, one of the primary F&B sub-segments, witnessed a Y-o-Y growth rate of 18.17% in 2022.
- Following closely behind the F&B segment, the animal feed segment is poised to exhibit a healthy CAGR of 5.26% during the forecast period. This growth is underpinned by the economic advantages of plant proteins, which offer farmers a cost-effective means to provide optimal nutrition to their livestock. Plant-based proteins, rich in essential amino acids, are increasingly being favored in animal feed formulations, offering enhanced nutrition, antioxidants, and fiber, thereby bolstering animal health. Notably, low-antigen soy protein concentrate stands out for its nutritional profile, making it a preferred choice in nutrient-dense aquafeeds for various fish species, both marine and freshwater.
- The sports and performance nutrition sub-segment emerged as a key market driver, showcasing a robust performance during the study period. Projections indicate it will continue this momentum, recording an anticipated CAGR of 5.84% during the forecast period. The rise can be attributed to an increasing number of people joining gyms and health clubs and increasing interest in veganism, no animal-derived ingredients, and plant-based products. Also, manufacturers are launching plant-based versions of their sports protein powders and supplements, further bolstering the demand for substantiated ingredients.
Growing trend of veganism and demand for sustainability projected to drive growth in North America
- The number of flexitarians and vegans is rising globally, boosting the demand for plant-based food products. Most consumers strongly associate protein with health, and attitudes to plant-based proteins have become significantly more positive in recent years. Worldwide, 61% of consumers considered plants to be a preferred protein source. Europe and Asia-Pacific had particularly positive opinions about plant protein, with 16% and 21% preferring it in 2021, respectively.
- North America is the largest regional market due to its wide consumer base and robust food industry, which has established a strong position globally. The region is set to record a significant growth volume of 4.03% between 2024 and 2029. The region also benefits from the growing trend of veganism and consumers' demand for sustainability. About 5% of Americans consider themselves vegetarians, and 3% consider themselves vegans.
- In terms of growth, South America is projected to record the fastest CAGR of 6.13% in terms of value during 2024-2029. The demand is high in Brazil, which is witnessing a rise in fitness and sports activities. The country also has a vast consumer base, contributing to the market's growth. For instance, Santander, a fitness center in Brazil, is operational with more than 1,200 gyms across Latin America.
- Asia-Pacific is anticipated to register a CAGR of 5.96% by value during 2024-2029. The growing preference for natural foods in the region is drastically driving the segment's growth. For instance, 81% of the region's consumers focus on natural ingredients in food purchases, driving the application of plant proteins.
Global Plant Protein Market Trends
Due to several health benefits of plant protein-based diets, customers are moving toward vegan offerings
- Globally, consumers are shifting their dietary preferences. Notably, there is a growing preference for dairy and meat alternatives, especially among consumers in Europe and North America. In 2022, Europe led the way with plant-based milk accounting for 38% of total plant-based food sales, followed closely by plant-based meat. This evolving trend is boosting the number of flexitarian and vegan consumers and opening doors for manufacturers to innovate within the plant protein sector.
- The popularity of plant-based protein alternatives is due to their nutritional value and stems from growing concerns over environmental impact, ethics, and health. Proteins, known for their slower digestion compared to carbohydrates, play a crucial role in weight management by promoting a longer-lasting feeling of fullness with fewer calories. A new study reveals that over one billion people globally were living with obesity between 2022 and 2023.
- Moreover, the rising engagement of the younger population in sports and fitness activities, coupled with a growing trend of fortifying food and beverages with functional ingredients for added health benefits, is fueling the demand for plant-based proteins. In 2023, a record-high 242 million Americans aged 6 and older (nearly 80% of the population) participated in at least one sport or fitness activity, a 2.2% increase from 2022. This active lifestyle shift is driving the demand for plant-based protein food products. Furthermore, government initiatives, such as Canada's Health Ministry, which revamped its food guide, emphasizing three key categories: vegetables and fruits, whole grains, and plant-based proteins, are driving awareness and demand for alternative proteins among consumers.
Soy, wheat, and pea production contribute significantly as raw materials for plant protein ingredient manufacturers
- In 2019, the United States was the leading global producer of soybeans, with a production volume of 120.52 million tons in 2018-2019. Brazil overtook the United States as the leading soybean-producing country, with a production volume of 138 million tons in 2020-2021. China and India together produced 389 million tons and accounted for more than half of the global production in 2021. They were significantly ahead of the countries ranked third and fourth, i.e., Indonesia and Bangladesh, which produced around 54.6 million tons each in the same year.
- Pea production in South America increased, reaching 167,541 ha in 2020. Accounting for around 7% of global exports, Argentina is the main producer and exporter of wheat in the region. The introduction of new greening measures in some countries like Germany under the Common Agricultural Policy (CAP) drove the production volume of peas over the study period.
- Government initiatives in many countries are also catering to the growth of protein seed production. For instance, the Saudi Arabian government is encouraging agricultural companies to invest in foreign countries that have comparative advantages in producing certain crops and re-exporting their products back to Saudi Arabia. The crops targeted by this initiative include wheat, rice, barley, yellow corn, soybeans, and green forage. The Saudi Arabian government is also providing financial incentives to encourage local investors (companies and individuals) to take part in food security initiatives.
Plant Protein Industry Overview
The Plant Protein Market is fragmented, with the top five companies occupying 25.13%. The major players in this market are Archer Daniels Midland Company, Fuji Oil Group, International Flavors & Fragrances Inc., Kerry Group PLC and Sudzucker AG (sorted alphabetically).
Additional Benefits:
- The market estimate (ME) sheet in Excel format
- 3 months of analyst support
TABLE OF CONTENTS
1 EXECUTIVE SUMMARY & KEY FINDINGS
2 INTRODUCTION
- 2.1 Study Assumptions & Market Definition
- 2.2 Scope of the Study
- 2.3 Research Methodology
3 KEY INDUSTRY TRENDS
- 3.1 End User Market Volume
- 3.1.1 Baby Food and Infant Formula
- 3.1.2 Bakery
- 3.1.3 Beverages
- 3.1.4 Breakfast Cereals
- 3.1.5 Condiments/Sauces
- 3.1.6 Confectionery
- 3.1.7 Dairy and Dairy Alternative Products
- 3.1.8 Elderly Nutrition and Medical Nutrition
- 3.1.9 Meat/Poultry/Seafood and Meat Alternative Products
- 3.1.10 RTE/RTC Food Products
- 3.1.11 Snacks
- 3.1.12 Sport/Performance Nutrition
- 3.1.13 Animal Feed
- 3.1.14 Personal Care and Cosmetics
- 3.2 Protein Consumption Trends
- 3.2.1 Plant
- 3.3 Production Trends
- 3.3.1 Plant
- 3.4 Regulatory Framework
- 3.4.1 Australia
- 3.4.2 Brazil and Argentina
- 3.4.3 Canada
- 3.4.4 China
- 3.4.5 France
- 3.4.6 Germany
- 3.4.7 India
- 3.4.8 Italy
- 3.4.9 Japan
- 3.4.10 South Africa
- 3.4.11 UAE and Saudi Arabia
- 3.4.12 United Kingdom
- 3.4.13 United States
- 3.5 Value Chain & Distribution Channel Analysis
4 MARKET SEGMENTATION (includes market size in Value in USD and Volume, Forecasts up to 2030 and analysis of growth prospects)
- 4.1 Protein Type
- 4.1.1 Hemp Protein
- 4.1.2 Pea Protein
- 4.1.3 Potato Protein
- 4.1.4 Rice Protein
- 4.1.5 Soy Protein
- 4.1.6 Wheat Protein
- 4.1.7 Other Plant Protein
- 4.2 End User
- 4.2.1 Animal Feed
- 4.2.2 Food and Beverages
- 4.2.2.1 By Sub End User
- 4.2.2.1.1 Bakery
- 4.2.2.1.2 Beverages
- 4.2.2.1.3 Breakfast Cereals
- 4.2.2.1.4 Condiments/Sauces
- 4.2.2.1.5 Confectionery
- 4.2.2.1.6 Dairy and Dairy Alternative Products
- 4.2.2.1.7 Meat/Poultry/Seafood and Meat Alternative Products
- 4.2.2.1.8 RTE/RTC Food Products
- 4.2.2.1.9 Snacks
- 4.2.3 Personal Care and Cosmetics
- 4.2.4 Supplements
- 4.2.4.1 By Sub End User
- 4.2.4.1.1 Baby Food and Infant Formula
- 4.2.4.1.2 Elderly Nutrition and Medical Nutrition
- 4.2.4.1.3 Sport/Performance Nutrition
- 4.3 Region
- 4.3.1 Africa
- 4.3.1.1 By Protein Type
- 4.3.1.2 By End User
- 4.3.1.3 By Country
- 4.3.1.3.1 Nigeria
- 4.3.1.3.2 South Africa
- 4.3.1.3.3 Rest of Africa
- 4.3.2 Asia-Pacific
- 4.3.2.1 By Protein Type
- 4.3.2.2 By End User
- 4.3.2.3 By Country
- 4.3.2.3.1 Australia
- 4.3.2.3.2 China
- 4.3.2.3.3 India
- 4.3.2.3.4 Indonesia
- 4.3.2.3.5 Japan
- 4.3.2.3.6 Malaysia
- 4.3.2.3.7 New Zealand
- 4.3.2.3.8 South Korea
- 4.3.2.3.9 Thailand
- 4.3.2.3.10 Vietnam
- 4.3.2.3.11 Rest of Asia-Pacific
- 4.3.3 Europe
- 4.3.3.1 By Protein Type
- 4.3.3.2 By End User
- 4.3.3.3 By Country
- 4.3.3.3.1 Belgium
- 4.3.3.3.2 France
- 4.3.3.3.3 Germany
- 4.3.3.3.4 Italy
- 4.3.3.3.5 Netherlands
- 4.3.3.3.6 Russia
- 4.3.3.3.7 Spain
- 4.3.3.3.8 Turkey
- 4.3.3.3.9 United Kingdom
- 4.3.3.3.10 Rest of Europe
- 4.3.4 Middle East
- 4.3.4.1 By Protein Type
- 4.3.4.2 By End User
- 4.3.4.3 By Country
- 4.3.4.3.1 Iran
- 4.3.4.3.2 Saudi Arabia
- 4.3.4.3.3 United Arab Emirates
- 4.3.4.3.4 Rest of Middle East
- 4.3.5 North America
- 4.3.5.1 By Protein Type
- 4.3.5.2 By End User
- 4.3.5.3 By Country
- 4.3.5.3.1 Canada
- 4.3.5.3.2 Mexico
- 4.3.5.3.3 United States
- 4.3.5.3.4 Rest of North America
- 4.3.6 South America
- 4.3.6.1 By Protein Type
- 4.3.6.2 By End User
- 4.3.6.3 By Country
- 4.3.6.3.1 Argentina
- 4.3.6.3.2 Brazil
- 4.3.6.3.3 Rest of South America
- 4.3.1 Africa
5 COMPETITIVE LANDSCAPE
- 5.1 Key Strategic Moves
- 5.2 Market Share Analysis
- 5.3 Company Landscape
- 5.4 Company Profiles (includes Global Level Overview, Market Level Overview, Core Business Segments, Financials, Headcount, Key Information, Market Rank, Market Share, Products and Services, and Analysis of Recent Developments).
- 5.4.1 Archer Daniels Midland Company
- 5.4.2 Bunge Limited
- 5.4.3 CHS Inc.
- 5.4.4 Fuji Oil Group
- 5.4.5 International Flavors & Fragrances Inc.
- 5.4.6 Kerry Group PLC
- 5.4.7 Lantmannen
- 5.4.8 Roquette Frere
- 5.4.9 Sudzucker AG
- 5.4.10 Tereos SCA
- 5.4.11 Wilmar International Ltd
6 KEY STRATEGIC QUESTIONS FOR PROTEIN INGREDIENTS INDUSTRY CEOS
7 APPENDIX
- 7.1 Global Overview
- 7.1.1 Overview
- 7.1.2 Porter's Five Forces Framework
- 7.1.3 Global Value Chain Analysis
- 7.1.4 Market Dynamics (DROs)
- 7.2 Sources & References
- 7.3 List of Tables & Figures
- 7.4 Primary Insights
- 7.5 Data Pack
- 7.6 Glossary of Terms
- 発行日
- 発行
- Mordor Intelligence
- ページ情報
- 英文 439 Pages
- 納期
- 2~3営業日


