
|
市場調査レポート
商品コード
1692022
インドの植物性タンパク質:市場シェア分析、産業動向と統計、成長予測(2025年~2030年)India Plant Protein - Market Share Analysis, Industry Trends & Statistics, Growth Forecasts (2025 - 2030) |
||||||
カスタマイズ可能
適宜更新あり
|
|||||||
| インドの植物性タンパク質:市場シェア分析、産業動向と統計、成長予測(2025年~2030年) |
|
出版日: 2025年03月18日
発行: Mordor Intelligence
ページ情報: 英文 213 Pages
納期: 2~3営業日
|

全表示
- 概要
- 目次
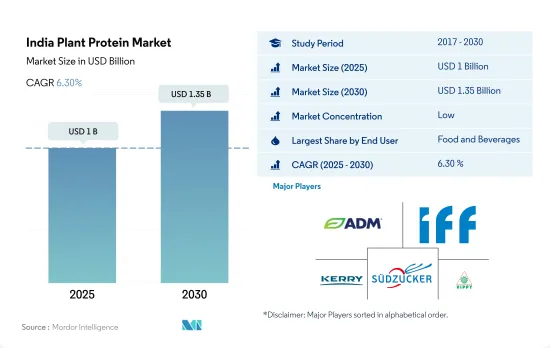
インドの植物性タンパク質市場規模は2025年に10億米ドルと推計され、2030年には13億5,000万米ドルに達し、市場推計・予測期間(2025年~2030年)のCAGRは6.30%で成長すると予測されます。
持続可能な代替手段としての植物性食品への嗜好の高まりと相まって菜食主義が台頭しているため、2022年には飲食品と飼料を合わせたシェアが60%を超えます。
- インドはアジア太平洋でベジタリアンの数が最も多いため、同国における植物性タンパク質の需要を牽引しています。また、ヘルシーで外出先での食事オプションへの志向の高まりも市場成長に寄与しています。2021年には、インド人の約70%が、食生活の変化を優先することで、全体的な健康と免疫力の向上、ストレスや不安の軽減に注力する意向を示しています。
- F&B分野が市場シェアを独占しています。また、予測期間中、数量ベースでCAGR 6.15%を記録すると予測されています。2022年現在、インド人口の24%が厳格ベジタリアン、9%がビーガン、8%がペスカタリアンです。飲食品に対する高い需要は、同国におけるベジタリアンとビーガニズムの高まりの中で、代替肉と代替乳製品に対する需要が高まっていることに起因します。
- すべてのエンドユーザー・セグメントの中で、パーソナルケアと化粧品セグメントは予測期間中に最も急成長するセグメントであると思われ、数量ベースでのCAGRは8.36%です。植物性タンパク質原料の使用において観察される主な動向は、高タンパク質含有原料がすでに利用可能になっていることです。それゆえ、持続可能な供給源と提供される原料中のタンパク質の品質に焦点が移っています。
- COVID-19のパンデミックは、地域の外食産業の脆弱性を露呈し、消費者をさらに小売産業へと駆り立てた。このため、同分野は予測期間中、数量ベースで14.96%の成長率を記録すると予想されます。2020年には、インドの消費者の63%が植物性タンパク質アイテムを定期的に購入することを望んでおり、COVID-19は人々に健康的な食生活の製品別である免疫力を認識させました。
インドの植物性タンパク質市場動向
インドは植物性タンパク質の消費量において主要市場のひとつに浮上しつつあります。
- 大豆、米、エンドウ豆、小麦などの主要な植物性タンパク質の生産量が増加し、その供給源からのタンパク質成分の入手に影響が出ています。国内では多くの植物性食品が主食として消費されているが、革新的な食品の開発におけるこれらのタンパク質原料の用途の増加が消費をさらに押し上げています。インターネットに精通した若い世代の間でビーガンのインフルエンサーの数と関与能力が高まっており、2023年時点でビーガン食は健康的(74%)、環境に良い(72%)、倫理的に健全(73%)であると信じていることも、インドにおけるビーガン傾向の上昇に極めて重要であることが証明されています。これらは、植物性タンパク質の需要増加の一因となっています。
- 植物性タンパク質に対する認識が高まるにつれ、インドの消費者、特に若い世代は植物性タンパク質を強化した食品に目を向けています。例えば、2024年現在、インド人の50%近くが植物性乳製品に精通しており、27.5%が肉の代替品について認識しています。こうした製品の認知度は、大都市圏と月収10万インドルピー(1,200米ドル)から15万インドルピー(1,800米ドル)の個人で最も顕著です。過去6ヵ月間に植物性ミルクを購入した人のうち、82%が再度購入する意向を示し、ビーガンミートについても72%が同様の意向を示しています。
- さらに、2022年から2023年にかけて、インドの人口のかなりの部分、80%近くが1日のタンパク質摂取量が不足しており、大多数(90%)が1日に推奨されるタンパク質の必要量を知りませんでした。このようなアンメットニーズから、植物性タンパク質の需要が高まるという強い予測が生まれ、この栄養ギャップを満たすための持続可能で潜在的により利用しやすい代替食品が提供されることになります。
インドは植物性タンパク質の中でも大豆とエンドウ豆の生産にさらに力を入れます。
- インドでは、米、小麦、乾燥エンドウ豆、大豆など、植物性タンパク質産業向けのさまざまな商品が生産されています。グラフはこれらの品目の生産データです。インドは世界有数のコメ生産国で、2021年には世界のコメ生産量の約20%を占める。高い生産量は、インドの土壌水分、低温、分散された降雨量に支えられています。2023~2024年の米総生産量は過去最高の1,378.25LMTと推定されます。これは前年の1,357.55トンより20.70トン多いです。2023~2024年における小麦の生産量は過去最高の1,132.92 LMTと推定され、前年の1,105.54 LMTを27.38 LMT上回り、Shree Annaの生産量は前年の173.21 LMTに対し175.72 LMTと推定されました。
- また、インドは世界でもトップクラスの大豆生産国です。2023年のカリフシーズンには、大豆生産量は1億1,870万トンと記録されています。公開会社や非公開会社は様々な技術を開発し、農家と直接関わりながら農家所得の向上と大豆収量の増加を図っています。生産量を増やすため、マハラシュトラ州政府と総合農業開発官民パートナーシップ(PPPIAD)は、ADMと協力して大豆栽培の新技術を導入しました。
- 同様に、PMKSY、PMFBY、PKVY、SHM SHC、e-NAMなどの農家中心の政策やプログラムも、インドのエンドウ豆生産における望ましい目標の達成に役立っています。ウッタル・プラデーシュ州とマディヤ・プラデーシュ州は、国内トップのエンドウ豆生産国です。2022年のインドにおけるキマメ生産量は、作付面積505万haで434万トン、生産性は859kg/haでした。
インド植物蛋白業界の概要
インド植物蛋白市場は断片化されており、上位5社で10.84%を占めています。この市場の主要企業は以下の通り。 Archer Daniels Midland Company, International Flavors & Fragrances, Inc., Kerry Group PLC, Sudzucker AG and VIPPY INDUSTRIES LIMITED(sorted alphabetically).
その他の特典
- エクセル形式の市場予測(ME)シート
- 3ヶ月のアナリストサポート
目次
第1章 エグゼクティブサマリーと主な調査結果
第2章 イントロダクション
- 調査の前提条件と市場定義
- 調査範囲
- 調査手法
第3章 主要産業動向
- エンドユーザー市場規模
- ベビーフードおよび乳児用調製粉乳
- ベーカリー
- 飲料
- 朝食用シリアル
- 調味料/ソース
- 菓子類
- 乳製品および乳製品代替製品
- 高齢者栄養・医療栄養
- 肉・鶏肉・魚介類および肉代替製品
- RTE/RTC食品
- スナック
- スポーツ/パフォーマンス栄養
- 動物飼料
- パーソナルケアと化粧品
- タンパク質消費動向
- 植物
- 生産動向
- 植物
- 規制の枠組み
- インド
- バリューチェーンと流通チャネル分析
第4章 市場セグメンテーション
- タンパク質タイプ
- ヘンプ・プロテイン
- エンドウ豆プロテイン
- ジャガイモ・プロテイン
- 米プロテイン
- 大豆プロテイン
- 小麦プロテイン
- その他の植物性タンパク質
- エンドユーザー
- 動物飼料
- 食品・飲料
- サブエンドユーザー別
- ベーカリー
- 飲料
- 朝食用シリアル
- 調味料/ソース
- 菓子類
- 乳製品・乳製品代替品
- 肉・鶏肉・魚介類および肉代替製品
- RTE/RTC食品
- スナック
- パーソナルケアと化粧品
- サプリメント
- サブエンドユーザー別
- ベビーフードおよび乳児用調製粉乳
- 高齢者栄養と医療栄養
- スポーツ/パフォーマンス栄養
第5章 競合情勢
- 主要な戦略動向
- 市場シェア分析
- 企業情勢
- 企業プロファイル.
- Archer Daniels Midland Company
- Cargill, Incorporated
- Ingredion Incorporated
- International Flavors & Fragrances, Inc.
- Kerry Group PLC
- Roquette Frere
- Sudzucker AG
- VIPPY INDUSTRIES LIMITED
第6章 CEOへの主な戦略的質問
第7章 付録
- 世界概要
- 概要
- ファイブフォース分析フレームワーク
- 世界のバリューチェーン分析
- 市場力学(DROs)
- 情報源と参考文献
- 図表一覧
- 主要洞察
- データパック
- 用語集
The India Plant Protein Market size is estimated at 1 billion USD in 2025, and is expected to reach 1.35 billion USD by 2030, growing at a CAGR of 6.30% during the forecast period (2025-2030).
Food & beverage and animal feed together accounted for more than 60% of the share in 2022, due to rising veganism coupled with growing preference for plant-based foods as a sustainable alternative
- India has the highest number of vegetarians in Asia-Pacific, thus driving the demand for plant-based proteins in the country. Also, the growing inclination toward healthy, on-the-go meal options contributes to market growth. In 2021, about 70% of Indians were willing to focus on improving their overall health and immunity and lowering stress and anxiety by prioritizing dietary changes.
- The F&B segment dominates the market share. It is also anticipated to register a CAGR of 6.15%, by volume, during the forecast period. As of 2022, 24% of the Indian population was strictly vegetarian, 9% was vegan, and 8% was pescatarian. The high demand for food and beverages is attributable to the growing demand for meat alternatives and dairy alternatives amid the rising vegetarianism and veganism in the country.
- Among all the end-user segments, the personal care and cosmetics segment is likely to be the fastest-growing segment during the forecast period, with a CAGR of 8.36%, by volume. The major trend observed in the usage of plant protein ingredients is that high protein content ingredients have already been made available. Hence, the focus has shifted toward sustainable sources and the quality of the protein in the ingredients being offered.
- The COVID-19 pandemic exposed the vulnerability of the regional food service sector, which further drove consumers to the retail sector. Thus, the segment is expected to register a growth rate of 14.96%, by volume, during the forecast period. In 2020, 63% of Indian consumers were willing to buy plant-based protein items regularly, and COVID-19 has made people aware of immunity, which is a by-product of a healthy food lifestyle.
India Plant Protein Market Trends
India emerging as one of the major markets in terms of plant protein consumption
- Increased production of major plant proteins, like soybean, rice, pea, and wheat, is impacting availability of protein ingredients from the sources. Although many plant products are consumed as staple foods in the country, the increased applications of these protein ingredients in developing innovative foods are further boosting their consumption. The increasing number and engagement capability of vegan influencers among the internet-savvy young generation, who also believed that a vegan diet is healthy (74%), good for the environment (72%), and ethically sound (73%) as of 2023, has proven to be pivotal in the rise of the veganism trend in India. These are among the factors contributing to the rising demand for plant-based protein.
- With the increasing awareness of plant proteins, Indian consumers, especially younger generations, are turning toward plant protein-fortified foods. For instance, as of 2024, nearly 50% of Indians are familiar with plant-based dairy products, and 27.5% are aware of meat alternatives. Awareness of these products is most prominent in metropolitan areas and among individuals with monthly incomes ranging from INR 100,000 (USD 1,200) to INR 150,000 (USD 1,800). Among those who purchased plant-based milk in the previous six months, 82% expressed a willingness to buy it again, with a comparable 72% indicating the same for vegan meat.
- Moreover, in 2022-2023, a significant portion of India's population, nearly 80%, was deficient in daily protein intake, and a vast majority (90%) was unaware of their recommended daily protein needs. This unmet need fuels a strong forecast for increased demand for plant-based proteins, offering a sustainable and potentially more accessible alternative to meet this nutritional gap.
India to focus more on soybean and pea production among plant protein types
- India produces different commodities for the plant protein industry, including rice, wheat, dry peas, and soy. The graph shows the production data for these commodities. India is one of the world's leading rice producers, accounting for about 20% of global rice production in 2021. The higher production of the commodities is supported by India's soil moisture, low temperatures, and well-distributed rainfall. Total rice production during 2023-2024 was estimated at a record 1,378.25 LMT. It is higher by 20.70 LMT than the previous year's rice production of 1,357.55 LMT. Wheat production during 2023-2024 was estimated at a record 1,132.92 LMT, higher by 27.38 LMT than the previous year's wheat production of 1,105.54 LMT, while the production of Shree Anna was estimated at 175.72 LMT as compared to 173.21 LMT during the previous year.
- India is also one of the top soybean producers worldwide. During the Kharif season 2023, the soybean production was recorded to be 118.7 million metric tons. Public and private companies are developing various techniques and directly engaging with farmers to enhance farm incomes and increase soybean yield. To augment the production, the State Government of Maharashtra and the Public-Private Partnership for Integrated Agriculture Development (PPPIAD), in collaboration with ADM, introduced new technologies for soybean cultivation.
- Similarly, several farm-centric policies and programs, such as PMKSY, PMFBY, PKVY, SHM SHC, and e-NAM, help attain the desired objectives in pea production in India. Uttar Pradesh and Madhya Pradesh are the country's top pea growers. The pigeon pea production in India amounted to 4.34 million tonnes from an acreage of 5.05 million ha, with a productivity of 859 kg/ha in 2022.
India Plant Protein Industry Overview
The India Plant Protein Market is fragmented, with the top five companies occupying 10.84%. The major players in this market are Archer Daniels Midland Company, International Flavors & Fragrances, Inc., Kerry Group PLC, Sudzucker AG and VIPPY INDUSTRIES LIMITED (sorted alphabetically).
Additional Benefits:
- The market estimate (ME) sheet in Excel format
- 3 months of analyst support
TABLE OF CONTENTS
1 EXECUTIVE SUMMARY & KEY FINDINGS
2 INTRODUCTION
- 2.1 Study Assumptions & Market Definition
- 2.2 Scope of the Study
- 2.3 Research Methodology
3 KEY INDUSTRY TRENDS
- 3.1 End User Market Volume
- 3.1.1 Baby Food and Infant Formula
- 3.1.2 Bakery
- 3.1.3 Beverages
- 3.1.4 Breakfast Cereals
- 3.1.5 Condiments/Sauces
- 3.1.6 Confectionery
- 3.1.7 Dairy and Dairy Alternative Products
- 3.1.8 Elderly Nutrition and Medical Nutrition
- 3.1.9 Meat/Poultry/Seafood and Meat Alternative Products
- 3.1.10 RTE/RTC Food Products
- 3.1.11 Snacks
- 3.1.12 Sport/Performance Nutrition
- 3.1.13 Animal Feed
- 3.1.14 Personal Care and Cosmetics
- 3.2 Protein Consumption Trends
- 3.2.1 Plant
- 3.3 Production Trends
- 3.3.1 Plant
- 3.4 Regulatory Framework
- 3.4.1 India
- 3.5 Value Chain & Distribution Channel Analysis
4 MARKET SEGMENTATION (includes market size in Value in USD and Volume, Forecasts up to 2030 and analysis of growth prospects)
- 4.1 Protein Type
- 4.1.1 Hemp Protein
- 4.1.2 Pea Protein
- 4.1.3 Potato Protein
- 4.1.4 Rice Protein
- 4.1.5 Soy Protein
- 4.1.6 Wheat Protein
- 4.1.7 Other Plant Protein
- 4.2 End User
- 4.2.1 Animal Feed
- 4.2.2 Food and Beverages
- 4.2.2.1 By Sub End User
- 4.2.2.1.1 Bakery
- 4.2.2.1.2 Beverages
- 4.2.2.1.3 Breakfast Cereals
- 4.2.2.1.4 Condiments/Sauces
- 4.2.2.1.5 Confectionery
- 4.2.2.1.6 Dairy and Dairy Alternative Products
- 4.2.2.1.7 Meat/Poultry/Seafood and Meat Alternative Products
- 4.2.2.1.8 RTE/RTC Food Products
- 4.2.2.1.9 Snacks
- 4.2.3 Personal Care and Cosmetics
- 4.2.4 Supplements
- 4.2.4.1 By Sub End User
- 4.2.4.1.1 Baby Food and Infant Formula
- 4.2.4.1.2 Elderly Nutrition and Medical Nutrition
- 4.2.4.1.3 Sport/Performance Nutrition
5 COMPETITIVE LANDSCAPE
- 5.1 Key Strategic Moves
- 5.2 Market Share Analysis
- 5.3 Company Landscape
- 5.4 Company Profiles (includes Global Level Overview, Market Level Overview, Core Business Segments, Financials, Headcount, Key Information, Market Rank, Market Share, Products and Services, and Analysis of Recent Developments).
- 5.4.1 Archer Daniels Midland Company
- 5.4.2 Cargill, Incorporated
- 5.4.3 Ingredion Incorporated
- 5.4.4 International Flavors & Fragrances, Inc.
- 5.4.5 Kerry Group PLC
- 5.4.6 Roquette Frere
- 5.4.7 Sudzucker AG
- 5.4.8 VIPPY INDUSTRIES LIMITED
6 KEY STRATEGIC QUESTIONS FOR PROTEIN INGREDIENTS INDUSTRY CEOS
7 APPENDIX
- 7.1 Global Overview
- 7.1.1 Overview
- 7.1.2 Porter's Five Forces Framework
- 7.1.3 Global Value Chain Analysis
- 7.1.4 Market Dynamics (DROs)
- 7.2 Sources & References
- 7.3 List of Tables & Figures
- 7.4 Primary Insights
- 7.5 Data Pack
- 7.6 Glossary of Terms
