
|
市場調査レポート
商品コード
1693523
微量栄養素肥料:市場シェア分析、産業動向と統計、成長予測(2025年~2030年)Micronutrient Fertilizer - Market Share Analysis, Industry Trends & Statistics, Growth Forecasts (2025 - 2030) |
||||||
カスタマイズ可能
適宜更新あり
|
|||||||
| 微量栄養素肥料:市場シェア分析、産業動向と統計、成長予測(2025年~2030年) |
|
出版日: 2025年03月18日
発行: Mordor Intelligence
ページ情報: 英文 340 Pages
納期: 2~3営業日
|

全表示
- 概要
- 目次
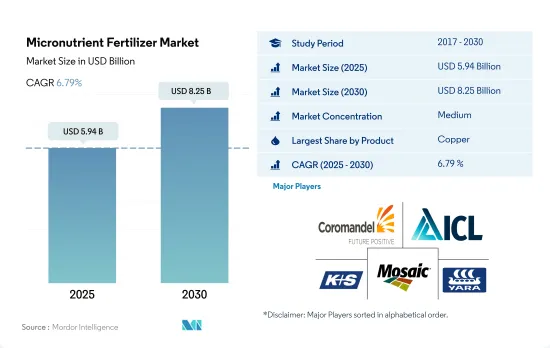
微量栄養素肥料の市場規模は2025年に59億4,000万米ドルと推定され、2030年には82億5,000万米ドルに達すると予測され、予測期間中(2025~2030年)のCAGRは6.79%で成長すると予測されます。
土壌における微量栄養素欠乏症の増加が微量栄養素肥料市場の成長を促進すると予想される
- 微量栄養素は、細胞壁形成、花粉形成、発芽、クロロフィル生産、窒素固定、タンパク質の必須部分の合成など、多くの植物代謝活動において重要な役割を果たしています。世界の微量栄養素肥料の市場規模は、2023~2030年の間にCAGR 6.6%を記録すると予想されています。
- 2022年の微量栄養素肥料の世界市場において、亜鉛は26.6%のシェアを占めています。亜鉛肥料の金額シェアのうち、従来型亜鉛肥料は約87.5%、特殊亜鉛肥料は約12.5%です。特殊亜鉛肥料は従来の肥料に比べ、作物に均一に分布し、即効性があるという利点があります。
- アジア太平洋が世界市場を独占し、2022年の市場規模シェアの33.3%を占めました。微量栄養素肥料の流通網はアジア太平洋の主要国で確立されており、この地域の様々な微量栄養素肥料製品の市場をさらに押し上げています。食用穀物需要の増加と土壌中の栄養素の減少が、この地域の市場成長を促進する主要因のひとつです。最近の研究では、亜鉛欠乏症が中国で最も蔓延している微量栄養素欠乏症であることが示されています。耕作可能な土壌の50.0%以上が亜鉛不足であり、農業成長と人間の栄養改善を制限しています。
- 世界的に広範な微量栄養素の欠乏は、植物の健康に対する関心が高まっており、植物と土壌の健康を高めるために微量栄養素の使用を改善するよう、様々な政府機関やその他の組織から奨励されるようになっていることも相まって、市場の成長を促進しています。
微量栄養素欠乏症の増加が微量栄養素肥料の需要を増加させる
- 微量栄養素肥料の世界市場は調査期間中安定した成長率で推移し、2022年の市場規模は57億米ドルでした。アジア太平洋は2022年に38.8%の最大市場シェアを占め、欧州と北米がこれに続きます。
- インドや中国といった国々は主要な微量栄養素肥料市場であり、2022年の市場シェアのそれぞれ13.9%と10.5%を占めています。中国の作物における微量栄養素欠乏症の増加は、2022年の微量栄養素肥料の消費量の31.4%をもたらしました。中国農業省(MoA)は、15~30 ZnSO4 kg/haの亜鉛を全国推奨肥料に追加し、最近、コメやトウモロコシなどの夏作物用に拡大しました。
- フランスは欧州における微量栄養素肥料の主要市場であり、次いでウクライナで、2022年の市場規模は2億1,840万米ドルです。園芸作物の栽培面積は、2017年の1,740万ヘクタールから2022年には1,560万ヘクタールに減少します。しかし、この数字は次の年にはさらに増加すると予想されます。
- アジアを除けば、サハラ以南のアフリカと南米北西部では、土壌中の亜鉛と鉄の欠乏がかなり広がっています。微量栄養素肥料の総合的な利点は広く受け入れられ、認識されつつあります。2021年の亜鉛の世界輸出額は160万米ドルで、微量栄養素の輸出国トップはオランダの27万5,600米ドルでした。
- この市場が成長しているのは、世界中で微量栄養素の欠乏が蔓延しており、鉄と亜鉛の欠乏が植物の健康に対する懸念が高まっているためであり、また、様々な政府機関から微量栄養素の使用を増やすよう奨励されるようになっているためです。
世界の微量栄養素肥料の動向
増大する食糧需要を満たすための農業産業への圧力の高まりは、畑作物の栽培面積を増加させると予想されます。
- 世界の農業部門は現在、多くの課題に直面しています。国連によると、世界人口は2050年までに90億人を超える可能性があります。この人口増加は、すでに労働力不足と都市化の進展による農地の縮小で生産高が減少している農業に過大な負担をかける可能性があります。国連食糧農業機関によると、2050年までに世界人口の70%が都市に住むようになると予想されています。世界的に耕地が減少しているため、農業従事者は作物の収穫量を増やすために、より多くの肥料を利用する必要があります。
- アジア太平洋は世界最大の農産物生産地です。農業はこの地域の経済にとって不可欠であり、全労働人口の約20%を雇用しています。畑作物の栽培がこの地域を支配しており、この地域の全作物栽培面積の約95%以上を占めています。米、小麦、トウモロコシがこの地域で生産される主要な畑作物で、2022年の総栽培面積の約24.3%を占めます。
- 北米は世界第2位の耕作可能地域です。その農場では、畑作物を中心に多様な作物が栽培されています。特に、トウモロコシ、綿花、米、大豆、小麦は、米国農務省が強調しているように、著名な畑作物です。2022年、米国は北米の作物栽培面積の46.2%を占めていました。しかし、同国は2017~2019年にかけて作物栽培面積の大幅な減少を目の当たりにしたが、これは主にテキサスやヒューストンのような地域で深刻な洪水につながる悪環境条件のためでした。
アジア太平洋は、5.20kg/ヘクタールという最も高い平均微量栄養素施用率を占めました。
- 高収量作物からの養分損失率が高いため、微量栄養素の需要が大幅に増加しています。微量栄養素の欠乏は、世界中のほぼすべての地域に影響を及ぼす問題です。世界的に見て、2022年の畑作物への微量栄養素の平均施用量は3.92kg/ヘクタールでした。したがって、マンガン、亜鉛、銅は、2022年の畑作物における施用率がより高い主要栄養素と推定され、それぞれ9.53kg/ha、6.63kg/ha、6.34kg/haを占めます。
- 2022年の平均微量栄養素施用量が最も多いのは菜種/カノーラで5.20kg/ha、次いでイネが4.42kg/ha、ソルガムが4.37kg/haでした。作物や地域によって、微量栄養素に対する反応は異なります。例えば、小麦では銅とマンガンの欠乏が一般的であるが、ホウ素の欠乏は小麦で観察され、モリブデンはアジア太平洋で欠乏しています。菜種/カノーラでは、亜鉛、マンガン、銅が主要欠乏症です。
- 2022年の微量栄養素の平均施用量は、アジア太平洋が5.20kg/haで最も多く、次いで南米が4.37kg/ha、北米が4.21kg/haでした。作物生産における微量栄養素の使用は、農業従事者が作付けヘクタールあたりの収量を増やそうと努力しているため、近年大幅に増加しています。土壌の健全性と作物の生産性を向上させ、増加する人口を満足させるためには、作物の収量を増やして食糧生産需要を満たす必要があります。その結果、微量栄養素肥料の世界の需要と農業生産が最も顕著に増加しています。
微量栄養素肥料の産業概要
微量栄養素肥料市場は適度に統合されており、上位5社で57.38%を占めています。この市場の主要企業は、Coromandel International Ltd.、ICL Group Ltd、K+S Aktiengesellschaft、The Mosaic Company、Yara International ASAなどです。
その他の特典
- エクセル形式の市場予測(ME)シート
- 3ヶ月のアナリストサポート
目次
第1章 エグゼクティブサマリーと主要調査結果
第2章 レポートのオファー
第3章 イントロダクション
- 調査の前提条件と市場定義
- 調査範囲
- 調査手法
第4章 主要産業動向
- 主要作物の作付面積
- 畑作物
- 園芸作物
- 平均養分施用率
- 微量栄養素
- 畑作物
- 園芸作物
- 微量栄養素
- 灌漑設備のある農地
- 規制の枠組み
- バリューチェーンと流通チャネル分析
第5章 市場セグメンテーション
- 製品
- ホウ素
- 銅
- 鉄
- マンガン
- モリブデン
- 亜鉛
- その他
- 適用方法
- 施肥
- 葉面散布
- 土壌
- 作物タイプ
- 畑作物
- 園芸作物
- 芝・観賞用
- 地域
- アジア太平洋
- オーストラリア
- バングラデシュ
- 中国
- インド
- インドネシア
- 日本
- パキスタン
- フィリピン
- タイ
- ベトナム
- その他のアジア太平洋
- 欧州
- フランス
- ドイツ
- イタリア
- オランダ
- ロシア
- スペイン
- ウクライナ
- 英国
- その他の欧州
- 中東・アフリカ
- ナイジェリア
- サウジアラビア
- 南アフリカ
- トルコ
- その他の中東・アフリカ
- 北米
- カナダ
- メキシコ
- 米国
- その他の北米地域
- 南米
- アルゼンチン
- ブラジル
- その他の南米
- アジア太平洋
第6章 競合情勢
- 主要な戦略動向
- 市場シェア分析
- 企業情勢
- 企業プロファイル
- BMS Micro-Nutrients NV
- Coromandel International Ltd.
- Haifa Group
- ICL Group Ltd
- K+S Aktiengesellschaft
- Koch Industries Inc.
- Nouryon
- The Mosaic Company
- Yara International ASA
第7章 CEOへの主要戦略的質問
第8章 付録
- 世界概要
- 概要
- ファイブフォース分析フレームワーク
- 世界のバリューチェーン分析
- 市場力学(DROs)
- 情報源と参考文献
- 図表一覧
- 主要な洞察
- データパック
- 用語集
The Micronutrient Fertilizer Market size is estimated at 5.94 billion USD in 2025, and is expected to reach 8.25 billion USD by 2030, growing at a CAGR of 6.79% during the forecast period (2025-2030).
The rising micronutrient deficiency in soil is expected to fuel the growth of the micronutrient fertilizer market
- Micronutrients play an important role in many plant metabolic activities, such as cell wall formation, pollen formation, germination, chlorophyll production, nitrogen fixation, and the synthesis of the essential parts of proteins. The global micronutrient fertilizer market value is anticipated to register a CAGR of 6.6% during 2023-2030.
- Zinc accounted for a major share of 26.6% of the global micronutrient fertilizer market value in 2022. Of the total value share held by zinc fertilizers, conventional zinc fertilizers accounted for about 87.5%, and specialty zinc fertilizers accounted for about 12.5%. Specialty zinc fertilizers have the advantage of uniform distribution and fast acting on crops compared to conventional fertilizers.
- The Asia-Pacific region dominated the global market, accounting for 33.3% of the market value share in 2022. The distribution network of micronutrient fertilizers is well-established in the major Asia-Pacific countries, further boosting the market for various micronutrient fertilizer products in the region. The increasing demand for food grains, coupled with decreasing nutrients in the soil, is one of the major factors driving the growth of the market in the region. Recent studies have indicated that zinc deficiency is China's most widespread micronutrient deficiency. More than 50.0% of the arable soils are low in zinc, thereby limiting agricultural growth and improvement in human nutrition.
- Widespread micronutrient deficiencies worldwide are becoming a rising concern for plant health, coupled with increasing encouragement from various government agencies and other organizations to improve the use of micronutrients to enhance plant and soil health, which is driving the growth of the market.
The increase in micronutrient deficiencies increases the demand for micronutrient fertilizers
- The global micronutrient fertilizer market grew at a stable rate during the study period, with a value of USD 5.70 billion in 2022. Asia-Pacific occupied the largest market share of 38.8% in 2022, followed by Europe and North America.
- Countries such as India and China are the major micronutrient fertilizer markets, accounting for 13.9% and 10.5% of the market share in 2022, respectively. The increase in micronutrient deficiency in Chinese crops resulted in 31.4% of micronutrient fertilizer consumption in 2022. The Ministry of Agriculture (MoA) of China added zinc, at a rate of 15-30 ZnSO4 kg/ha, to its national fertilizer recommendation, which was recently extended for summer crops like rice and corn.
- France is the major market for micronutrient fertilizer in Europe, followed by Ukraine, with a market value of USD 218.4 million in 2022. The area under the cultivation of horticultural crops decreased from 17.4 million hectares in 2017 to 15.6 million hectares in 2022. However, the figure is expected to increase further in the following years.
- Apart from Asia, zinc and iron deficiency in the soil is quite widespread in Sub-Saharan Africa and northwest South America. The overall advantages of micronutrient fertilizers are being widely accepted and recognized. The global export value of zinc in 2021 amounted to USD 1.6 million, with the Netherlands as the top exporter of the micronutrients, with a value of USD 275.6 thousand.
- The market is growing because of the widespread micronutrient deficiencies around the world, with iron and zinc deficiencies becoming a rising concern for plant health, and also due to the increasing encouragement from various government agencies to increase the use of micronutrients.
Global Micronutrient Fertilizer Market Trends
The rising pressure on the agriculture industry to meet the growing demand for food is expected to increase the area under field crop cultivation
- The global agricultural sector is currently facing many challenges. According to the UN, the world population may exceed 9 billion by 2050. This population growth may overburden the agricultural industry, which is already experiencing an output loss due to a lack of laborers and the shrinkage of agricultural fields caused by rising urbanization. According to the Food and Agriculture Organization, 70% of the global population is expected to live in cities by 2050. Due to the global loss of arable land, farmers now need to utilize more fertilizers to increase crop yields.
- The Asia-Pacific region is the world's largest producer of agricultural products. Agriculture is critical to the region's economy, as it employs about 20% of the total available workforce. Field crop cultivation dominates the region, accounting for about more than 95% of the total crop area in the region. Rice, wheat, and corn are the major field crops produced in the region, together accounting for about 24.3% of the total crop area in 2022.
- North America ranks as the second-largest arable region globally. Its farms cultivate a diverse range of crops, with a focus on field crops. Notably, corn, cotton, rice, soybean, and wheat are the prominent field crops, as highlighted by the USDA. In 2022, the United States commanded 46.2% of North America's crop cultivation area. However, the country witnessed a significant drop in crop acreage between 2017 and 2019, primarily due to adverse environmental conditions, leading to severe flooding in regions like Texas and Houston.
The Asia-Pacific region accounted for the highest average micronutrient application rate of 5.20 kg/hectare
- Due to high rates of nutrient loss from high-yielding crops, the demand for micronutrients has risen significantly. Micronutrient deficiency is a problem that affects almost all regions across the world. Globally, the average micronutrient application in field crops was 3.92 kg/hectare in 2022. Accordingly, manganese, zinc, and copper were estimated to be major nutrients with higher application rates in field crops in 2022, accounting for 9.53 kg/ha, 6.63 kg/ha, and 6.34 kg/ha, respectively.
- Rapeseed/canola led the pack with the highest average micronutrient application of 5.20 kg/ha in 2022, followed by rice and sorghum at 4.42 kg/ha and 4.37 kg/ha, respectively. Different crops and regions respond differently to micronutrients. For example, copper and manganese deficiencies are common in wheat, while boron deficiency is observed in wheat, and molybdenum is lacking in the Asia-Pacific region. In rapeseed/canola, zinc, manganese, and copper are the primary deficiencies.
- In 2022, Asia-Pacific had the highest average micronutrient application rate of 5.20 kg/ha, followed by South America with 4.37 kg/ha and North America with 4.21kg/ha. Micronutrient use in crop production has increased significantly in recent years as farmers strive to increase yield per planted hectare. To improve soil health and crop productivity and satisfy a growing population, crop yields must increase to meet food production demands. As a result, the global demand for micronutrient fertilizers and agricultural production is experiencing the most significant rise.
Micronutrient Fertilizer Industry Overview
The Micronutrient Fertilizer Market is moderately consolidated, with the top five companies occupying 57.38%. The major players in this market are Coromandel International Ltd., ICL Group Ltd, K+S Aktiengesellschaft, The Mosaic Company and Yara International ASA (sorted alphabetically).
Additional Benefits:
- The market estimate (ME) sheet in Excel format
- 3 months of analyst support
TABLE OF CONTENTS
1 EXECUTIVE SUMMARY & KEY FINDINGS
2 REPORT OFFERS
3 INTRODUCTION
- 3.1 Study Assumptions & Market Definition
- 3.2 Scope of the Study
- 3.3 Research Methodology
4 KEY INDUSTRY TRENDS
- 4.1 Acreage Of Major Crop Types
- 4.1.1 Field Crops
- 4.1.2 Horticultural Crops
- 4.2 Average Nutrient Application Rates
- 4.2.1 Micronutrients
- 4.2.1.1 Field Crops
- 4.2.1.2 Horticultural Crops
- 4.2.1 Micronutrients
- 4.3 Agricultural Land Equipped For Irrigation
- 4.4 Regulatory Framework
- 4.5 Value Chain & Distribution Channel Analysis
5 MARKET SEGMENTATION (includes market size in Value in USD and Volume, Forecasts up to 2030 and analysis of growth prospects)
- 5.1 Product
- 5.1.1 Boron
- 5.1.2 Copper
- 5.1.3 Iron
- 5.1.4 Manganese
- 5.1.5 Molybdenum
- 5.1.6 Zinc
- 5.1.7 Others
- 5.2 Application Mode
- 5.2.1 Fertigation
- 5.2.2 Foliar
- 5.2.3 Soil
- 5.3 Crop Type
- 5.3.1 Field Crops
- 5.3.2 Horticultural Crops
- 5.3.3 Turf & Ornamental
- 5.4 Region
- 5.4.1 Asia-Pacific
- 5.4.1.1 Australia
- 5.4.1.2 Bangladesh
- 5.4.1.3 China
- 5.4.1.4 India
- 5.4.1.5 Indonesia
- 5.4.1.6 Japan
- 5.4.1.7 Pakistan
- 5.4.1.8 Philippines
- 5.4.1.9 Thailand
- 5.4.1.10 Vietnam
- 5.4.1.11 Rest of Asia-Pacific
- 5.4.2 Europe
- 5.4.2.1 France
- 5.4.2.2 Germany
- 5.4.2.3 Italy
- 5.4.2.4 Netherlands
- 5.4.2.5 Russia
- 5.4.2.6 Spain
- 5.4.2.7 Ukraine
- 5.4.2.8 United Kingdom
- 5.4.2.9 Rest of Europe
- 5.4.3 Middle East & Africa
- 5.4.3.1 Nigeria
- 5.4.3.2 Saudi Arabia
- 5.4.3.3 South Africa
- 5.4.3.4 Turkey
- 5.4.3.5 Rest of Middle East & Africa
- 5.4.4 North America
- 5.4.4.1 Canada
- 5.4.4.2 Mexico
- 5.4.4.3 United States
- 5.4.4.4 Rest of North America
- 5.4.5 South America
- 5.4.5.1 Argentina
- 5.4.5.2 Brazil
- 5.4.5.3 Rest of South America
- 5.4.1 Asia-Pacific
6 COMPETITIVE LANDSCAPE
- 6.1 Key Strategic Moves
- 6.2 Market Share Analysis
- 6.3 Company Landscape
- 6.4 Company Profiles
- 6.4.1 BMS Micro-Nutrients NV
- 6.4.2 Coromandel International Ltd.
- 6.4.3 Haifa Group
- 6.4.4 ICL Group Ltd
- 6.4.5 K+S Aktiengesellschaft
- 6.4.6 Koch Industries Inc.
- 6.4.7 Nouryon
- 6.4.8 The Mosaic Company
- 6.4.9 Yara International ASA
7 KEY STRATEGIC QUESTIONS FOR FERTILIZER CEOS
8 APPENDIX
- 8.1 Global Overview
- 8.1.1 Overview
- 8.1.2 Porter's Five Forces Framework
- 8.1.3 Global Value Chain Analysis
- 8.1.4 Market Dynamics (DROs)
- 8.2 Sources & References
- 8.3 List of Tables & Figures
- 8.4 Primary Insights
- 8.5 Data Pack
- 8.6 Glossary of Terms

