
|
市場調査レポート
商品コード
1693500
米国の微量栄養素肥料:市場シェア分析、産業動向・統計、成長予測(2025年~2030年)United States Micronutrient Fertilizer - Market Share Analysis, Industry Trends & Statistics, Growth Forecasts (2025 - 2030) |
||||||
カスタマイズ可能
適宜更新あり
|
|||||||
| 米国の微量栄養素肥料:市場シェア分析、産業動向・統計、成長予測(2025年~2030年) |
|
出版日: 2025年03月18日
発行: Mordor Intelligence
ページ情報: 英文 177 Pages
納期: 2~3営業日
|

全表示
- 概要
- 目次
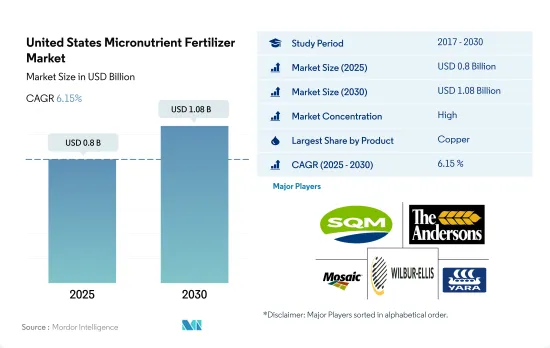
米国の微量栄養素肥料の市場規模は2025年に8億米ドルと推計され、2030年には10億8,000万米ドルに達すると予測され、予測期間(2025-2030年)のCAGRは6.15%で成長すると予測されます。
土壌欠乏症の拡大とバランスの取れた栄養の必要性が市場の成長を促進すると予測される
- 土壌養分の欠乏と、それが作物の健康と収量に与える影響に関する農家の意識が、米国における微量栄養素の需要増加を促進しています。
- 亜鉛は微量栄養素肥料市場の支配的プレイヤーとして台頭し、2022年の市場総額の約27.3%を占める。2023年から2030年までのCAGRは5.2%と予測されています。特に、亜鉛欠乏症はワシントン果樹園、トウモロコシ、小麦で蔓延しており、成長阻害や葉の障害につながっています。その結果、生産者はますます亜鉛肥料に目を向けるようになっています。
- ほとんどの農作物では、さまざまな環境要因や土壌要因によって植物への鉄の供給が制限されています。この欠乏が鉄肥料市場の成長を促進し、2023年から2030年までのCAGRは3.9%と予測されています。
- 銅は植物の酵素活動、葉緑素合成、種子生産に不可欠です。小麦、大麦、オート麦、野菜のような畑作物は特に銅欠乏の影響を受けやすいです。米国では畑作物が農業の大半を占めていることから、この分野の銅肥料の市場価値は2023-2030年に3.7%のCAGRで推移すると予想されています。
- 微量栄養素は、細胞壁の形成、花粉の形成、発芽、葉緑素の生産、窒素固定、タンパク質の必須部分の合成など、多くの植物の代謝活動で重要な役割を果たしています。微量栄養素の肥料は必要な量は少ないが、バランスのとれた作物栄養には重要です。従って、微量栄養素肥料の市場価値は、2023年から2030年の間にCAGR 4.0%を記録すると予想されます。
米国の微量栄養素肥料の市場動向
米国では大豆とトウモロコシが2大作物として栽培されている
- 米国では、人口が2020年の3億3,590万人から2022年には3億3,820万人に増加しました。2000年以降、農地の総面積は5,000万エーカー近く減少し、2022年時点では8億9,340万エーカーに達します。農地が限られているということは、農業投入物を使用して農業生産性を高める必要があることを示しています。作物の生産性を高めるために、肥料は長い間使用されてきました。米国の4大作物は、トウモロコシ、綿花、大豆、小麦であり、2022年の主要作物作付面積の65.7%以上を占める。
- 大豆とトウモロコシは米国で栽培されている2大作物です。2022年には大豆の栽培面積が最も多く、米国の耕地面積の25.8%を占め、次いでトウモロコシが25.7%、小麦が11.1%です。これらの作物の大部分は、インディアナ西部、イリノイ州、アイオワ州、ミズーリ州、ネブラスカ州東部、カンザス州東部をカバーする「コーンベルト」と呼ばれる地域で栽培されています。トウモロコシと大豆の生産がこの地域を支配しています。米国農務省によれば、米国は米の主要輸出国であり、その栽培の大部分は4つの地域で行われています。
- 農業資材メーカーは、農家の正確な肥料散布を支援するために技術革新を行っています。これは栽培コストを削減するだけでなく、効率も向上させる。米国の畑作分野は、大きな市場の可能性を秘めています。政府からの資金援助や支援の増加と相まって、積極的な成長が見込まれています。
微量栄養素は、作物が生物学的および生物学的ストレスに対抗できるようにする上で極めて重要です。
- 微量栄養素は植物の成長に必要であり、作物の栄養において重要な役割を果たします。微量栄養素肥料には、ホウ素、銅、マンガン、亜鉛、コバルトなど、植物が微量に必要とする元素が含まれています。作物が必要とする微量栄養素は、米国各地の土壌条件によって異なります。ホウ素の欠乏は、有機物が少なく溶出しやすい南東部の砂質土壌でよく見られます。
- 米国では、畑作物への微量栄養素の平均施用量は、1ヘクタール当たり4.2kgです。マンガンは、2022年には1ヘクタール当たり11.0kgの施用量となり、大豆、小麦、サトウキビ、トウモロコシといった主要な畑作物の生産性を高めるために極めて重要です。その結果、マンガンが微量栄養素肥料市場を独占し、2022年の総消費量の33.0%を占める。マンガンに続き、銅と亜鉛の施用量はそれぞれ1ヘクタール当たり7.2kgと6.7kgです。これらの微量栄養素は、作物が生物学的および生物学的ストレスに対抗できるようにする上で極めて重要であり、人工的な手段によってその欠乏に対処することの重要性を強調しています。
- 2022年には、畑作物分野が大きなシェアを占め、微量栄養素肥料市場全体に金額で87.6%、数量で87.5%寄与しました。これらの作物の中では、大豆が1ヘクタール当たり4.5kgの施用率でトップでした。持続可能な農法へのシフトと、作物の適切な成長のために土壌中の微量栄養素レベルを維持する必要性が、2023~2030年の米国微量栄養素肥料市場の成長を促進すると予想されます。
米国の微量栄養素肥料産業の概要
米国の微量栄養素肥料市場はかなり統合されており、上位5社で84.13%を占めています。この市場の主要企業は以下の通り。 Sociedad Quimica y Minera de Chile SA, The Andersons Inc., The Mosaic Company, Wilbur-Ellis Company LLC and Yara International ASA(アルファベット順)
その他の特典
- エクセル形式の市場予測(ME)シート
- 3ヶ月のアナリストサポート
目次
第1章 エグゼクティブサマリーと主な調査結果
第2章 レポートのオファー
第3章 イントロダクション
- 調査の前提条件と市場定義
- 調査範囲
- 調査手法
第4章 主要産業動向
- 主要作物の作付面積
- 畑作物
- 園芸作物
- 平均養分施用率
- 微量栄養素
- 畑作物
- 園芸作物
- 微量栄養素
- 灌漑設備のある農地
- 規制の枠組み
- バリューチェーンと流通チャネル分析
第5章 市場セグメンテーション
- 製品
- ホウ素
- 銅
- 鉄
- マンガン
- モリブデン
- 亜鉛
- その他
- 施肥モード
- 施肥
- 葉面散布
- 土壌
- 作物タイプ
- 畑作物
- 園芸作物
- 芝・観賞用
第6章 競合情勢
- 主要な戦略動向
- 市場シェア分析
- 企業情勢
- 企業プロファイル
- Haifa Group
- Koch Industries Inc.
- Nouryon
- Sociedad Quimica y Minera de Chile SA
- The Andersons Inc.
- The Mosaic Company
- Wilbur-Ellis Company LLC
- Yara International ASA
第7章 CEOへの主な戦略的質問
第8章 付録
- 世界概要
- 概要
- ファイブフォース分析フレームワーク
- 世界のバリューチェーン分析
- 市場力学(DROs)
- 情報源と参考文献
- 図表一覧
- 主要洞察
- データパック
- 用語集
The United States Micronutrient Fertilizer Market size is estimated at 0.8 billion USD in 2025, and is expected to reach 1.08 billion USD by 2030, growing at a CAGR of 6.15% during the forecast period (2025-2030).
The growing soil deficiency and the need for balanced nutrition is anticipated to drive the growth of the market
- The awareness among farmers regarding soil nutrient deficiencies and their impact on crop health and yields is driving the rising demand for micronutrients in the United States.
- Zinc emerged as the dominant player in the micronutrient fertilizer market, accounting for approximately 27.3% of the total market value in 2022. It is projected to witness a CAGR of 5.2% from 2023 to 2030. Notably, zinc deficiency is prevalent in Washington orchards, maize, and wheat, leading to stunted growth and leaf disorders. Consequently, growers are increasingly turning to zinc fertilizers.
- In most agricultural crops, various environmental and soil factors limit the availability of iron to plants. This scarcity is expected to fuel the growth of the iron fertilizers market, which is projected to register a CAGR of 3.9% from 2023 to 2030.
- Copper is vital for enzymatic activities, chlorophyll synthesis, and seed production in plants. Field crops like wheat, barley, oats, and vegetables are particularly susceptible to copper deficiency. Given that field crops dominate the agricultural landscape in the United States, the market value of copper fertilizers in this segment is anticipated to register a CAGR of 3.7% during 2023-2030.
- Micronutrients play an important role in many plant metabolic activities, such as cell wall formation, pollen formation, germination, chlorophyll production, nitrogen fixation, and synthesis of essential parts of proteins. Even though micronutrient fertilizers are required in less quantity, they are important for balanced crop nutrition. Hence, the micronutrient fertilizer market's value is anticipated to register a CAGR of 4.0% during 2023-2030.
United States Micronutrient Fertilizer Market Trends
Soybean and corn are the two largest crops grown in the United States
- In the United States, the population increased from 335.9 million in 2020 to 338.2 million in 2022. From 2000 onward, the total farmland area has decreased by almost 50 million acres, reaching a total of 893.4 million acres, as of 2022. The limited farmland indicates the need to increase agricultural productivity with the use of agri inputs. Fertilizers have been used for a long time to increase the productivity of crops. The four major crops in the United States are corn, cotton, soybean, and wheat, which accounted for more than 65.7% of the principal crop acreage in 2022.
- Soybean and corn are the two largest crops grown in the United States. In 2022, soybean had the highest area under cultivation, accounting for 25.8% of the total arable land in the United States, followed by corn at 25.7% and wheat at 11.1%. The majority of these crops are grown in a region known as the "Corn Belt," which covers western Indiana, Illinois, Iowa, Missouri, eastern Nebraska, and Eastern Kansas. The production of corn (maize) and soybeans dominates this area. Additionally, the United States is a major exporter of rice, with most of the cultivation happening in four regions, three of which are in the South and one in California, according to the USDA.
- Manufacturers of farm inputs are innovating to aid farmers in precise fertilizer application. This not only trims cultivation costs but also bolsters efficiency. The field crop sector in the United States holds substantial market potential. Coupled with increased government funding and support, it is poised for positive growth.
Micronutrients are pivotal in equipping crops to combat both biotic and abiotic stresses
- Micronutrients are necessary for plant growth and play a critical role in crop nutrition. Micronutrient fertilizers contain trace amounts of elements such as boron, copper, manganese, zinc, and cobalt, which plants require in small amounts. Micronutrient requirements by the crop vary depending on the soil condition across the United States. Boron deficiency is more common in sandy soils of the southeast, which are low in organic matter content and more susceptible to leaching.
- In the United States, the average application rate for micronutrients in field crops stands at 4.2 kg per hectare. Manganese, with an application rate of 11.0 kg per hectare in 2022, is crucial for boosting the productivity of key field crops such as soybean, wheat, sugarcane, and maize. As a result, manganese dominates the micronutrient fertilizer market, accounting for 33.0% of the total consumption in 2022. Following manganese, copper and zinc have application rates of 7.2 and 6.7 kg per hectare, respectively. These micronutrients are pivotal in equipping crops to combat both biotic and abiotic stresses, underscoring the importance of addressing their deficiencies through artificial means.
- In 2022, the field crops segment held the lion's share, contributing 87.6% in value and 87.5% in volume to the overall micronutrient fertilizer market. Among these crops, soybean led the pack with an application rate of 4.5 kg per hectare. The shifting focus toward sustainable methods of farming and the need to maintain micronutrient levels in the soil for the proper growth of crops are expected to drive the US micronutrient fertilizers market's growth during 2023-2030.
United States Micronutrient Fertilizer Industry Overview
The United States Micronutrient Fertilizer Market is fairly consolidated, with the top five companies occupying 84.13%. The major players in this market are Sociedad Quimica y Minera de Chile SA, The Andersons Inc., The Mosaic Company, Wilbur-Ellis Company LLC and Yara International ASA (sorted alphabetically).
Additional Benefits:
- The market estimate (ME) sheet in Excel format
- 3 months of analyst support
TABLE OF CONTENTS
1 EXECUTIVE SUMMARY & KEY FINDINGS
2 REPORT OFFERS
3 INTRODUCTION
- 3.1 Study Assumptions & Market Definition
- 3.2 Scope of the Study
- 3.3 Research Methodology
4 KEY INDUSTRY TRENDS
- 4.1 Acreage Of Major Crop Types
- 4.1.1 Field Crops
- 4.1.2 Horticultural Crops
- 4.2 Average Nutrient Application Rates
- 4.2.1 Micronutrients
- 4.2.1.1 Field Crops
- 4.2.1.2 Horticultural Crops
- 4.2.1 Micronutrients
- 4.3 Agricultural Land Equipped For Irrigation
- 4.4 Regulatory Framework
- 4.5 Value Chain & Distribution Channel Analysis
5 MARKET SEGMENTATION (includes market size in Value in USD and Volume, Forecasts up to 2030 and analysis of growth prospects)
- 5.1 Product
- 5.1.1 Boron
- 5.1.2 Copper
- 5.1.3 Iron
- 5.1.4 Manganese
- 5.1.5 Molybdenum
- 5.1.6 Zinc
- 5.1.7 Others
- 5.2 Application Mode
- 5.2.1 Fertigation
- 5.2.2 Foliar
- 5.2.3 Soil
- 5.3 Crop Type
- 5.3.1 Field Crops
- 5.3.2 Horticultural Crops
- 5.3.3 Turf & Ornamental
6 COMPETITIVE LANDSCAPE
- 6.1 Key Strategic Moves
- 6.2 Market Share Analysis
- 6.3 Company Landscape
- 6.4 Company Profiles
- 6.4.1 Haifa Group
- 6.4.2 Koch Industries Inc.
- 6.4.3 Nouryon
- 6.4.4 Sociedad Quimica y Minera de Chile SA
- 6.4.5 The Andersons Inc.
- 6.4.6 The Mosaic Company
- 6.4.7 Wilbur-Ellis Company LLC
- 6.4.8 Yara International ASA
7 KEY STRATEGIC QUESTIONS FOR FERTILIZER CEOS
8 APPENDIX
- 8.1 Global Overview
- 8.1.1 Overview
- 8.1.2 Porter's Five Forces Framework
- 8.1.3 Global Value Chain Analysis
- 8.1.4 Market Dynamics (DROs)
- 8.2 Sources & References
- 8.3 List of Tables & Figures
- 8.4 Primary Insights
- 8.5 Data Pack
- 8.6 Glossary of Terms
