
南米の微量栄養素肥料:市場シェア分析、産業動向、成長予測(2025年~2030年)
South America Micronutrient Fertilizer - Market Share Analysis, Industry Trends & Statistics, Growth Forecasts (2025 - 2030)- 発行日
- ページ情報
- 英文 196 Pages
- 納期
- 2~3営業日
- 商品コード
- 1693536
- カスタマイズ可能 お客様のご希望に応じて、既存データの加工や未掲載情報(例:国別セグメント)の追加などの対応が可能です。詳細はお問い合わせください。
- 適宜更新あり 本レポートは最新情報反映のため適宜更新し、内容構成変更を行う場合があります。ご検討の際はお問い合わせください。
- 翻訳ツール提供対象 PDF対応AI翻訳ツールの無料貸し出しサービスのご利用が可能です
概要
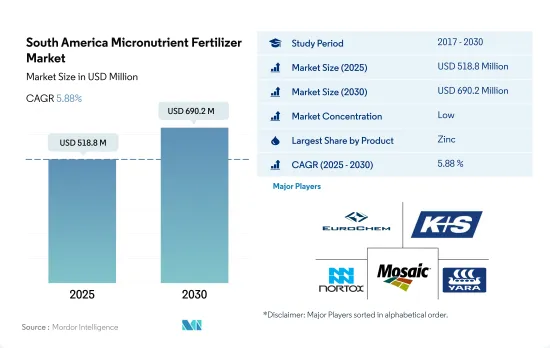
南米の微量栄養素肥料の市場規模は2025年に5億1,880万米ドルと推定・予測され、2030年には6億9,020万米ドルに達し、予測期間(2025~2030年)のCAGRは5.88%で成長すると予測されます。
作物収量を最適化するために欠乏症に対処する必要があるため、この地域では亜鉛の需要が高いです。
- 微量栄養素は、細胞壁の開発、花粉の生成、発芽、葉緑素の生産、窒素固定、タンパク質合成など、多くの植物の代謝活動に不可欠です。微量栄養素肥料は肥料市場全体の2%以下を占め、2022年には約5億4,770万米ドルに達しました。
- 微量栄養素肥料の中で、鉄は2022年にこの地域で最もよく使われる微量栄養素肥料の一つです。鉄は微量栄養素肥料市場全体の約8.5%を占め、2022年には約4,660万米ドルに達します。鉄は、エネルギー伝達、窒素の還元・固定、リグニン形成に関連する多くの酵素の成分です。
- 微量栄養素肥料としての亜鉛の用途は、鉄に次いでこの地域で最も高いです。亜鉛欠乏症はこの地域、特に南米北西部で広く問題となっています。亜鉛は微量栄養素肥料市場全体の約27.5%を占め、2022年には約1億5,050万米ドルに達します。
- 大豆と小麦の栽培は、この地域の農地全体の約61.13%を占めています。この2つの作物はマンガン欠乏症になる可能性が高いです。マンガンは2022年の微量栄養素肥料市場全体の約3.7%を占めます。
- ニッケル、コバルト、セレン、塩化物がその他の微量栄養素です。その他の微量栄養素セグメントは、この地域の微量栄養素肥料市場全体の11.8%を占め、2022年には約6,460万米ドルに達します。
- ほとんどの微量栄養素は土壌中で利用可能であるにもかかわらず、そのほとんどは性質上移動性がなく、植物が取り込むことができないです。したがって、微量栄養素肥料の需要はこの地域で増加しています。
土壌の栄養不足がブラジルの主要市場シェアにつながる
- ブラジルは南米の微量栄養素肥料市場を独占し、2022年には3億3,170万米ドルに達し、市場全体の約60.6%を占めました。ブラジルの微量栄養素肥料市場セグメントは、2017~2022年までに約14.8%増加した栽培面積の増加により、2030年末までに3億8,220万米ドルに増加すると予測されています。
- 2022年のアルゼンチンの微量栄養素肥料市場は、畑作物が97.7%の市場金額シェアを占めました。この優位性は、同国で畑作物が占める面積が大きいことに起因しています。アルゼンチンで栽培されている主要畑作物は大豆、小麦、トウモロコシで、これらを合わせると作物総面積の97.7%を占めます。一方、アルゼンチンの園芸作物による微量栄養素肥料の消費は、2022年に284万米ドルと評価され、2030年には390万米ドルに達すると予測されています。
- 施用タイプ別では、土壌施用が微量栄養素消費量の95.1%を占め、次いで2022年には潅水施用が2.5%、葉面施用が2.3%のシェアを占めます。
- 農業従事者は、高品質の農産物とより良い収量を達成するために、作物に微量栄養素肥料を採用しています。植物の成長に不可欠な微量栄養素が欠乏すると、作物の収量低下につながります。過去10年間で、主に亜鉛、ホウ素、モリブデンの土壌微量栄養素の欠乏が注目されました。亜鉛の土壌欠乏は、南米北西部で広く見られます。したがって、ブラジルの微量栄養素肥料市場は2023~2030年にかけて成長すると予想されます。
南米の微量栄養素肥料の市場動向
自給自足に向けた政府の取り組みが畑作物の栽培拡大に大きく貢献
- 南米における畑作物の栽培面積は、2017年の1億1,160万haから2022年には1億2,610万haへと12.8%の伸びを示しました。この耕作面積の拡大は、同地域の肥料需要を押し上げると予測されます。畑作物のシェアは96.8%と圧倒的です。2022年には、ブラジルが56.9%のシェアを占め、アルゼンチンが29.3%でこれに続きます。大豆生産と輸出の世界的リーダーとして知られるブラジルの大豆生産量は、2021年に1億3,500万トン近くに達しました。このうち82%にあたる1億550万トンが輸出され、その82%は生大豆、16%は大豆ケーキ、2%は大豆油です。
- 南米では、ブラジルとアルゼンチンが栽培面積の64.4%、26.1%を占め、大豆栽培の頂点に君臨しています。しかし、この地域は現在、長引く干ばつに悩まされており、主要河川の水位が驚くほど低くなっています。これは広範囲に影響を及ぼし、大豆を中心とする重要な夏作物の収穫と輸送の両方に支障をきたしています。その結果、この状況は南米における肥料散布量の増加の緊急性を高めています。
- 旺盛な世界需要と良好な収益性に後押しされ、メルコスール地域の大豆栽培は急増しています。大豆を含む原料価格の高騰は、生産者の事業拡大を促し、新しい土地や設備に投資して規模と効率を高めています。その結果、この地域は畑作物の栽培をさらに拡大する態勢を整え、国内市場と国際市場の両方の成長に合わせています。
2022年、微量栄養素の中で最も平均散布量が多いのはマンガンで、約12.2kg/ヘクタールです。
- 南米の土壌はオキソゾルとウルチゾルで占められています。オキソゾルは風化が進んでおり、質感が均一で、鉄やアルミニウムの酸化物が多いという特徴があり、ウルチゾルは風化は進んでいないが酸性が強いという対照的な土壌です。しかし、どちらの土壌タイプも、土壌中のほとんどの微量栄養素が不安定であることから、作物収量を最適化するためには微量栄養素の補給が必要です。南米では、微量栄養素の欠乏がますます年間作物生産を制限しています。イネ、トウモロコシ、コムギ、ダイズ、インゲンマメなどの作物で、亜鉛、銅、ホウ素、マンガン、鉄などの必須微量栄養素の欠乏が報告されています。
- 2022年、畑作における微量栄養素肥料の平均施用量は4.3kg/ヘクタールでした。これらの土壌には鉄が存在するにもかかわらず、過剰なリン酸塩との結合によって植物への利用が妨げられています。その結果、この地域の畑作物における鉄の平均施用量は3.3kg/ヘクタールとなっています。マンガンは、2022年の平均施用量が12.2kg/ヘクタールであり、微量栄養素の中ではトップです。マンガンは陸稲では一般的であるが、水浸条件下では溶解度が増すため、天水稲や低地稲ではあまり見られないです。マンガンが欠乏した稲は、生育不良、葉の枚数の減少、体重の減少、耕起期の根系の縮小を示します。
- 南米の主要な畑作物である菜種は、他の作物と比べてより多くの微量栄養素を必要とします。2022年の平均微量栄養素施肥量は4.40kg/ヘクタールに達しました。バランスの取れた作物栄養が重視されるようになり、全体的な収量において微量栄養素が極めて重要な役割を果たすことから、微量栄養素の施用は今後数年で増加すると予想されます。
南米の微量栄養素肥料産業の概要
南米の微量栄養素肥料市場は細分化されており、上位5社で28.08%を占めています。この市場の主要企業は、EuroChem Group、K+S Aktiengesellschaft、Nortox、The Mosaic Company、Yara International ASAなどです。
その他の特典
- エクセル形式の市場予測(ME)シート
- 3ヶ月のアナリストサポート
目次
第1章 エグゼクティブサマリーと主要調査結果
第2章 レポートのオファー
第3章 イントロダクション
- 調査の前提条件と市場定義
- 調査範囲
- 調査手法
第4章 主要産業動向
- 主要作物の作付面積
- 畑作物
- 園芸作物
- 平均養分施用率
- 微量栄養素
- 畑作物
- 園芸作物
- 微量栄養素
- 灌漑設備のある農地
- 規制の枠組み
- バリューチェーンと流通チャネル分析
第5章 市場セグメンテーション
- 製品
- ホウ素
- 銅
- 鉄
- マンガン
- モリブデン
- 亜鉛
- その他
- 適用方法
- 施肥
- 葉面散布
- 土壌
- 作物タイプ
- 畑作物
- 園芸作物
- 芝・観賞用
- 生産国
- アルゼンチン
- ブラジル
- その他の南米
第6章 競合情勢
- 主要な戦略動向
- 市場シェア分析
- 企業情勢
- 企業プロファイル
- BMS Micro-Nutrients NV
- EuroChem Group
- Grupa Azoty S.A.(Compo Expert)
- Haifa Group
- ICL Group Ltd
- Inquima LTDA
- K+S Aktiengesellschaft
- Nortox
- The Mosaic Company
- Yara International ASA
第7章 CEOへの主要戦略的質問
第8章 付録
- 世界概要
- 概要
- ファイブフォース分析フレームワーク
- 世界のバリューチェーン分析
- 市場力学(DROs)
- 情報源と参考文献
- 図表一覧
- 主要な洞察
- データパック
- 用語集
目次
Product Code: 92601
The South America Micronutrient Fertilizer Market size is estimated at 518.8 million USD in 2025, and is expected to reach 690.2 million USD by 2030, growing at a CAGR of 5.88% during the forecast period (2025-2030).
The demand for zinc is higher in the region due to the need to address deficiency to optimize crop yield
- Micronutrients are vital for many plant metabolic activities, such as cell wall development, pollen creation, germination, chlorophyll production, nitrogen fixation, and protein synthesis. Micronutrient fertilizers account for less than two percent of the total fertilizer market value, which amounted to about USD 547.7 million in 2022.
- Among micronutrient fertilizers, iron is one of the most commonly used micronutrient fertilizer in the region in 2022. Iron accounted for about 8.5% of the total micronutrient fertilizer market value, amounting to about USD 46.6 million in 2022. Iron is a component of many enzymes associated with energy transfer, nitrogen reduction and fixation, and lignin formation.
- The application of zinc as a micronutrient fertilizer is the highest in the region, after iron. Zinc deficiency is a widespread problem in the region, particularly in the northwestern region of South America. Zinc accounts for about 27.5% of the total micronutrient fertilizer market value, which amounted to about USD 150.5 million in 2022.
- Soybean and wheat cultivation accounts for about 61.13% of the total agricultural land in the region. These two crops are most likely to suffer from manganese deficiency. Manganese accounted for about 3.7% of the total micronutrient fertilizer market value in 2022.
- Nickel, cobalt, selenium, and chloride are the other micronutrients. The total other micronutrient segment accounts for 11.8% of the region's total micronutrient fertilizer market value, which amounted to about USD 64.6 million in 2022.
- Even though most micronutrients are available in soils, most are immobile in nature and not available for plant uptake. Hence, the demand for micronutrient fertilizers is increasing in the region.
Nutrient deficiencies in the country's soils translate to a major market share for Brazil
- Brazil dominated the South American micronutrient fertilizer market, accounting for about 60.6% of the total market value, amounting to USD 331.7 million in 2022. The Brazilian micronutrient fertilizer market segment is anticipated to increase to USD 382.2 million by the end of 2030, owing to the growing cultivation area, which increased by about 14.8% from 2017 to 2022.
- Field crops dominated the Argentine micronutrient fertilizer market with a 97.7% market value share in 2022. This dominance was attributed to the larger area occupied by field crops in the country. Major field crops grown in Argentina are soybean, wheat, and maize, which together account for 97.7% of the total crop area. Meanwhile, micronutrient fertilizers consumption by horticultural crops in Argentina was valued at USD 2.84 million in 2022 and is anticipated to reach USD 3.9 million by 2030.
- By application type, soil application dominated micronutrient consumption, accounting for 95.1% of the total volume, followed by fertigation with a 2.5% share and foliar application with a 2.3% share in 2022.
- Farmers are adopting micronutrient fertilizers for their crops to achieve high-quality produce and better yields. Deficiency in micronutrients that are essential for plant growth can lead to lower crop yields. During the past decade, soil micronutrient deficiencies were noticed primarily for zinc, boron, and molybdenum. Soil deficiencies of zinc are widespread in the northwestern region of South America. Hence, the micronutrient fertilizers market in Brazil is expected to grow from 2023 to 2030.
South America Micronutrient Fertilizer Market Trends
The government's initiatives to achieve self-sufficiency have significantly contributed to the increased field crop cultivation
- The cultivation area for field crops in South America witnessed growth from 111.6 million ha in 2017 to 126.1 million ha in 2022, marking a 12.8% increase. This expansion in cultivation is projected to drive up the demand for fertilizers in the region. Field crops dominated the landscape, accounting for a substantial 96.8% share. In 2022, Brazil held the lion's share of the market at 56.9%, with Argentina trailing at 29.3%. Brazil, known as the global leader in soy production and exports, saw its soy output touch nearly 135 million tonnes in 2021. Out of this, a significant 105.5 million tonnes, or 82%, was exported, with 82% in raw soybean form, 16% as soybean cake, and 2% as soybean oil.
- Soybean cultivation reigns supreme in South America, with Brazil and Argentina leading the pack, accounting for 64.4% and 26.1% of the cultivated area, respectively. However, the region is currently grappling with an extended drought, leading to alarmingly low water levels in major rivers. This has far-reaching consequences, hampering both harvests and the transportation of crucial summer crops, especially soybeans. Consequently, this situation amplifies the urgency of increasing fertilizer applications in South America.
- Driven by robust global demand and favorable profitability, soybean cultivation in the Mercosur region has witnessed a surge. The price surge in raw materials, including soy, has incentivized producers to expand their operations, investing in new lands and equipment to enhance their scale and efficiency. As a result, the region is poised for further expansion in its field crop cultivation, aligning with the growth in both domestic and international markets.
In 2022, the highest average application rate among micronutrients is for manganese, approximately 12.2 kg/hectare
- Oxisols and ultisols dominate the South American soil landscape. Oxisols, characterized by high weathering, uniform texture, and abundant iron and aluminum oxides, contrast with ultisols, which are less weathered but more acidic. However, both soil types necessitate micronutrient supplementation for optimal crop yields, given the immobility of most micronutrients in the soil. Micronutrient deficiencies are increasingly limiting annual crop production in South America. Crops like rice, corn, wheat, soybean, and common bean have reported deficits in essential micronutrients such as zinc, copper, boron, manganese, and iron.
- In 2022, the average application rate of micronutrient fertilizers in field crops stood at 4.3 kg/hectare. Despite the presence of iron in these soils, its availability to plants is hampered by its binding with excessive phosphates. Consequently, the average iron application rate in field crops across the region is 3.3 kg/hectare. Manganese, with an average application rate of 12.2 kg/hectare in 2022, leads among the micronutrients. While it is prevalent in upland rice, it is less common in rainfed or lowland rice, as its solubility increases under submerged conditions. Manganese-deficient plants exhibit stunted growth, fewer leaves, reduced weight, and smaller root systems during tillering.
- Rapeseed, a prominent field crop in South America, demands higher micronutrient quantities compared to others. In 2022, its average micronutrient fertilizer application rate reached 4.40 kg/hectare. Given the growing emphasis on balanced crop nutrition and the pivotal role of micronutrients in overall yield, an uptick in micronutrient application is anticipated in the coming years.
South America Micronutrient Fertilizer Industry Overview
The South America Micronutrient Fertilizer Market is fragmented, with the top five companies occupying 28.08%. The major players in this market are EuroChem Group, K+S Aktiengesellschaft, Nortox, The Mosaic Company and Yara International ASA (sorted alphabetically).
Additional Benefits:
- The market estimate (ME) sheet in Excel format
- 3 months of analyst support
TABLE OF CONTENTS
1 EXECUTIVE SUMMARY & KEY FINDINGS
2 REPORT OFFERS
3 INTRODUCTION
- 3.1 Study Assumptions & Market Definition
- 3.2 Scope of the Study
- 3.3 Research Methodology
4 KEY INDUSTRY TRENDS
- 4.1 Acreage Of Major Crop Types
- 4.1.1 Field Crops
- 4.1.2 Horticultural Crops
- 4.2 Average Nutrient Application Rates
- 4.2.1 Micronutrients
- 4.2.1.1 Field Crops
- 4.2.1.2 Horticultural Crops
- 4.2.1 Micronutrients
- 4.3 Agricultural Land Equipped For Irrigation
- 4.4 Regulatory Framework
- 4.5 Value Chain & Distribution Channel Analysis
5 MARKET SEGMENTATION (includes market size in Value in USD and Volume, Forecasts up to 2030 and analysis of growth prospects)
- 5.1 Product
- 5.1.1 Boron
- 5.1.2 Copper
- 5.1.3 Iron
- 5.1.4 Manganese
- 5.1.5 Molybdenum
- 5.1.6 Zinc
- 5.1.7 Others
- 5.2 Application Mode
- 5.2.1 Fertigation
- 5.2.2 Foliar
- 5.2.3 Soil
- 5.3 Crop Type
- 5.3.1 Field Crops
- 5.3.2 Horticultural Crops
- 5.3.3 Turf & Ornamental
- 5.4 Country
- 5.4.1 Argentina
- 5.4.2 Brazil
- 5.4.3 Rest of South America
6 COMPETITIVE LANDSCAPE
- 6.1 Key Strategic Moves
- 6.2 Market Share Analysis
- 6.3 Company Landscape
- 6.4 Company Profiles
- 6.4.1 BMS Micro-Nutrients NV
- 6.4.2 EuroChem Group
- 6.4.3 Grupa Azoty S.A. (Compo Expert)
- 6.4.4 Haifa Group
- 6.4.5 ICL Group Ltd
- 6.4.6 Inquima LTDA
- 6.4.7 K+S Aktiengesellschaft
- 6.4.8 Nortox
- 6.4.9 The Mosaic Company
- 6.4.10 Yara International ASA
7 KEY STRATEGIC QUESTIONS FOR FERTILIZER CEOS
8 APPENDIX
- 8.1 Global Overview
- 8.1.1 Overview
- 8.1.2 Porter's Five Forces Framework
- 8.1.3 Global Value Chain Analysis
- 8.1.4 Market Dynamics (DROs)
- 8.2 Sources & References
- 8.3 List of Tables & Figures
- 8.4 Primary Insights
- 8.5 Data Pack
- 8.6 Glossary of Terms
南米の微量栄養素肥料:市場シェア分析、産業動向、成長予測(2025年~2030年)
- 発行日
- 発行
- Mordor Intelligence
- ページ情報
- 英文 196 Pages
- 納期
- 2~3営業日