
北米の微量栄養素肥料:市場シェア分析、産業動向、成長予測(2025年~2030年)
North America Micronutrient Fertilizer - Market Share Analysis, Industry Trends & Statistics, Growth Forecasts (2025 - 2030)- 発行日
- ページ情報
- 英文 196 Pages
- 納期
- 2~3営業日
- 商品コード
- 1693528
- カスタマイズ可能 お客様のご希望に応じて、既存データの加工や未掲載情報(例:国別セグメント)の追加などの対応が可能です。詳細はお問い合わせください。
- 適宜更新あり 本レポートは最新情報反映のため適宜更新し、内容構成変更を行う場合があります。ご検討の際はお問い合わせください。
- 翻訳ツール提供対象 PDF対応AI翻訳ツールの無料貸し出しサービスのご利用が可能です
概要
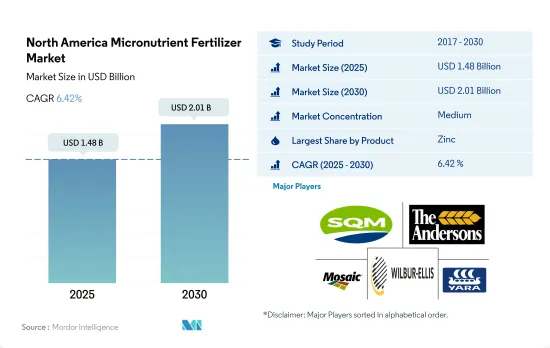
北米の微量栄養素肥料市場規模は2025年に14億8,000万米ドルと推定され、2030年には20億1,000万米ドルに達すると予測され、予測期間(2025~2030年)のCAGRは6.42%で成長すると予測されます。
栽培の拡大と、品質と収量を向上させるための微量栄養素の必要性が、微量栄養素の需要を促進すると予想されます。
- 微量栄養素は植物の成長に不可欠です。バランスのとれた作物栄養において重要な役割を果たしています。微量栄養素のいずれかが欠乏すると、植物の成長が制限される可能性があります。微量栄養素肥料には、ホウ素、銅、マンガン、亜鉛、コバルトなどの元素が含まれています。植物はこれらの物質を少量でも必要とします。
- 作物タイプ別では、畑作物が2022年に12億6,000万米ドルの最高額と39万9,200トンの消費量を記録しました。畑作物は同期間に北米の農地の約88.7%を占めました。
- 従来型微量栄養素肥料セグメントは市場シェアの79.0%を占め、2022年には11億2,000万米ドルとなりました。2030年には15億7,000万米ドルに達すると予測されています。特殊肥料セグメントは21.0%を占め、2022年には2億9,870万米ドルとなりました。2030年末には4億3,510万米ドルに達する見込みです。
- 2022年、亜鉛は北米の微量栄養素肥料市場全体の27.0%を占め、微量栄養素の中で最大の価値を持っています。亜鉛は植物酵素系の主要成分です。亜鉛は様々な種類の酵素の活性化を助け、炭水化物代謝を促進します。亜鉛欠乏症はワシントン果樹園、トウモロコシ、小麦で特によく見られ、主に成長阻害や小葉障害を引き起こします。
- 銅は2022年の北米の微量栄養素肥料市場の17.3%を占めます。カナダ西部では銅欠乏症が蔓延しており、作物の成長を制限し、収量の可能性を減らしています。銅肥料市場は2023~2030年に5.3%のCAGRが見込まれます。
土壌の肥沃度と栄養不足を改善する必要性が市場の成長を促進する
- 9,880万ヘクタール近い農地を持つ米国は、北米でトップの農業生産国です。2022年、米国は微量栄養素肥料の北米市場で56.9%の大きなシェアを占めています。
- 2022年、米国の作物栽培面積は前年比1%増の1億3,970万ヘクタールに達しました。この耕作面積の拡大は、土壌養分不足の深刻化に伴う微量栄養素肥料への依存度の高まりと一致しています。
- 北米で第2位の農地所有者であるカナダは、約3,090万ヘクタールを誇っています。2022年には、カナダはこの地域の微量栄養素肥料市場で14.2%のシェアを占めていました。カナダの農地の88.0%以上が作物専用で、大草原地帯、ケベック州、オンタリオ州南部に集中しています。
- 2022年には、メキシコが微量栄養素肥料市場の重要な参入企業として台頭し、市場金額で26.6%、数量で26.4%のシェアを獲得しました。畑作物がメキシコの微量栄養素肥料市場の大半を占め、総量の88.3%を占めました。園芸作物が7.0%で続き、芝生と観賞用作物が残りの4.7%を占めています。メキシコの主要畑作作物には、トウモロコシ、サトウキビ、小麦が含まれます。
- その他の北米諸国は、2022年の微量栄養素肥料市場全体の2.4%を占めています。このセグメントのドミニカ共和国、エルサルバドル、ニカラグアのような国は肥料の輸入に依存しており、輸入農産物に大きく依存しています。
- 北米の微量栄養素肥料市場は着実な成長軌道にあり、今後も拡大が続くと予測されます。この成長の原動力となっているのは、作物の堅調な生育を確保する上で微量栄養素が極めて重要な役割を果たすという認識が高まっていることです。
北米の微量栄養素肥料の市場動向
補助金などの政府支援が畑作物の拡大に貢献
- 北米の農場では様々な作物が栽培されており、主に畑作物が栽培されています。トウモロコシ、綿花、米、大豆、小麦は、この地域で主要な畑作物の一部です。米国、カナダ、メキシコは、この地域の農業生産に大きく貢献しています。2022年、北米では畑作物が栽培全体の約97.6%を占め、穀物と油糧種子が市場を独占しています。
- 国別では、米国が作物栽培面積全体の1億3,570万ヘクタールを占め、市場を独占しています。中でも畑作と園芸が面積の大半を占め、2022年には97.2%と2.8%を占めています。しかし、2018~2019年にかけて、同国は作物栽培面積の大幅な落ち込みを目の当たりにしたが、これは主にテキサス州やヒューストンなどの地域で大洪水が発生したことによる不利な環境条件によるものでした。
- 最大の栽培作物はトウモロコシで、その大部分は「コーンベルト」として知られる地域で栽培されています。コーンベルトは米国中西部の伝統的地域で、インディアナ州西部、イリノイ州、アイオワ州、ミズーリ州、ネブラスカ州東部、カンザス州東部をほぼカバーし、トウモロコシ(メイズ)と大豆が主要作物となっています。米国は米の主要輸出国でもあります。この地域の稲作は主に4つの地域に集中しており、そのうち3つは南部に、1つはカリフォルニアにあります。したがって、この地域の畑作物の市場ポテンシャルの増大は、政府の資金援助と保護の強化と相まって、この地域の畑作物栽培面積をプラスに推進すると予想されます。
微量栄養素の欠乏と作物損失の増加が微量栄養素の散布率を高める
- 2022年には、マンガン、銅、亜鉛、鉄、ホウ素の施用率が最も高く、それぞれ10.6kg/ha、6.9kg/ha、6.8kg/ha、3.3kg/ha、1.5kg/haでした。ほとんどの微量栄養素は作物への吸収率が低いが、それらが利用できない場合、植物の重要な機能が著しく制限され、異常、生育不良、収量の減少につながります。収量、商品価格、投入コストが上昇していることから、生産者は微量栄養素の欠乏を含む穀物生産への潜在的な障害を精査しています。
- 微量栄養素の肥料消費量は、小麦、ソルガム、大豆、綿花が大半を占め、トウモロコシやコメなど他の畑作物の役割は小さいです。特に小麦は、銅とマンガンの著しい欠乏に直面しており、鉄と亜鉛の欠乏も収量に軽度の影響を与えています。
- それぞれの作物に必要な微量栄養素は、地域の土壌条件に影響されます。米国では、有機物が少なく溶出しやすい南東部の砂質土壌では、北東部の肥沃な黒色土壌とは異なり、一般的にホウ素が欠乏します。同様に、カナダのアルバータ州中部の一部の畑では、穀物栽培に不可欠な銅が欠乏しています。
- メキシコの農業土壌はすべて亜鉛欠乏症です。しかし、この状態はケレタロ州、ソノラ州、シナロア州でより一般的であり、亜鉛微量栄養素肥料の必要性が高まっていることを示しています。北米の土壌はもともと微量栄養素が不足しているため、栽培中に微量栄養素のサプリメントを消費することが多くなります。
北米の微量栄養素肥料の産業概要
北米の微量栄養素肥料市場は適度に統合されており、上位5社で63.51%を占めています。この市場の主要企業は、Sociedad Quimica y Minera de Chile SA、The Andersons Inc.、The Mosaic Company、Wilbur-Ellis Company LLC、Yara International ASAなどです。
その他の特典
- エクセル形式の市場予測(ME)シート
- 3ヶ月のアナリストサポート
目次
第1章 エグゼクティブサマリーと主要調査結果
第2章 レポートのオファー
第3章 イントロダクション
- 調査の前提条件と市場定義
- 調査範囲
- 調査手法
第4章 主要産業動向
- 主要作物の作付面積
- 畑作物
- 園芸作物
- 平均養分施用率
- 微量栄養素
- 畑作物
- 園芸作物
- 微量栄養素
- 灌漑設備のある農地
- 規制の枠組み
- バリューチェーンと流通チャネル分析
第5章 市場セグメンテーション
- 製品
- ホウ素
- 銅
- 鉄
- マンガン
- モリブデン
- 亜鉛
- その他
- 適用方法
- 施肥
- 葉面散布
- 土壌
- 作物タイプ
- 畑作物
- 園芸作物
- 芝・観賞用
- 生産国
- カナダ
- メキシコ
- 米国
- その他の北米地域
第6章 競争情勢
- 主要な戦略動向
- 市場シェア分析
- 企業情勢
- 企業プロファイル
- Haifa Group
- Koch Industries Inc.
- Nouryon
- Sociedad Quimica y Minera de Chile SA
- The Andersons Inc.
- The Mosaic Company
- Wilbur-Ellis Company LLC
- Yara International ASA
第7章 CEOへの主要戦略的質問
第8章 付録
- 世界概要
- 概要
- ファイブフォース分析フレームワーク
- 世界のバリューチェーン分析
- 市場力学(DROs)
- 情報源と参考文献
- 図表一覧
- 主要な洞察
- データパック
- 用語集
目次
The North America Micronutrient Fertilizer Market size is estimated at 1.48 billion USD in 2025, and is expected to reach 2.01 billion USD by 2030, growing at a CAGR of 6.42% during the forecast period (2025-2030).
Expansion of cultivation and the need for micronutrients to enhance quality and yield are anticipated to drive the demand for micronutrients
- Micronutrients are essential for plant growth. They play an important role in balanced crop nutrition. The lack of any of the micronutrients may limit plant growth. Micronutrient fertilizers contain elements like boron, copper, manganese, zinc, and cobalt. Plants require these substances in small quantities.
- By crop type, field crops recorded the highest value of USD 1.26 billion and a consumption volume of 399.2 thousand metric tons in 2022. Field crops accounted for about 88.7% of agricultural land in North America during the same period.
- The conventional micronutrient fertilizers segment accounted for 79.0% of the market share and was valued at USD 1.12 billion in 2022. It is anticipated to reach USD 1.57 billion by 2030. The specialty fertilizers segment accounted for 21.0% and was valued at USD 298.7 million in 2022. It is expected to reach USD 435.1 million by the end of 2030.
- In 2022, zinc accounted for 27.0% of the total micronutrient fertilizer market in North America and is the largest valued micronutrient. Zinc is a major component of plant enzyme systems. Zinc aids in the activation of various types of enzymes, boosting carbohydrate metabolism. Zinc deficiency is particularly common in Washington orchards, maize, and wheat, and it primarily causes stunted growth and little leaf disorder.
- Copper accounted for 17.3% of the North American micronutrient fertilizers market in 2022. Copper deficiency is becoming more widespread across Western Canada, limiting the growth of the crop and reducing yield potential because the natural stores of copper have been depleted by plants that take up copper in higher amounts. The copper fertilizer market is anticipated to witness a CAGR of 5.3% during 2023-2030.
The need to improve soil fertility and nutrient deficiency will fuel the growth of the market
- With nearly 98.8 million hectares of agricultural land, the United States dominates as North America's top agriculture producer. In 2022, the US commanded a significant 56.9% share of the North American market for micronutrient fertilizers.
- In 2022, crop cultivation in the US covered 139.7 million hectares, a 1% increase from the previous year. This expansion in cultivated areas has coincided with a growing reliance on micronutrient fertilizers, driven by escalating soil nutrient deficiencies.
- Canada, the second-largest agricultural landowner in North America, boasted around 30.9 million hectares. In 2022, Canada held a 14.2% share of the region's micronutrient fertilizer market. Over 88.0% of Canada's agricultural land is dedicated to crops, with notable concentrations in the Prairies, Quebec, and Southern Ontario.
- In 2022, Mexico emerged as a significant player in the micronutrient fertilizer market, capturing a 26.6% share in market value and 26.4% in volume. Field crops dominated Mexico's micronutrient fertilizer market, accounting for 88.3% of the total volume. Horticulture crops followed at 7.0%, with turf & ornamental crops making up the remaining 4.7%. Key field crops in Mexico include corn, sugarcane, and wheat.
- Other North American countries collectively contributed 2.4% to the total micronutrient fertilizer market value in 2022. Nations like the Dominican Republic, El Salvador, and Nicaragua, in this segment, rely on fertilizer imports and heavily depend on imported agricultural commodities.
- The North American micronutrient fertilizer market is on a steady growth trajectory and is projected to continue expanding in the coming years. This growth is driven by the increasing recognition of micronutrients' pivotal role in ensuring robust crop growth.
North America Micronutrient Fertilizer Market Trends
Government support, such as subsidies, contributed to the expansion of field crops
- A wide array of crops are grown on North American farms, mainly covering field crops. Corn, cotton, rice, soybean, and wheat are some of the dominating field crops across the region. The United States, Canada, and Mexico are major contributors to the region's agricultural output. In 2022, field crops covered around 97.6% of the overall cultivation in North America, with cereals and oilseeds dominating the market.
- By country, the United States dominates the market by covering 135.7 million hectares of the overall area under crop cultivation. Among them, field crops and horticulture cover the majority of the area and accounted for 97.2% and 2.8% in the year 2022. However, between 2018-2019, the country witnessed a significant dip in crop acreages, which was mainly due to unfavorable environmental conditions resulting in heavy floods in areas like Texas and Houston.
- The largest crop cultivated is corn, the majority of which is grown in a region known as the 'Corn Belt'-a traditional area in the Midwestern United States, roughly covering western Indiana, Illinois, Iowa, Missouri, eastern Nebraska, and eastern Kansas, where corn (maize) and soybeans are the dominant crops. The United States is also a major rice exporter. The rice cultivation in the region is mainly concentrated within four regions, with three in the South and one in California. Therefore, the increased market potential for the region's field crop, coupled with increased government funding and protection, is anticipated to positively drive the area under field crop cultivation in the region.
Raising micronutrient deficiencies and crop losses increase micronutrient application rates
- In 2022, the highest application rates were observed for manganese, copper, zinc, iron, and boron, at 10.6 kg/ha, 6.9 kg/ha, 6.8 kg/ha, 3.3 kg/ha, and 1.5 kg/ha, respectively. Although most micronutrients have lower crop uptake, their unavailability can severely limit critical plant functions, leading to abnormalities, stunted growth, and reduced yields. Given the rising yields, commodity prices, and input costs, growers are scrutinizing potential barriers to grain production, including micronutrient deficiencies.
- Wheat, sorghum, soybean, and cotton dominate micronutrient fertilizer consumption, with other field crops like corn and rice playing a smaller role. Wheat, in particular, faces significant deficiencies in copper and manganese, while iron and zinc deficiencies also mildly impact its yield.
- The micronutrient requirements of each crop are influenced by regional soil conditions. In the United States, sandy soils in the southeast, which are low in organic matter and prone to leaching, commonly exhibit boron deficiencies, unlike the fertile black soils in the northeast. Similarly, certain fields in Central Alberta, Canada, face copper deficiencies, which are crucial for cereal cultivation.
- All agricultural soils in Mexico are zinc-deficient. However, this condition is more common in Queretaro, Sonora, and Sinaloa, indicating an increased need for zinc micronutrient fertilizers. North American soil is naturally deficient in micronutrients, leading to increased consumption of micronutrient supplements during cultivation.
North America Micronutrient Fertilizer Industry Overview
The North America Micronutrient Fertilizer Market is moderately consolidated, with the top five companies occupying 63.51%. The major players in this market are Sociedad Quimica y Minera de Chile SA, The Andersons Inc., The Mosaic Company, Wilbur-Ellis Company LLC and Yara International ASA (sorted alphabetically).
Additional Benefits:
- The market estimate (ME) sheet in Excel format
- 3 months of analyst support
TABLE OF CONTENTS
1 EXECUTIVE SUMMARY & KEY FINDINGS
2 REPORT OFFERS
3 INTRODUCTION
- 3.1 Study Assumptions & Market Definition
- 3.2 Scope of the Study
- 3.3 Research Methodology
4 KEY INDUSTRY TRENDS
- 4.1 Acreage Of Major Crop Types
- 4.1.1 Field Crops
- 4.1.2 Horticultural Crops
- 4.2 Average Nutrient Application Rates
- 4.2.1 Micronutrients
- 4.2.1.1 Field Crops
- 4.2.1.2 Horticultural Crops
- 4.2.1 Micronutrients
- 4.3 Agricultural Land Equipped For Irrigation
- 4.4 Regulatory Framework
- 4.5 Value Chain & Distribution Channel Analysis
5 MARKET SEGMENTATION (includes market size in Value in USD and Volume, Forecasts up to 2030 and analysis of growth prospects)
- 5.1 Product
- 5.1.1 Boron
- 5.1.2 Copper
- 5.1.3 Iron
- 5.1.4 Manganese
- 5.1.5 Molybdenum
- 5.1.6 Zinc
- 5.1.7 Others
- 5.2 Application Mode
- 5.2.1 Fertigation
- 5.2.2 Foliar
- 5.2.3 Soil
- 5.3 Crop Type
- 5.3.1 Field Crops
- 5.3.2 Horticultural Crops
- 5.3.3 Turf & Ornamental
- 5.4 Country
- 5.4.1 Canada
- 5.4.2 Mexico
- 5.4.3 United States
- 5.4.4 Rest of North America
6 COMPETITIVE LANDSCAPE
- 6.1 Key Strategic Moves
- 6.2 Market Share Analysis
- 6.3 Company Landscape
- 6.4 Company Profiles
- 6.4.1 Haifa Group
- 6.4.2 Koch Industries Inc.
- 6.4.3 Nouryon
- 6.4.4 Sociedad Quimica y Minera de Chile SA
- 6.4.5 The Andersons Inc.
- 6.4.6 The Mosaic Company
- 6.4.7 Wilbur-Ellis Company LLC
- 6.4.8 Yara International ASA
7 KEY STRATEGIC QUESTIONS FOR FERTILIZER CEOS
8 APPENDIX
- 8.1 Global Overview
- 8.1.1 Overview
- 8.1.2 Porter's Five Forces Framework
- 8.1.3 Global Value Chain Analysis
- 8.1.4 Market Dynamics (DROs)
- 8.2 Sources & References
- 8.3 List of Tables & Figures
- 8.4 Primary Insights
- 8.5 Data Pack
- 8.6 Glossary of Terms
- 発行日
- 発行
- Mordor Intelligence
- ページ情報
- 英文 196 Pages
- 納期
- 2~3営業日