
|
市場調査レポート
商品コード
1693509
インドの微量栄養素肥料:市場シェア分析、産業動向と統計、成長予測(2025年~2030年)India Micronutrient Fertilizer - Market Share Analysis, Industry Trends & Statistics, Growth Forecasts (2025 - 2030) |
||||||
カスタマイズ可能
適宜更新あり
|
|||||||
| インドの微量栄養素肥料:市場シェア分析、産業動向と統計、成長予測(2025年~2030年) |
|
出版日: 2025年03月18日
発行: Mordor Intelligence
ページ情報: 英文 182 Pages
納期: 2~3営業日
|

全表示
- 概要
- 目次
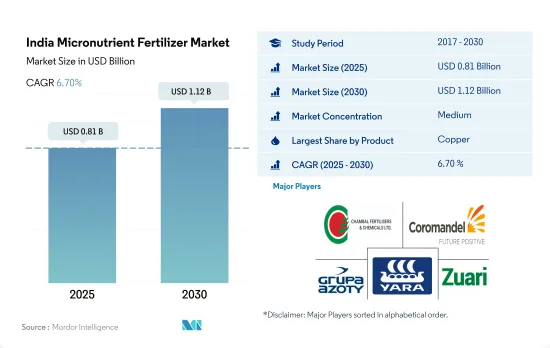
インドの微量栄養素肥料の市場規模は2025年に8億1,000万米ドルと推定・予測され、2030年には11億2,000万米ドルに達し、予測期間(2025~2030年)のCAGRは6.70%で成長すると予測されます。
品質と収量を向上させるための微量栄養素の要求が高まる栽培の拡大に伴い、微量栄養素の需要は拡大すると予想されます。
- 2022年のインドの微量栄養素肥料の消費量は亜鉛が圧倒的に多く、全体の26.9%を占めます。この高い消費量は、主にインドの作付土壌で亜鉛欠乏症が蔓延していることによる。水牛速報では、マハラシュトラ州(83%)、カルナータカ州(73%)、アンドラ・プラデシュ州(58%)の土壌で亜鉛が著しく不足していることが指摘されています。
- 鉄は亜鉛に次いでインドで消費される微量栄養素肥料の第2位で、全消費量の19.9%を占めています。同じ地域で長期間にわたって畑作物を栽培し続けると、土壌養分の枯渇につながります。こうした要因が市場規模を押し上げ、2023~2030年のCAGRは6.8%を記録すると予測されます。
- マンガンは微量栄養素消費量の第3位で、全体の8.1%を占めます。より高い生産性と品質へのニーズによって、マンガン肥料の需要は増加し、2023~2030年にかけて金額ベースでCAGR 5.2%を記録すると予想されます。
- インドでは微量栄養素の消費が顕著に急増しており、2023~2030年のCAGRは4.4%と予測されます。この増加は、農作物の生産性を向上させる微量栄養素の役割に対する農業従事者の意識の高まりによるものです。
- 今後、インドにおける微量栄養素肥料の需要は、2023~2030年にかけて金額ベースでCAGR 6.5%を記録する展望です。この急増の背景には、作物の収量と生産性の向上に対するニーズと、土壌の微量栄養素不足の深刻化という2つの要因があります。さらに、土壌への施用で安定性が高まることで知られるキレート化肥料の進歩が、微量栄養素の成長をさらに後押しすると予想されます。
インドの微量栄養素肥料の市場動向
マンガン欠乏症は欧州諸国でよく見られる問題で、砂質土壌やpH6以上の有機質土壌に最も多く見られます。
- 同国の畑作物の栽培面積は2017~2021年にかけて3.5%増加しました。国内外での消費者需要の高まりにより、同国で穀物、豆類、油糧種子の栽培が増加していることが、栽培面積増加の主要原動力となっています。
- 作物タイプ別では、コメ、小麦、大豆の栽培面積が最も大きく、2022年にはそれぞれ4,700万ha、3,110万ha、1,230万haを占めます。コメはインドで最も重要な食用作物であり、全作付面積の約4分の1を占め、インド人口の約半数に食糧を供給しています。主に西ベンガル州、ウッタル・プラデシュ州、アンドラ・プラデシュ州、パンジャブ州、タミル・ナードゥ州で栽培されています。
- それに伴い、同国のコメ消費量は2016年の9,580万トンから2022年には1億700万トンに増加しており、これは同国における同作物に対する需要の高まりを示すものです。この動向は、2023~2030年にかけての肥料需要をさらに押し上げると予想されます。同様に、国内の小麦栽培は2017年の9,850万トンから2020年には1億760万トンに増加しています。パンジャブ州、西ベンガル州、ハリヤナ州、ラジャスタン州で主に栽培されています。小麦はインドで2番目に重要な穀物作物であり、同国の食料・栄養安全保障において重要な役割を果たしています。そのため、国内外での需要の高まりと相まって、同国における穀物栽培の活発化が、2023~2030年にかけてのインド肥料市場を牽引すると予想されます。
インドの土壌における広範な微量栄養素の欠乏は、作物収量の減少につながっています。
- 化学肥料の消費量の増加により、土壌中の微量栄養素の欠乏が拡大し、作物の収量が年々減少しています。バイオ肥料と有機肥料の現状によると、2022年の土壌はホウ素(47.0%)、亜鉛(39.0%)、鉄(37.0%)、硫黄(36.0%)が非常に不足しています。
- 実証的研究によれば、食料、繊維、燃料の需要増に対応するため、高収量品種が導入されました。これらの高収量品種は肥料に非常によく反応しました。そのため、土壌の栄養分は徐々に枯渇していりました。2021年には、マンガン、銅、亜鉛の平均養分施用量がそれぞれ9.8kg/ha、7.3kg/ha、4.1kg/haと最も多いことが判明しました。
- 菜種/カノーラ、トウモロコシ/メイズ、イネといった作物は、2021年の平均微量栄養素消費量が最も多く、それぞれ10.7kg/ha、6.8kg/ha、6.3kg/haであることがわかりました。高収量作物品種と不均衡な施肥による集約的で近代的な作付け方法の採用は、インドの土壌と作物における広範な微量栄養素欠乏症の出現をもたらし、作物収量の低下と農産物中の微量栄養素濃度の低下につながりました。
- マハラシュトラ州、カルナータカ州、ハリヤナ州、タミル・ナードゥ州、ウッタル・プラデシュ州、マディヤ・プラデシュ州、西ベンガル州、オリッサ州、ビハール州、ウッタル・プラデシュ州などは、亜鉛とホウ素が非常に不足しています。そのため、作物、土壌タイプ、欠乏の深刻度、施用率、施用頻度に応じた微量栄養素の管理が、ここ数年、国内の農業従事者によってサステイナブル農業生産のために適応されており、これが国内の微量栄養素市場を牽引すると予想されています。
インドの微量栄養素肥料産業概要
インドの微量栄養素肥料市場は、上位5社で60.83%を占め、適度に統合されています。この市場の主要企業は、Chambal Fertilizers & Chemicals Ltd、Coromandel International Ltd.、Grupa Azoty S.A.(Compo Expert)、Yara International ASA、Zuari Agro Chemicals Ltdなどです。
その他の特典
- エクセル形式の市場予測(ME)シート
- 3ヶ月のアナリストサポート
目次
第1章 エグゼクティブサマリーと主要調査結果
第2章 レポートのオファー
第3章 イントロダクション
- 調査の前提条件と市場定義
- 調査範囲
- 調査手法
第4章 主要産業動向
- 主要作物の作付面積
- 畑作物
- 園芸作物
- 平均養分施用率
- 微量栄養素
- 畑作物
- 園芸作物
- 微量栄養素
- 灌漑設備のある農地
- 規制の枠組み
- バリューチェーンと流通チャネル分析
第5章 市場セグメンテーション
- 製品
- ホウ素
- 銅
- 鉄
- マンガン
- モリブデン
- 亜鉛
- その他
- 適用方法
- 施肥
- 葉面散布
- 土壌
- 作物タイプ
- 畑作物
- 園芸作物
- 芝・観賞用
第6章 競合情勢
- 主要な戦略動向
- 市場シェア分析
- 企業情勢
- 企業プロファイル
- Chambal Fertilizers & Chemicals Ltd
- Coromandel International Ltd.
- Deepak fertilizers & Petrochemicals Corporation Ltd
- Grupa Azoty S.A.(Compo Expert)
- Haifa Group
- Indian Farmers Fertiliser Cooperative Limited
- Mangalore Chemicals & Fertilizers Ltd.
- Sociedad Quimica y Minera de Chile SA
- Yara International ASA
- Zuari Agro Chemicals Ltd
第7章 CEOへの主要戦略的質問
第8章 付録
- 世界概要
- 概要
- ファイブフォース分析フレームワーク
- 世界のバリューチェーン分析
- 市場力学(DROs)
- 情報源と参考文献
- 図表一覧
- 主要な洞察
- データパック
- 用語集
The India Micronutrient Fertilizer Market size is estimated at 0.81 billion USD in 2025, and is expected to reach 1.12 billion USD by 2030, growing at a CAGR of 6.70% during the forecast period (2025-2030).
With the expansion of cultivation with increasing requirements of micronutrients to improve quality and yield, the demand for micronutrients is expected to grow
- Zinc dominated India's micronutrient fertilizer consumption in 2022, accounting for 26.9% of the total. This high consumption is primarily driven by the prevalent zinc deficiency in Indian cropping soils. Notably, the buffalo bulletin highlights significant zinc deficiencies in the soils of Maharashtra (83%), Karnataka (73%), and Andhra Pradesh (58%).
- Iron follows zinc as the second-most consumed micronutrient fertilizer in India, representing 19.9% of the total consumption. Continuous cultivation of field crops in the same area for extended periods leads to soil nutrient depletion. These factors are projected to drive the market's value, registering a CAGR of 6.8% from 2023 to 2030.
- Manganese ranks third in micronutrient consumption, comprising 8.1% of the total. Driven by the need for higher productivity and quality, the demand for manganese fertilizers is expected to rise, registering a CAGR of 5.2% in terms of value during 2023-2030.
- India has witnessed a notable surge in micronutrient consumption, projected to register a 4.4% CAGR during 2023-2030. This uptick is attributed to the increasing awareness among farmers about the role of micronutrients in enhancing crop productivity.
- Looking ahead, the demand for micronutrient fertilizers in India is poised to register a 6.5% CAGR in value from 2023 to 2030. This surge is driven by the twin factors of a need for higher crop yields and productivity, coupled with escalating soil micronutrient deficiencies. Additionally, advancements in chelated fertilizers, known for their enhanced stability in soil applications, are expected to further bolster the growth of micronutrients.
India Micronutrient Fertilizer Market Trends
Manganese deficiency is a common problem in European countries, which most frequently affects sandy soils and organic soils with a pH above 6
- The area under field crop cultivation in the country increased by 3.5% from 2017 to 2021. The increased cultivation of cereals, pulses, and oilseeds in the country due to the rising consumer demand domestically and internationally is the major driving factor for the rising acreage.
- By crop type, rice, wheat, and soybean occupied the largest area under cultivation in the country, accounting for 47 million ha, 31.1 million ha, and 12.3 million ha, respectively, in the year 2022. Rice is the most important food crop of India, covering about one-fourth of the total cropped area and providing food to about half of the Indian population. It is cultivated in almost all the states of the country, mainly in West Bengal, Uttar Pradesh, Andhra Pradesh, Punjab, and Tamil Nadu.
- Accordingly, rice consumption in the country increased from 95.8 million tons in 2016 to 107 million tons in 2022, which shows the rising demand for the crop in the country. This trend is further anticipated to drive the demand for fertilizers during 2023-2030. Similarly, wheat cultivation in the country increased from 98.5 million tons in 2017 to 107.6 million tons in the year 2020. It is cultivated majorly in Punjab, West Bengal, Haryana, and Rajasthan. Wheat is the second most important cereal crop in India and plays a vital role in the food and nutritional security of the country. Therefore, the intense cereal cultivation in the country, coupled with rising domestic and international demand, is anticipated to drive the Indian fertilizer market during 2023-2030.
Widespread micronutrient deficiency in soils of India is leading to reduced crop yield
- The increasing consumption of chemical fertilizers has led to a higher deficiency of micronutrients in the soil, leading to lesser crop yield over the years. The State of Biofertilizers and Organic Fertilizers stated that the soil was highly deficient in boron (47.0%), zinc (39.0%), iron (37.0%), and sulfur (36.0%) in 2022.
- Empirical studies show that high-yielding cultivars were introduced to meet the growing demand for food, fiber, and fuel. These high-yielding crop cultivars were highly responsive to fertilizers. Thus, the soils were slowly exhausted from their nutrients. In 2021, manganese, copper, and zinc were found to have the highest average nutrient application rates of 9.8 kg/ha, 7.3 kg/ha, and 4.1 kg/ha, respectively.
- Crops such as rapeseed/canola, corn/maize, and rice were found to be the largest consumers of average micronutrients in 2021, accounting for 10.7, 6.8, and 6.3 kg/ha, respectively. The adoption of intensive and modern cropping practices with high-yielding crop cultivars and unbalanced fertilizer application resulted in the emergence of widespread micronutrient deficiency in soils and crops of India, leading to reduced crop yield and low micronutrient concentration in agricultural produce.
- States such as Maharashtra, Karnataka, Haryana, Tamil Nadu, Uttar Pradesh, Madhya Pradesh, West Bengal, Orissa, Bihar, and Uttar Pradesh are highly deficient in zinc and boron. Hence, micronutrient management depending upon crops, soil types, the severity of the deficiency, rates, and frequency of application has been adapted by the farmers in the country for sustainable agricultural production over the past few years, which is anticipated to drive the micronutrient market in the country.
India Micronutrient Fertilizer Industry Overview
The India Micronutrient Fertilizer Market is moderately consolidated, with the top five companies occupying 60.83%. The major players in this market are Chambal Fertilizers & Chemicals Ltd, Coromandel International Ltd., Grupa Azoty S.A. (Compo Expert), Yara International ASA and Zuari Agro Chemicals Ltd (sorted alphabetically).
Additional Benefits:
- The market estimate (ME) sheet in Excel format
- 3 months of analyst support
TABLE OF CONTENTS
1 EXECUTIVE SUMMARY & KEY FINDINGS
2 REPORT OFFERS
3 INTRODUCTION
- 3.1 Study Assumptions & Market Definition
- 3.2 Scope of the Study
- 3.3 Research Methodology
4 KEY INDUSTRY TRENDS
- 4.1 Acreage Of Major Crop Types
- 4.1.1 Field Crops
- 4.1.2 Horticultural Crops
- 4.2 Average Nutrient Application Rates
- 4.2.1 Micronutrients
- 4.2.1.1 Field Crops
- 4.2.1.2 Horticultural Crops
- 4.2.1 Micronutrients
- 4.3 Agricultural Land Equipped For Irrigation
- 4.4 Regulatory Framework
- 4.5 Value Chain & Distribution Channel Analysis
5 MARKET SEGMENTATION (includes market size in Value in USD and Volume, Forecasts up to 2030 and analysis of growth prospects)
- 5.1 Product
- 5.1.1 Boron
- 5.1.2 Copper
- 5.1.3 Iron
- 5.1.4 Manganese
- 5.1.5 Molybdenum
- 5.1.6 Zinc
- 5.1.7 Others
- 5.2 Application Mode
- 5.2.1 Fertigation
- 5.2.2 Foliar
- 5.2.3 Soil
- 5.3 Crop Type
- 5.3.1 Field Crops
- 5.3.2 Horticultural Crops
- 5.3.3 Turf & Ornamental
6 COMPETITIVE LANDSCAPE
- 6.1 Key Strategic Moves
- 6.2 Market Share Analysis
- 6.3 Company Landscape
- 6.4 Company Profiles
- 6.4.1 Chambal Fertilizers & Chemicals Ltd
- 6.4.2 Coromandel International Ltd.
- 6.4.3 Deepak fertilizers & Petrochemicals Corporation Ltd
- 6.4.4 Grupa Azoty S.A. (Compo Expert)
- 6.4.5 Haifa Group
- 6.4.6 Indian Farmers Fertiliser Cooperative Limited
- 6.4.7 Mangalore Chemicals & Fertilizers Ltd.
- 6.4.8 Sociedad Quimica y Minera de Chile SA
- 6.4.9 Yara International ASA
- 6.4.10 Zuari Agro Chemicals Ltd
7 KEY STRATEGIC QUESTIONS FOR FERTILIZER CEOS
8 APPENDIX
- 8.1 Global Overview
- 8.1.1 Overview
- 8.1.2 Porter's Five Forces Framework
- 8.1.3 Global Value Chain Analysis
- 8.1.4 Market Dynamics (DROs)
- 8.2 Sources & References
- 8.3 List of Tables & Figures
- 8.4 Primary Insights
- 8.5 Data Pack
- 8.6 Glossary of Terms
