
|
市場調査レポート
商品コード
1693506
中国の微量栄養素肥料の市場シェア分析、産業動向と統計、成長予測(2025年~2030年)China Micronutrient Fertilizer - Market Share Analysis, Industry Trends & Statistics, Growth Forecasts (2025 - 2030) |
||||||
カスタマイズ可能
適宜更新あり
|
|||||||
| 中国の微量栄養素肥料の市場シェア分析、産業動向と統計、成長予測(2025年~2030年) |
|
出版日: 2025年03月18日
発行: Mordor Intelligence
ページ情報: 英文 170 Pages
納期: 2~3営業日
|

全表示
- 概要
- 目次
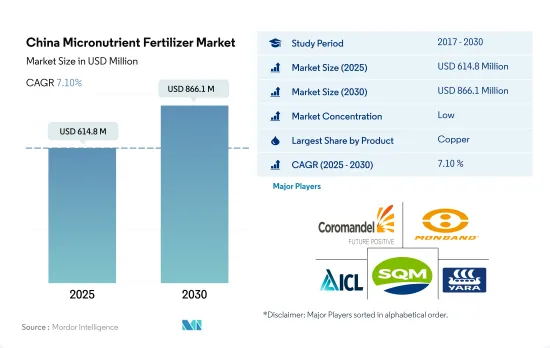
中国の微量栄養素肥料の市場規模は、2025年には6億1,480万米ドルと推定され、2030年には8億6,610万米ドルに達すると予測され、予測期間(2025~2030年)のCAGRは7.10%で成長すると予測されます。
生産性を向上させるための微量栄養素への要求の高まりが、市場の成長を後押しする可能性があります。
- 土壌における微量栄養素の欠乏は、全国的に広く見られる問題です。微量栄養素の中には、その移動しにくい性質から地殻上に豊富に存在するものもあります。それらは作物に微量栄養素欠乏症を引き起こします。
- 銅は、国内の作物生産に使用される一般的な微量栄養素肥料です。2022年の微量栄養素肥料市場全体の約27.6%を占めています。植物が少量でも必要とする微量栄養素の一つが銅(Cu)です。光合成に必要で、植物の呼吸に不可欠で、植物がタンパク質や炭水化物を代謝するのを助ける。銅は野菜の色や花の色を引き立て、タンパク質の形成に重要な役割を果たします。
- 中国の土壌のほとんどは十分な量の銅を含んでいます。しかし、野菜作物では、2022年の畑作物の平均銅施用率より、平均銅施用率の方が0.2%高かったです。銅は植物では不動な元素であるため、銅欠乏の症状はまず植物の若い部分に現れます。
- 亜鉛は国内で最も消費されている微量栄養素で、2022年には金額ベースで第2位の25.49%の市場シェアを占めます。亜鉛が植物に必要とされる量はごくわずかです。ほとんどの植物における通常の亜鉛濃度は20~100ppmです。しかし、この少量のZnは、植物において酵素の補因子やタンパク質の構造成分として重要な役割を果たしています。
- 生産性の向上や生産量の増加、絶えず拡大する人口に対する食糧と栄養の安全保障を維持する必要性などの要因により、市場は2023~2030年にかけてCAGR 6.9%で拡大する可能性があり、高度肥料の出現も微量栄養素の消費に貢献する可能性があります。
中国の微量栄養素肥料の市場動向
栽培面積の拡大は食糧需要の増加と主食の自給自足を目指す国の目標による。
- 中国の畑作物の耕作面積は、2018年の1億2,660万haから2022年には1億2,780万haへとわずかに拡大し、耕作地全体の70.8%を占めます。2022年の畑作物のシェアはトウモロコシが34.2%を占め、コメ23.6%、小麦18.3%と続きます。このような耕作面積の増加は、中国の肥料需要を押し上げることになります。
- 中国の畑作カレンダーは、春夏(4月~9月)と冬の2つの季節を中心に展開されます。春作には早生トウモロコシ、早生コメ、早生小麦、綿花があり、冬作には冬小麦と菜種があります。しかし、スポットライトを浴びるのは米とトウモロコシで、中国の穀物生産量の3分の1を占めています。世界有数のコメ生産国である中国は、2022年には3,000万ヘクタールを稲作に充て、2億1,000万トンの豊作を記録しました。主要な米生産地域は、黒龍江省、湖南省、江西省、湖北省、江蘇省、四川省、広西チワン族自治区、広東省、クラウド南省にまたがっています。トウモロコシを見ると、2022~2023年の中国の生産量は2億7,720万トンとなり、豊作に後押しされて前年から460万トン急増しました。東北部の黒龍江省、吉林省、内モンゴル自治区がトウモロコシ大国として際立っています。
- 中国の作期は春が中心だが、6月と7月は暑さに悩まされます。何百万人もの人々の主食である米は、その弊害を被っています。灼熱の気温と少ない降雨量は、土壌のミネラル不足を悪化させ、肥料の散布量を増やす必要があります。このような乾燥状態は、作物の収量も低下させています。
中国では、菜種やキャノーラは他の畑作物に比べて多量の微量栄養素が施用されています。
- 微量栄養素は作物の栄養と成長に重要な役割を果たし、その欠乏は収量に大きな影響を与えます。畑作物の微量栄養素肥料の平均施用量は、通常5.2kg/ヘクタールです。なかでもマンガンは、地殻中に11番目に多く存在する微量栄養素であるにもかかわらず、2022年の施用量は9.8kg/ヘクタールと、トップを占めています。しかし、土壌pHが7以上になると、化学的・微生物的酸化が起こり、植物が利用できるMn2+が固定化されます。これが植物におけるマンガン欠乏の引き金となります。
- 2022年には、マンガンに続いて銅が7.3kg/ヘクタールの散布量で市場をリードし、亜鉛が4.1kg/ヘクタール、鉄が3.3kg/ヘクタールと続きます。
- 中国では、菜種またはキャノーラの微量栄養素散布率が他の畑作物に比べて高いことが際立っています。微量栄養素の欠乏が油の収量に大きな影響を与えることを考慮すると、菜種には平均10.79kg/ヘクタールの微量栄養素が施用されています。特筆すべきは、マンガンとモリブデンの葉面散布により、種子の油分が1%増加したことです。
- 土壌中の微量栄養素の欠乏は、過剰なリン酸施肥やその他の自然要因によって生じる可能性があります。特にリン酸は、鉄、亜鉛、銅の作物への利用を制限する可能性があります。中国では、リン酸施肥を減らし、同時に亜鉛施肥を増やすことで、畑作物の収量を高める戦略が採用されました。
- 微量栄養素肥料を最適に施用することで、植物が土壌から一次栄養素を吸収する効率を高め、野菜作物における全体的な必要肥料量を減らすことができます。
中国の微量栄養素肥料の産業概要
中国の微量栄養素肥料市場は細分化されており、上位5社で27.14%を占めています。この市場の主要企業は、Coromandel International Ltd.、Hebei Monband Water Soluble Fertilizer、ICL Group Ltd、Sociedad Quimica y Minera de Chile SA、Yara International ASAなどです。
その他の特典
- エクセル形式の市場予測(ME)シート
- 3ヶ月のアナリストサポート
目次
第1章 エグゼクティブサマリーと主要調査結果
第2章 レポートのオファー
第3章 イントロダクション
- 調査の前提条件と市場定義
- 調査範囲
- 調査手法
第4章 主要産業動向
- 主要作物の作付面積
- 畑作物
- 園芸作物
- 平均養分施用率
- 微量栄養素
- 畑作物
- 園芸作物
- 微量栄養素
- 灌漑設備のある農地
- 規制の枠組み
- バリューチェーンと流通チャネル分析
第5章 市場セグメンテーション
- 製品
- ホウ素
- 銅
- 鉄
- マンガン
- モリブデン
- 亜鉛
- その他
- 用途モード
- 施肥
- 葉面散布
- 土壌
- 作物タイプ
- 畑作物
- 園芸作物
- 芝・観賞用
第6章 競合情勢
- 主要な戦略動向
- 市場シェア分析
- 企業情勢
- 企業プロファイル
- Coromandel International Ltd.
- Grupa Azoty S.A.(Compo Expert)
- Haifa Group
- Hebei Monband Water Soluble Fertilizer Co. Ltd
- ICL Group Ltd
- Sociedad Quimica y Minera de Chile SA
- Yara International ASA
第7章 CEOへの主要戦略的質問
第8章 付録
- 世界概要
- 概要
- ファイブフォース分析フレームワーク
- 世界のバリューチェーン分析
- 市場力学(DROs)
- 情報源と参考文献
- 図表一覧
- 主要な洞察
- データパック
- 用語集
The China Micronutrient Fertilizer Market size is estimated at 614.8 million USD in 2025, and is expected to reach 866.1 million USD by 2030, growing at a CAGR of 7.10% during the forecast period (2025-2030).
The rising requirement of micronutrients to enhance the productivity may boost the growth of the market
- Micronutrient deficiency in soils is a widespread problem across the country. Some of the micronutrients are abundant on the earth's crust due to their immobile nature. They cause micronutrient deficiencies in crops.
- Copper is the common micronutrient fertilizer used in crop production in the country. It accounted for about 27.6% of the total micronutrient fertilizer market value in 2022. One of the micronutrients that plants require in small amounts is copper (Cu). It is necessary for photosynthesis, essential for plant respiration, and helps the plant metabolize proteins and carbohydrates. Copper enhances the color of vegetables as well as the color of flowers and plays a key role in protein formation.
- Most of the soils in China have an adequate amount of copper. However, in vegetable crops, the average copper nutrient application rate was 0.2% higher than the average copper application rate in field crops in 2022. Because copper is an immobile element in plants, symptoms of copper deficiency appear first in the plant's younger sections.
- Zinc is the most consumed micronutrient in the country, accounting for the second largest market share by the value of 25.49% in 2022. Zinc is needed in very small amounts by plants. The normal concentration of Zn in most plants is between 20 to 100 ppm. However, this small amount of Zn plays a key role in plants as an enzyme co-factor and a structural component in proteins.
- Due to factors like the requirement for increased productivity and output, as well as the necessity to maintain food and nutritional security for the area's constantly expanding population, the market may expand during 2023-2030 with a CAGR of 6.9%, and the emergence of advanced fertilizers may also contribute to micronutrient consumption.
China Micronutrient Fertilizer Market Trends
The expansion of the cultivation area is driven by increasing demand for food and the country's goal to achieve self-sufficiency in staple food
- China's cultivation area for field crops expanded marginally from 126.6 million ha in 2018 to 127.8 million ha in 2022, representing 70.8% of the total cultivated land. In 2022, Corn dominated the field crop landscape, commanding a 34.2% share, trailed by rice at 23.6% and wheat at 18.3%. This increase in cultivation area is poised to drive up fertilizer demand in the nation.
- China's field crop calendar revolves around two seasons: spring/summer (April-September) and winter. Spring crops encompass early corn, early rice, early wheat, and cotton, while winter crops center around winter wheat and rapeseed. Yet, it's rice and corn that take the spotlight, contributing to a third of China's grain output. As the world's leading rice producer, China dedicated 30 million hectares to rice farming in 2022, yielding a bountiful 210 million tons. Key rice-growing regions span Heilongjiang, Hunan, Jiangxi, Hubei, Jiangsu, Sichuan, Guangxi, Guangdong, and Yunan. Looking at corn, China was set to produce 277.2 million tons in 2022-2023, a 4.6 million ton surge from the previous year, buoyed by a robust harvest. The Northeast provinces of Heilongjiang, Jilin, and Inner Mongolia stand out as the corn powerhouses.
- While spring dominates China's cropping season, it grapples with heat spikes in June and July. Rice, a dietary staple for millions, bears the brunt. These scorching temperatures, coupled with meager rainfall, exacerbate mineral depletion in the soil, necessitating higher fertilizer application. Such arid conditions can also curtail crop yields.
In China, rapeseed or canola is applied with large amounts of micronutrients compared to other field crops
- Micronutrients play a vital role in crop nutrition and growth, and their deficiency significantly impacts yields. Field crops typically receive an average application rate of 5.2 kg/hectare for micronutrient fertilizers. Among these, manganese takes the lead, with an application rate of 9.8 kg/hectare in 2022, despite being the eleventh most abundant micronutrient in the earth's crust. However, when the soil pH reaches seven or higher, chemical and microbial oxidation occur, leading to the immobilization of plant-available Mn2+. This, in turn, triggers manganese deficiency in plants.
- Following manganese, copper took the market lead with an application rate of 7.3 kg/hectare, trailed by zinc at 4.1 kg/hectare, and iron at 3.3 kg/hectare in 2022.
- In China, rapeseed or canola stands out for its higher micronutrient application rates compared to other field crops. It receives an average of 10.79 kg/hectare of micronutrient fertilizers, given the significant impact of micronutrient deficiency on oil yield. Notably, foliar application of manganese and molybdenum has shown a 1% increase in oil content in the seeds.
- Micronutrient deficiencies in soil can arise from excessive phosphate fertilization and other natural factors. Phosphate, in particular, can limit the availability of iron, zinc, and copper to crops. In China, a strategy was adopted to enhance field crop yields by reducing phosphate fertilization while simultaneously increasing zinc fertilization.
- Optimally applying micronutrient fertilizers can enhance plant efficiency in absorbing primary nutrients from the soil, thereby reducing the overall fertilizer requirement in vegetable crops.
China Micronutrient Fertilizer Industry Overview
The China Micronutrient Fertilizer Market is fragmented, with the top five companies occupying 27.14%. The major players in this market are Coromandel International Ltd., Hebei Monband Water Soluble Fertilizer Co. Ltd, ICL Group Ltd, Sociedad Quimica y Minera de Chile SA and Yara International ASA (sorted alphabetically).
Additional Benefits:
- The market estimate (ME) sheet in Excel format
- 3 months of analyst support
TABLE OF CONTENTS
1 EXECUTIVE SUMMARY & KEY FINDINGS
2 REPORT OFFERS
3 INTRODUCTION
- 3.1 Study Assumptions & Market Definition
- 3.2 Scope of the Study
- 3.3 Research Methodology
4 KEY INDUSTRY TRENDS
- 4.1 Acreage Of Major Crop Types
- 4.1.1 Field Crops
- 4.1.2 Horticultural Crops
- 4.2 Average Nutrient Application Rates
- 4.2.1 Micronutrients
- 4.2.1.1 Field Crops
- 4.2.1.2 Horticultural Crops
- 4.2.1 Micronutrients
- 4.3 Agricultural Land Equipped For Irrigation
- 4.4 Regulatory Framework
- 4.5 Value Chain & Distribution Channel Analysis
5 MARKET SEGMENTATION (includes market size in Value in USD and Volume, Forecasts up to 2030 and analysis of growth prospects)
- 5.1 Product
- 5.1.1 Boron
- 5.1.2 Copper
- 5.1.3 Iron
- 5.1.4 Manganese
- 5.1.5 Molybdenum
- 5.1.6 Zinc
- 5.1.7 Others
- 5.2 Application Mode
- 5.2.1 Fertigation
- 5.2.2 Foliar
- 5.2.3 Soil
- 5.3 Crop Type
- 5.3.1 Field Crops
- 5.3.2 Horticultural Crops
- 5.3.3 Turf & Ornamental
6 COMPETITIVE LANDSCAPE
- 6.1 Key Strategic Moves
- 6.2 Market Share Analysis
- 6.3 Company Landscape
- 6.4 Company Profiles
- 6.4.1 Coromandel International Ltd.
- 6.4.2 Grupa Azoty S.A. (Compo Expert)
- 6.4.3 Haifa Group
- 6.4.4 Hebei Monband Water Soluble Fertilizer Co. Ltd
- 6.4.5 ICL Group Ltd
- 6.4.6 Sociedad Quimica y Minera de Chile SA
- 6.4.7 Yara International ASA
7 KEY STRATEGIC QUESTIONS FOR FERTILIZER CEOS
8 APPENDIX
- 8.1 Global Overview
- 8.1.1 Overview
- 8.1.2 Porter's Five Forces Framework
- 8.1.3 Global Value Chain Analysis
- 8.1.4 Market Dynamics (DROs)
- 8.2 Sources & References
- 8.3 List of Tables & Figures
- 8.4 Primary Insights
- 8.5 Data Pack
- 8.6 Glossary of Terms
