
|
市場調査レポート
商品コード
1692031
動物性タンパク質:市場シェア分析、産業動向・統計、成長予測(2025年~2030年)Animal Protein - Market Share Analysis, Industry Trends & Statistics, Growth Forecasts (2025 - 2030) |
||||||
カスタマイズ可能
適宜更新あり
|
|||||||
| 動物性タンパク質:市場シェア分析、産業動向・統計、成長予測(2025年~2030年) |
|
出版日: 2025年03月18日
発行: Mordor Intelligence
ページ情報: 英文 448 Pages
納期: 2~3営業日
|

全表示
- 概要
- 目次
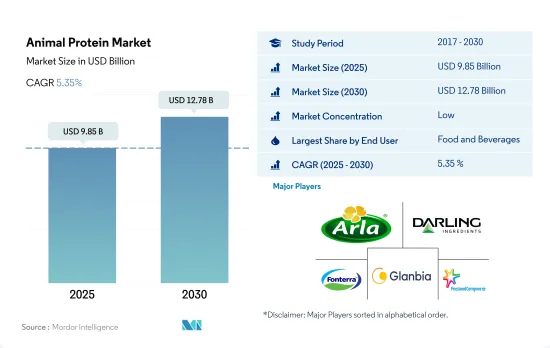
動物性タンパク質市場規模は2025年に98億5,000万米ドルと推定され、2030年には127億8,000万米ドルに達すると予測され、予測期間中(2025年~2030年)のCAGRは5.35%で成長します。
クリーンラベル食品と美容製品が市場のセグメント別成長を大きく支えています。
- 飲食品は最大の動物性タンパク質エンドユーザー・セグメントとして浮上し、主にハイエンドの高級食品に対する需要の高まりから恩恵を受けています。オーガニック、サステナブル、牧草飼育といった謳い文句が消費者の間で人気を博しているため、メーカーは適切な製品を展開するようになりました。これを受けて、Arla、Milk Specialties Global、Krugerなどのメーカーが、飲食品セグメントに適用可能なクリーンラベルの動物性タンパク質生産を拡大しています。また、このセグメントは予測期間中、金額ベースで4.29%という大幅なCAGRで推移するとみられています。
- サプリメントは2番目に大きなセグメントであり、動物飼料、パーソナルケア、化粧品がこれに続きます。サプリメントの中では、フィットネス活動の増加や消費者がワークアウトを助けるためにサプリメントを選ぶことから、スポーツ栄養サブセグメントが市場をリードしています。2022年には、サプリメント分野で消費される動物性タンパク質の74.6%をスポーツ栄養が占めました。
- 成長という点では、パーソナルケアと化粧品が他のセグメントを上回り、予測期間中の予測数量CAGRは6.64%を記録しました。タンパク質を強化したパーソナルケア製品への関心の高まりが、このセグメントの成長を牽引しています。例えば、米国女性の95%がスキンケア製品に特定の成分を求めており、ケラチンで強化された製品への関心の高まりがこの分野の成長に大きな余地を残しています。
- タンパク質食品に対する世界の受容とニーズの高まりは、市場を牽引する主な要因の1つです。2021年には、世界の消費者の約75%がタンパク質強化食品や飲食品に高い価格を支払いました。同年、世界の消費者の半数以上が10%のプレミアムを支払い、さらに15%が25%のプレミアムを支払いました。
アジア太平洋地域と北米地域がフィットネス愛好者の増加とともに需要を牽引
- 2022年の市場シェアは、中国が33.8%を占め、アジア太平洋地域が最大となりました。この需要を牽引しているのは、アクティブなライフスタイルを送るユーザーの増加と高タンパク質食への需要です。飲食品は、用途別市場において最大のセグメントとして浮上し、この地域の消費者に最も受け入れられる動物性タンパク質の消費形態として主に進化しました。特に中国では、2021年にフィットネス愛好家の約80~85%が、主なエネルギー源として、また筋肉を強化するために、プロテインパウダーやシェイクを含む高タンパク食品を選びました。さらに、同地域はCAGR 5.13%で最大のシェアを占めるほか、予測期間中は世界の成長率を上回ることになります。
- 北米は、プロテインパウダーとスナックバーのカテゴリーにおけるホエイプロテインの高集積に牽引され、そのすぐ後ろに続いています。2022年には、同地域の動物性タンパク質需要全体の約47%を乳清タンパク質が占める。同地域の消費者は健康的な食事への関心を高めており、ホエイプロテインベースの食事を好むようになっています。さらに、乳清タンパク質の平均タンパク質含有量は、乳タンパク質のような他の動物性タンパク質タイプよりも40%高く、これが同地域のスポーツ栄養セグメントのような様々なエンドユーザー・セグメントでの用途を促進しています。
- しかし、中東は最も急速に成長している地域であり、予測期間中に金額ベースで5.84%のCAGRで推移すると予測されています。機能性食品やベーカリー分野への嗜好の高まりが、UAEやサウジアラビアなどの国々で乳製品原料の需要を急増させました。加えて、UAE市場では継続的な研究開発によって旺盛な需要が増強されており、地元企業と外資系企業の両方がさらに牽引しています。
世界の動物性タンパク質市場動向
化粧品と栄養化粧品における動物性タンパク質の消費と使用が世界市場の成長を支えています。
- 動物性タンパク質の世界の消費は大幅な成長を遂げており、中でも乳製品は重要なセグメントとして拡大しています。特にアスリートの間で、乳製品タンパク質の健康上の利点に対する認識が高まっていることが、世界の一人当たりの動物性タンパク質消費に拍車をかけています。例えばインドでは、2022年から2023年にかけて、インドの消費者の37%が1日の平均牛乳摂取量を1.5~2リットルと報告し、さらに10%が1日3リットル以上摂取しています。これらの数字は、特定の地域における一人当たりの消費水準の高さを浮き彫りにしており、動物性タンパク質に対する世界の需要の大きさを裏付けています。
- さらに、動物性タンパク質の世界の消費量は依然として大きく、鶏肉がその主要部分を占めています。例えば、牛肉、豚肉、鶏肉、羊肉からのタンパク質の利用可能量は、2030年までにそれぞれ5.9%、13.1%、17.8%、15.7%増加すると予測されています。この大幅な量の伸びは、動物性蛋白源に対する世界の需要の大きさと、この需要を満たす上での鶏肉産業の重要な役割を浮き彫りにしています。さらに、牛肉、豚肉、鶏肉は大幅に消費されており、動物性タンパク質の消費パターンが浮き彫りになっています。
- 伝統的な食品用途にとどまらず、医薬品、パーソナルケア、栄養補助食品産業からのコラーゲンやゼラチンのような動物由来タンパク質に対する需要の増加が、市場の成長を大きく後押ししています。例えば、コラーゲンやゼラチンのようなタンパク質は、化粧品や栄養補助食品に広く使用されています。さまざまな用途でコラーゲンやゼラチンの動物性タンパク質に対する需要が高まっているため、予測期間中のCAGRはそれぞれ6.07%と4.70%と予想されます。
動物性タンパク質原料の供給において乳製品原料が重要な役割を果たす
- ホエイとカゼインタンパク質の生産は、主にチーズ生産工場からの供給に依存しています。カゼインとカゼイネートについては、国内工場が脱脂粉乳生産からカゼイン生産に移行する動機付けとして、1ポンド当たり約2.40米ドルの価格帯が不可欠です。2023年から2024年にかけて、世界のチーズ生産量は2,220万トンに達し、カゼイン、カゼイネート、乳清タンパク質のような乳製品タンパク質の生産状況に影響を与えました。米国は年間558万4,857トンのチーズを生産し、世界をリードしています。
- 米国では、乳原料メーカーが乳タンパク質の生産にますます特化しており、ミセルカゼイン濃縮原料の導入が拍車をかけて、2023年には生産量が倍増します。ミセルカゼインは、90%の未変性タンパク質含有量と高い生物学的利用可能カルシウムレベルを有し、2019年から2029年の間に顕著な市場浸透を達成すると予想されます。乳製品ベースのタンパク質に対する需要の高まりは、より高いタンパク質濃度を持つ原料の探索に大きく起因しています。
- アミノ酸プロファイルで知られる豚肉は、ゼラチン製造の原料です。年間2,300万頭の豚を生産するフランスは、極めて重要な役割を果たしています。この国の食肉加工産業は、10万人以上の専門家を雇用しており、欧州第2位の規模を誇っています。豚肉に続いて、水牛と牛が重要な原料として登場し、ゼラチンとコラーゲンタンパク質の生産を強化しています。インドは牛と水牛の頭数で世界をリードしており、2023年の国の牛の頭数は3億760万頭と報告されています。
動物性タンパク質産業の概要
動物性タンパク質市場は細分化されており、上位5社で29.85%を占めています。この市場の主要企業は以下の通り。 Arla Foods AmbA, Darling Ingredients Inc., Fonterra Co-operative Group Limited, Glanbia PLC and Royal FrieslandCampina NV(sorted alphabetically).
その他の特典
- エクセル形式の市場予測(ME)シート
- 3ヶ月のアナリストサポート
目次
第1章 エグゼクティブサマリーと主な調査結果
第2章 イントロダクション
- 調査の前提条件と市場定義
- 調査範囲
- 調査手法
第3章 主要産業動向
- エンドユーザー市場規模
- ベビーフードおよび乳児用調製粉乳
- ベーカリー
- 飲料
- 朝食用シリアル
- 調味料/ソース
- 菓子類
- 乳製品および乳製品代替製品
- 高齢者栄養・医療栄養
- 肉・鶏肉・魚介類および肉代替製品
- RTE/RTC食品
- スナック
- スポーツ/パフォーマンス栄養
- 動物飼料
- パーソナルケアと化粧品
- タンパク質消費動向
- 動物
- 生産動向
- 動物
- 規制の枠組み
- オーストラリア
- ブラジル、アルゼンチン
- カナダ
- 中国
- フランス
- ドイツ
- インド
- イタリア
- 日本
- 南アフリカ
- UAEおよびサウジアラビア
- 英国
- 米国
- バリューチェーンと流通チャネル分析
第4章 市場セグメンテーション
- タンパク質タイプ
- カゼインとカゼイネート
- コラーゲン
- 卵タンパク質
- ゼラチン
- 昆虫プロテイン
- ミルクプロテイン
- ホエイプロテイン
- その他の動物性タンパク質
- エンドユーザー
- 動物飼料
- 食品・飲料
- サブエンドユーザー別
- ベーカリー
- 飲料
- 朝食用シリアル
- 調味料/ソース
- 菓子類
- 乳製品・乳製品代替品
- RTE/RTC食品
- スナック
- パーソナルケアと化粧品
- サプリメント
- サブエンドユーザー別
- ベビーフードおよび乳児用調製粉乳
- 高齢者栄養と医療栄養
- スポーツ/パフォーマンス栄養
- 地域別
- アフリカ
- タンパク質タイプ別
- エンドユーザー別
- 国別
- ナイジェリア
- 南アフリカ
- その他のアフリカ
- アジア太平洋
- タンパク質タイプ別
- エンドユーザー別
- 国別
- オーストラリア
- 中国
- インド
- インドネシア
- 日本
- マレーシア
- ニュージーランド
- 韓国
- タイ
- ベトナム
- その他のアジア太平洋
- 欧州
- タンパク質タイプ別
- エンドユーザー別
- 国別
- ベルギー
- フランス
- ドイツ
- イタリア
- オランダ
- ロシア
- スペイン
- トルコ
- 英国
- その他の欧州
- 中東
- タンパク質タイプ別
- エンドユーザー別
- 国別
- イラン
- サウジアラビア
- アラブ首長国連邦
- その他の中東
- 北米
- タンパク質タイプ別
- エンドユーザー別
- 国別
- カナダ
- メキシコ
- 米国
- その他の北米
- 南米
- タンパク質タイプ別
- エンドユーザー別
- 国別
- アルゼンチン
- ブラジル
- その他の南米
- アフリカ
第5章 競合情勢
- 主要な戦略動向
- 市場シェア分析
- 企業情勢
- 企業プロファイル.
- Agrial Enterprise
- Arla Foods AmbA
- Darling Ingredients Inc.
- Fonterra Co-operative Group Limited
- GELITA AG
- Glanbia PLC
- Groupe LACTALIS
- Hilmar Cheese Company Inc.
- Jellice Pioneer Private Limited
- Kerry Group PLC
- Nitta Gelatin Inc.
- Royal FrieslandCampina NV
- Savencia Fromage & Dairy
第6章 CEOへの主な戦略的質問
第7章 付録
- 世界概要
- 概要
- ファイブフォース分析フレームワーク
- 世界のバリューチェーン分析
- 市場力学(DROs)
- 情報源と参考文献
- 図表一覧
- 主要洞察
- データパック
- 用語集
The Animal Protein Market size is estimated at 9.85 billion USD in 2025, and is expected to reach 12.78 billion USD by 2030, growing at a CAGR of 5.35% during the forecast period (2025-2030).
Clean-label food and beauty products are largely making up the segmental growth in the market
- Food and beverage emerged as the largest animal protein end-user segment, mainly benefiting from the growing demand for high-end, premium food products. Claims such as organic, sustainable, and grass-fed are gaining popularity among consumers, leading manufacturers to roll out suitable offerings. In response, manufacturers such as Arla, Milk Specialties Global, and Kruger were seen expanding their clean-label animal protein production applicable to the food and beverage segment. The segment is also set to record a significant CAGR of 4.29%, by value, during the forecast period.
- Supplements is the second-largest segment, followed by animal feed, personal care, and cosmetics. Among supplements, the sports nutrition sub-segment led the market due to increasing fitness activities and consumers opting for supplements to aid their workout regimes. In 2022, sports nutrition held a 74.6% share of animal protein consumed by the supplements sector.
- In terms of growth, personal care and cosmetics outpaced other segments, recording a projected volume CAGR of 6.64% during the forecast period. The growing interest in protein-fortified personal care products is driving the segment's growth. For instance, 95% of US females look for specific ingredients in their skincare products, leaving immense scope for segmental growth with growing interest in products fortified with keratin.
- The growing acceptance and need for protein foods globally is one of the major factors driving the market. In 2021, about 75% of global consumers paid a higher price for protein-fortified food and beverages. In the same year, more than half of global consumers paid a 10% premium, and an additional 15% paid a 25% premium.
Asia-Pacific and North America regions drive the demand with growing fitness enthusiasts in the market
- Asia-Pacific held the largest market share in 2022, led by China, which accounted for a market volume of 33.8%. The demand is driven by increasing active lifestyle users and their demand for high-protein diets. Food and beverage emerged as the largest segment in the market for applications and evolved predominantly as the most accepted form for the consumption of animal proteins by consumers in the region. Particularly in China, in 2021, about 80-85% of fitness enthusiasts chose high-protein foods, including protein powders and shakes, as a major source of energy and to strengthen muscles. In addition, besides occupying the largest share, with a value CAGR of 5.13%, the region is set to outpace the global growth rate during the forecast period.
- North America follows close behind, driven by high whey protein integration in the protein powder and snack bar categories. In 2022, whey protein accounted for about 47% of the overall animal protein demand in the region. Consumers in the region are becoming increasingly concerned about healthy eating and now prefer a whey protein-based diet. Moreover, the average protein content of whey protein is 40% higher than other animal protein types, such as milk protein, which is driving its applications in various end-user segments, such as the sports nutrition segment, in the region.
- However, the Middle East is the fastest-growing region and is projected to record a CAGR of 5.84%, by value, during the forecast period. The increasing preference for functional food and bakery sectors spiked the demand for dairy ingredients in countries like UAE and Saudi Arabia. Additionally, the strong demand is being augmented by continuous R&D in the UAE market, driven further by both local and foreign firms.
Global Animal Protein Market Trends
Consumption and usage of animal protein in cosmetics and nutricosmetics are supporting the market's growth globally
- Global consumption of animal protein is experiencing substantial growth, with dairy products representing a significant and expanding segment. Increasing awareness about the health benefits of dairy proteins, especially among athletes, is fueling global per capita animal protein consumption. For instance, in India, from 2022 to 2023, a considerable population of 37% of Indian consumers reported an average daily milk intake of 1.5 to 2 liters, while a further 10% consumed over 3 liters per day. These figures highlight the high per capita consumption levels in certain regions and underscore the substantial demand for animal protein globally.
- Further, the global consumption of animal protein remains significant, with poultry representing a major component. For instance, protein availability from beef, pork, poultry, and sheep meat is projected to grow by 5.9%, 13.1%, 17.8%, and 15.7%, respectively, by 2030. This substantial volume growth highlights the scale of global demand for animal-based protein sources and the poultry industry's considerable role in meeting this demand. Furthermore, beef, pork, and poultry are substantially consumed, highlighting animal protein consumption patterns.
- Beyond traditional food applications, the increasing demand for animal-derived proteins, like collagen and gelatin, from the pharmaceutical, personal care, and nutraceutical industries is significantly boosting the market's growth. For instance, proteins like collagen and gelatin are extensively used in cosmetics and nutraceuticals. Owing to the rising demand for collagen and gelatin animal proteins in different applications, they are anticipated to register a CAGR of 6.07% and 4.70%, respectively, during the forecast period.
Dairy ingredients play a significant role in supplying animal protein raw materials
- Whey and casein protein production primarily hinges on supply from cheese production plants, as these proteins are major byproducts of cheese. For caseins and caseinates, a price point of approximately USD 2.40 per pound is essential to motivate domestic plants to shift fluid skim milk from non-fat dry milk production to casein production. Between 2023 and 2024, global cheese production reached 22.2 million metric tons, influencing the production landscape for dairy proteins like casein, caseinates, and whey proteins. The United States produced 5,584,857 tons of cheese annually, leading the world.
- In the United States, milk ingredient manufacturers have increasingly specialized in milk protein production and witnessed a doubling in production in 2023, spurred by the introduction of micellar casein concentrate ingredients. Micellar casein, with its 90% undenatured protein content and elevated bioavailable calcium levels, is expected to achieve notable market penetration between 2019-2029. The rising demand for dairy-based proteins is largely attributed to the search for ingredients with higher protein concentrations.
- Pork, known for its amino acid profile, is the raw material for gelatin production. France, with an annual production of 23 million pigs, plays a pivotal role. The nation's meat processing industry, employing over 100,000 professionals, ranks as Europe's second-largest. Following pork, buffalo and cattle emerge as key raw materials, bolstering gelatin and collagen protein production. India has the global lead in cattle and buffalo numbers and reported its national cattle herd at 307.6 million head in 2023, a slight increase from the USDA's estimate of 307.5 million head.
Animal Protein Industry Overview
The Animal Protein Market is fragmented, with the top five companies occupying 29.85%. The major players in this market are Arla Foods AmbA, Darling Ingredients Inc., Fonterra Co-operative Group Limited, Glanbia PLC and Royal FrieslandCampina NV (sorted alphabetically).
Additional Benefits:
- The market estimate (ME) sheet in Excel format
- 3 months of analyst support
TABLE OF CONTENTS
1 EXECUTIVE SUMMARY & KEY FINDINGS
2 INTRODUCTION
- 2.1 Study Assumptions & Market Definition
- 2.2 Scope of the Study
- 2.3 Research Methodology
3 KEY INDUSTRY TRENDS
- 3.1 End User Market Volume
- 3.1.1 Baby Food and Infant Formula
- 3.1.2 Bakery
- 3.1.3 Beverages
- 3.1.4 Breakfast Cereals
- 3.1.5 Condiments/Sauces
- 3.1.6 Confectionery
- 3.1.7 Dairy and Dairy Alternative Products
- 3.1.8 Elderly Nutrition and Medical Nutrition
- 3.1.9 Meat/Poultry/Seafood and Meat Alternative Products
- 3.1.10 RTE/RTC Food Products
- 3.1.11 Snacks
- 3.1.12 Sport/Performance Nutrition
- 3.1.13 Animal Feed
- 3.1.14 Personal Care and Cosmetics
- 3.2 Protein Consumption Trends
- 3.2.1 Animal
- 3.3 Production Trends
- 3.3.1 Animal
- 3.4 Regulatory Framework
- 3.4.1 Australia
- 3.4.2 Brazil and Argentina
- 3.4.3 Canada
- 3.4.4 China
- 3.4.5 France
- 3.4.6 Germany
- 3.4.7 India
- 3.4.8 Italy
- 3.4.9 Japan
- 3.4.10 South Africa
- 3.4.11 UAE and Saudi Arabia
- 3.4.12 United Kingdom
- 3.4.13 United States
- 3.5 Value Chain & Distribution Channel Analysis
4 MARKET SEGMENTATION (includes market size in Value in USD and Volume, Forecasts up to 2030 and analysis of growth prospects)
- 4.1 Protein Type
- 4.1.1 Casein and Caseinates
- 4.1.2 Collagen
- 4.1.3 Egg Protein
- 4.1.4 Gelatin
- 4.1.5 Insect Protein
- 4.1.6 Milk Protein
- 4.1.7 Whey Protein
- 4.1.8 Other Animal Protein
- 4.2 End User
- 4.2.1 Animal Feed
- 4.2.2 Food and Beverages
- 4.2.2.1 By Sub End User
- 4.2.2.1.1 Bakery
- 4.2.2.1.2 Beverages
- 4.2.2.1.3 Breakfast Cereals
- 4.2.2.1.4 Condiments/Sauces
- 4.2.2.1.5 Confectionery
- 4.2.2.1.6 Dairy and Dairy Alternative Products
- 4.2.2.1.7 RTE/RTC Food Products
- 4.2.2.1.8 Snacks
- 4.2.3 Personal Care and Cosmetics
- 4.2.4 Supplements
- 4.2.4.1 By Sub End User
- 4.2.4.1.1 Baby Food and Infant Formula
- 4.2.4.1.2 Elderly Nutrition and Medical Nutrition
- 4.2.4.1.3 Sport/Performance Nutrition
- 4.3 Region
- 4.3.1 Africa
- 4.3.1.1 By Protein Type
- 4.3.1.2 By End User
- 4.3.1.3 By Country
- 4.3.1.3.1 Nigeria
- 4.3.1.3.2 South Africa
- 4.3.1.3.3 Rest of Africa
- 4.3.2 Asia-Pacific
- 4.3.2.1 By Protein Type
- 4.3.2.2 By End User
- 4.3.2.3 By Country
- 4.3.2.3.1 Australia
- 4.3.2.3.2 China
- 4.3.2.3.3 India
- 4.3.2.3.4 Indonesia
- 4.3.2.3.5 Japan
- 4.3.2.3.6 Malaysia
- 4.3.2.3.7 New Zealand
- 4.3.2.3.8 South Korea
- 4.3.2.3.9 Thailand
- 4.3.2.3.10 Vietnam
- 4.3.2.3.11 Rest of Asia-Pacific
- 4.3.3 Europe
- 4.3.3.1 By Protein Type
- 4.3.3.2 By End User
- 4.3.3.3 By Country
- 4.3.3.3.1 Belgium
- 4.3.3.3.2 France
- 4.3.3.3.3 Germany
- 4.3.3.3.4 Italy
- 4.3.3.3.5 Netherlands
- 4.3.3.3.6 Russia
- 4.3.3.3.7 Spain
- 4.3.3.3.8 Turkey
- 4.3.3.3.9 United Kingdom
- 4.3.3.3.10 Rest of Europe
- 4.3.4 Middle East
- 4.3.4.1 By Protein Type
- 4.3.4.2 By End User
- 4.3.4.3 By Country
- 4.3.4.3.1 Iran
- 4.3.4.3.2 Saudi Arabia
- 4.3.4.3.3 United Arab Emirates
- 4.3.4.3.4 Rest of Middle East
- 4.3.5 North America
- 4.3.5.1 By Protein Type
- 4.3.5.2 By End User
- 4.3.5.3 By Country
- 4.3.5.3.1 Canada
- 4.3.5.3.2 Mexico
- 4.3.5.3.3 United States
- 4.3.5.3.4 Rest of North America
- 4.3.6 South America
- 4.3.6.1 By Protein Type
- 4.3.6.2 By End User
- 4.3.6.3 By Country
- 4.3.6.3.1 Argentina
- 4.3.6.3.2 Brazil
- 4.3.6.3.3 Rest of South America
- 4.3.1 Africa
5 COMPETITIVE LANDSCAPE
- 5.1 Key Strategic Moves
- 5.2 Market Share Analysis
- 5.3 Company Landscape
- 5.4 Company Profiles (includes Global Level Overview, Market Level Overview, Core Business Segments, Financials, Headcount, Key Information, Market Rank, Market Share, Products and Services, and Analysis of Recent Developments).
- 5.4.1 Agrial Enterprise
- 5.4.2 Arla Foods AmbA
- 5.4.3 Darling Ingredients Inc.
- 5.4.4 Fonterra Co-operative Group Limited
- 5.4.5 GELITA AG
- 5.4.6 Glanbia PLC
- 5.4.7 Groupe LACTALIS
- 5.4.8 Hilmar Cheese Company Inc.
- 5.4.9 Jellice Pioneer Private Limited
- 5.4.10 Kerry Group PLC
- 5.4.11 Nitta Gelatin Inc.
- 5.4.12 Royal FrieslandCampina NV
- 5.4.13 Savencia Fromage & Dairy
6 KEY STRATEGIC QUESTIONS FOR PROTEIN INGREDIENTS INDUSTRY CEOS
7 APPENDIX
- 7.1 Global Overview
- 7.1.1 Overview
- 7.1.2 Porter's Five Forces Framework
- 7.1.3 Global Value Chain Analysis
- 7.1.4 Market Dynamics (DROs)
- 7.2 Sources & References
- 7.3 List of Tables & Figures
- 7.4 Primary Insights
- 7.5 Data Pack
- 7.6 Glossary of Terms

