
|
市場調査レポート
商品コード
1690974
北米の動物性タンパク質:市場シェア分析、産業動向と統計、成長予測(2025~2030年)North America Animal Protein - Market Share Analysis, Industry Trends & Statistics, Growth Forecasts (2025 - 2030) |
||||||
カスタマイズ可能
適宜更新あり
|
|||||||
| 北米の動物性タンパク質:市場シェア分析、産業動向と統計、成長予測(2025~2030年) |
|
出版日: 2025年03月18日
発行: Mordor Intelligence
ページ情報: 英文 242 Pages
納期: 2~3営業日
|

全表示
- 概要
- 目次
概要
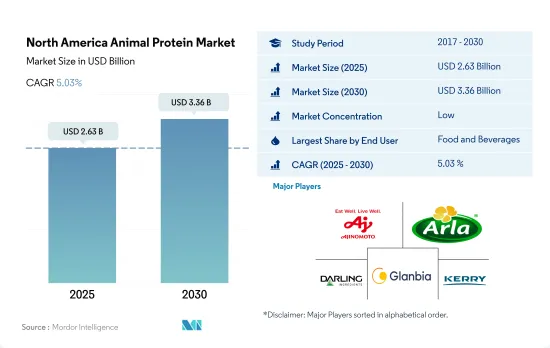
北米の動物性タンパク質市場規模は2025年に26億3,000万米ドルと推定・予測され、2030年には33億6,000万米ドルに達し、予測期間(2025~2030年)のCAGRは5.03%で成長すると予測されます。
サプリメントセグメントは、地域全体の健康志向の高まりとともに大きなシェアを占めており、同セグメントは2023~2024年に前年比成長率4.92%を記録します。
- F&Bエンドユーザーセグメント、特にスナックのサブセグメントが市場を牽引し、予測期間中に金額ベースで3.10%のCAGRで推移すると予想されます。特に動物性タンパク質に対する消費者の嗜好は、その高い栄養価と、すべてのF&Bサブセグメントで求められる起泡性、乳化性、ゲル化性などの機能性により高まっています。2021年には、米国の消費者の4人に1人が、食べるスナックを選ぶ際に「タンパク質が豊富であること」が非常に重要な品質であると回答しており、タンパク質スナックに対する需要の高さがうかがえます。これは特にミレニアル世代の消費者に当てはまる。消費者は、快適さ、エネルギー、筋肉サポート、減量、健康的な加齢など、さまざまな理由からプロテインスナックを求めています。
- サプリメントセグメントは、スポーツ栄養とパフォーマンス栄養のサブセグメントに支えられて最も急成長しているサブセグメントであり、予測期間中に金額ベースでCAGR 6.47%を記録すると予想されます。これは、ジムやフィットネスセンターでの活動を強化するために動物性タンパク質を使用する消費者が増加していることに支えられています。ホエイ・プロテインは、スポーツとパフォーマンス栄養製品に最も一般的に使用される動物性タンパク質です。ホエイ・プロテインには、筋肉の開発を助けるアミノ酸の一種である分岐鎖アミノ酸が含まれています。
- 一方、乳児用食品は、新生児の乳糖不耐症と消化器系の弱さに起因する植物性タンパク質がサブセグメントで突出しているため、レビュー期間中に市場シェアを伸ばすのに苦戦しました。米国では、2021年に3歳以下の幼児の約2.5%が牛乳アレルギーであり、これは市場にとって後退となりました。
米国は動物性肉・乳製品の消費が旺盛なため、2022年のシェアの大半を占める
- 北米諸国の中では、米国が2022年に最大の市場シェアを占めたが、これは動物性タンパク質、特に乳タンパク質の一人当たり消費量が高く、2018~2019年には75.06g/人から76.22g/人/日に増加したためです。しかし、米国はスポーツサプリメント産業からのタンパク質需要の減少により、2020~2021年の数量ベースでの前年比成長率は1.54%の減少を記録しました。この減少は、消費者がフィットネスレジームを中止し、タンパク質サプリメントへの依存度が低下したことに起因しており、その結果、スポーツ栄養サブセグメントを通じた動物性タンパク質消費量は-3.34%減少しました。
- 2022年のF&Bセグメントの前年比成長率は、肉、鶏肉、魚の米国食品価格指数が4.3%上昇し、シリアル・ベーカリー指数が2021年に2.9%上昇したため、金額ベースで1.18%に傾いた。
- しかし予測期間中、メキシコは主に飲食部門に牽引され、金額ベースで5.94%という最高のCAGRで推移すると予測されます。貿易を促進し、関税を引き下げ、経済成長を高めるために2020年7月1日に発効したカナダ・米国・メキシコ協定(CUSMA)などのイニシアチブを通じた政府の支援が、動物性タンパク質市場の成長を大きく後押ししています。
- しかし、カナダが第2位の市場シェアを占め、2016~2022年にかけて数量ベースで約15%の大幅な成長を観察しています。国内生産量が多いため、カナダでは2019年の6万5,320トンから2020年には約7万2,360トンのプロセスチーズが生産されました。昆虫タンパク質は、動物飼料セグメントで人気を集めており、2022年には1kgあたり5.9米ドルに達すると推定される低価格のため、2021年には7.90%というレビュー期間全体で最も高い前年比成長率を観測しました。
北米動物性タンパク質市場の動向
動物性タンパク質の消費拡大が、原料セグメントの主要企業のビジネス機会を促進
- 菜食主義者の増加にもかかわらず、米国では動物性タンパク質の需要は安定しています。米国人の食生活におけるタンパク質の大半は牛肉と鶏肉から摂取されており、次いで乳製品が多いです。2022年には、米国の成人消費者の80%が、豚肉、牛肉、鶏肉、魚を主要タンパク源として好んでいます。ゼラチンは水と結合する性質があるため、機能性食品産業での利用が拡大していることが市場を大きく牽引しています。
- 消費者は伝統的タンパク質の選択肢を求め続けているが、動物性タンパク質産業に対して、環境問題にもっと取り組むよう期待を示しています。幅広い用途と健康的なライフスタイルに対する消費者の嗜好により、米国の多くの原料メーカーがコラーゲン市場への参入を試みており、これが一人当たりの消費パターンの増加の主要理由となっています。2019~2021年にかけて、米国における医師が診断した関節炎の未調整有病率は、女性で24.2%、男性で17.9%でした。この地域における関節炎の有病率に起因して、骨と関節の健康のためのコラーゲンベースのサプリメントに対する需要が増加しています。
- 付加価値の高い乳製品が、カナダにおける一人当たりの乳タンパク質消費を牽引しています。流動乳、チーズ、クリーム、ヨーグルトは、カナダで主に消費されている乳製品です。2022年の国内牛乳消費量は1,024万3,000MTでした。2022~2023年の販売データによると、カナダ人は全乳(バター脂肪率3.25%)を多く消費し、スキムミルク(バター脂肪率0%)、低脂肪乳をあまり消費していないです。カナダ人は適度な量の赤身肉を食べる。一人当たりの牛肉と鶏肉の消費量は、豚肉と羊肉に比べてカナダでは多いです。
肉と牛乳の生産は、動物性タンパク質原料として大きく貢献しています。
- グラフは、牛、豚、鶏の肉(骨付き、生、チルド)、牛とヤギの生乳、牛のスキムミルク、乾燥ホエイ粉末の生産データです。2023年の牛1頭当たりの生乳生産量は240万8,7ポンドで、2020年の2万3,777ポンドから1.30%増加しました。2022年現在、米国の平均乳牛頭数は9,402頭です。牛乳は通常、様々なプロセスを経て成分に分離され、流動性のある飲料用ミルクやその他の乳製品の製造に加工されます。
- 米国は世界最大の鶏肉生産国であり、2023年には世界の鶏肉生産量の20%のシェアを占めています。牛肉はコラーゲンの最も一般的な供給源のひとつであり、このユニークなタンパク質を大量に供給しています。世界最大の肥育牛産業である米国は、牛肉の世界最大の生産国でもあり、主に国内と輸出用の高品質の穀物肥育牛肉です。
- カナダの牛乳生産の70%近くは、ケベック州とオンタリオ州に集中しています。カナダで生産される生乳は2つの市場に供給されます。直接消費用の流動乳、クリーム、フレーバーミルクを含む流動乳市場と、工業用生乳市場です。FAS/Canadaは、2024年の生乳総生産量が1,031万トン(MMT)に達すると予測しており、2023年予測の1,026万5,000トンから緩やかに増加します。カナダの食肉加工企業は、生肉や冷凍肉から加工肉、燻製肉、缶肉、調理肉まで、多種多様な食肉製品を製造しています。カナダでは、ソーセージやコールドカットなどの加工肉の約70%が豚肉で作られています。
北米動物性タンパク質産業概要
北米動物性タンパク質市場はセグメント化されており、上位5社で21.18%を占めています。この市場の主要企業は、Ajinomoto Co. Inc.、Arla Foods amba、Darling Ingredients Inc.、Glanbia PLC、Kerry Group PLCなどです。
その他の特典
- エクセル形式の市場予測(ME)シート
- 3ヶ月のアナリストサポート
目次
第1章 エグゼクティブサマリーと主要調査結果
第2章 イントロダクション
- 調査の前提条件と市場定義
- 調査範囲
- 調査手法
第3章 主要産業動向
- エンドユーザー市場規模
- ベビーフードと乳児用調製粉乳
- ベーカリー
- 飲料
- 朝食用シリアル
- 調味料/ソース
- 菓子類
- 乳製品と乳製品代替製品
- 高齢者栄養・医療栄養
- 肉・鶏肉・魚介類と肉代替製品
- RTE/RTC食品
- スナック
- スポーツ/パフォーマンス栄養
- 動物飼料
- パーソナルケアと化粧品
- タンパク質消費動向
- 動物
- 生産動向
- 動物
- 規制の枠組み
- カナダ
- 米国
- バリューチェーンと流通チャネル分析
第4章 市場セグメンテーション
- タンパク質タイプ
- カゼインとカゼイネート
- コラーゲン
- 卵タンパク質
- ゼラチン
- 昆虫プロテイン
- ミルクプロテイン
- ホエイプロテイン
- その他動物性タンパク質
- エンドユーザー
- 動物飼料
- 飲食品
- サブエンドユーザー別
- ベーカリー
- 飲料
- 朝食用シリアル
- 調味料/ソース
- 菓子類
- 乳製品・乳製品代替品
- RTE/RTC食品
- スナック
- パーソナルケアと化粧品
- サプリメント
- サブエンドユーザー別
- ベビーフードと乳児用調製粉乳
- 高齢者栄養と医療栄養
- スポーツ/パフォーマンス栄養
- 国別
- カナダ
- メキシコ
- 米国
- その他の北米地域
第5章 競争情勢
- 主要な戦略動向
- 市場シェア分析
- 企業情勢
- 企業プロファイル
- Agropur Dairy Cooperative
- Ajinomoto Co. Inc.
- Arla Foods amba
- Darling Ingredients Inc.
- Farbest-Tallman Foods Corporation
- Glanbia PLC
- Groupe Lactalis
- Kerry Group PLC
- Milk Specialties Global
- Tessenderlo Group
第6章 CEOへの主要戦略的質問
第7章 付録
- 世界概要
- 概要
- ファイブフォース分析フレームワーク
- 世界のバリューチェーン分析
- 市場力学(DROs)
- 情報源と参考文献
- 図表一覧
- 主要な洞察
- データパック
- 用語集
目次
Product Code: 90074
The North America Animal Protein Market size is estimated at 2.63 billion USD in 2025, and is expected to reach 3.36 billion USD by 2030, growing at a CAGR of 5.03% during the forecast period (2025-2030).
Supplements segment holds significant share with growing health conscious consumer across the region, the segment will register y-o-y growth of 4.92% from 2023-2024
- The F&B end-user segment, particularly the snacks sub-segment, drives the market and is expected to register a CAGR of 3.10% by value during the forecast period. Consumer preference for animal protein, in particular, is growing owing to its high nutritional value and functional qualities like foaming, emulsification, gelling, etc., which are sought after by all F&B sub-segments. In 2021, one in four US consumers said that "rich in protein" is a very important quality when choosing which snacks to eat, indicating the high demand for protein snacks. This holds for millennial consumers in particular. Consumers are looking for protein snacks for various reasons, including comfort, energy, muscle support, weight loss, and healthy aging.
- The supplements segment, aided by the sports and performance nutrition sub-segment, is the fastest-growing sub-segment and is expected to record a CAGR of 6.47% by value during the forecast period. This is supported by the growing number of consumers using animal protein to enhance their activities at gyms and fitness centers. Whey protein is the most commonly used animal protein in sports and performance nutrition products. Whey protein contains branched-chain amino acids, a type of amino acid that aids in muscle development.
- On the other hand, infant foods struggled to gain market share over the review period, owing to the prominence of plant protein in the sub-segment, which stemmed from newborns' lactose intolerance and weaker digestive systems. In the United States, about 2.5% of children under the age of three were allergic to milk in 2021, which was a setback for the market.
United states accounted for majority of the share in 2022 due to strong consumption of animal-based meat and dairy products
- Among countries in North America, the United States accounted for the largest market share in 2022 due to the high per capita consumption of animal proteins, especially dairy proteins, which increased from 75.06 to 76.22 g/capita/day in 2018-2019. However, the United States recorded a reduced Y-o-Y growth rate of 1.54% by volume in 2020-2021 due to decreased protein demand from the sports supplement industry. This decrease was attributed to consumers' halted fitness regimes and reduced dependence on protein supplements, resulting in a -3.34% decline in animal protein consumption through the sports nutrition sub-segment.
- The Y-o-Y growth rate of the F&B segment inclined to 1.18% by value in 2022 due to the US food price index for meat, poultry, and fish, which increased by 4.3%, and the cereal and bakery index that increased by 2.9% in 2021.
- However, during the forecast period, Mexico is projected to record the highest CAGR of 5.94% by value, primarily driven by the F&B sector. Government support through initiatives such as the Canada-United States-Mexico Agreement (CUSMA), which went into effect on July 1, 2020, to promote trade, lower tariffs, and increase economic growth, has significantly boosted the animal protein market growth.
- However, Canada accounts for the second-largest market share, observing a significant growth of around 15% by volume from 2016 to 2022. Due to the high domestic production in the country, about 72,360 ton of processed cheese were produced in Canada in 2020, up from 65,320 ton in 2019. Insect proteins are gaining popularity in the animal feed segment and observed the highest Y-o-Y growth rate during the entire review period of 7.90% in 2021 due to their low prices, estimated to reach USD 5.9 per kg in 2022.
North America Animal Protein Market Trends
The consumption growth of animal protein is fueling opportunities for key players in the ingredients segment
- Despite the rising vegan population, the demand for animal protein has been steady in the United States. The majority of protein in the American diet comes from beef and poultry, followed by dairy. In 2022, 80% of US adult consumers preferred pork, beef, poultry, and fish as their main protein sources. Due to its water-binding properties, the market is majorly driven by the growing usage of gelatin in the functional food industry.
- Consumers continue to demand traditional protein options, but they are signaling an expectation of the animal protein industry to do more to address environmental concerns. With a wide range of applications and consumer preferences toward a healthy lifestyle, many US ingredient manufacturers are trying to enter the collagen market, which is the major reason for the increase in per capita consumption patterns. From 2019 to 2021, the unadjusted prevalence of doctor-diagnosed arthritis in the United States was 24.2% among women and 17.9% among men. Owing to the prevalence of arthritis in the region, there is an increasing demand for collagen-based supplements for bone and joint health.
- Value-added dairy products drive the per capita consumption of milk protein in Canada. Fluid milk, cheese, cream, and yogurt are the dairy products mainly consumed in the country. In 2022, domestic cow milk consumption amounted to 10,243 thousand MT. The marketing year 2022-2023 sales data indicated that Canadians spent more on whole milk (3.25 % butterfat), less skim milk (0% butterfat), and reduced-fat milk. Canadians eat a moderate amount of red meat. Per capita consumption of beef and poultry is high in Canada compared to pig meat and sheep meat.
Meat and milk production contribute majorly as raw materials for animal protein ingredients
- The graph given depicts the production data for raw materials such as meat of cattle, pigs, and chicken (with bone, fresh or chilled), raw milk from cattle and goats, skim milk from cows, and dry whey powder. In 2023, 2,408,7 pounds of milk was produced per cow, an increase of 1.30% from 23,777 pounds in 2020. As of 2022, the average number of milk cows in the United States was 9,402. Milk is usually separated through various processes into components and processed into fluid beverage milk or the manufacture of other dairy products.
- The United States is the world's largest producer of chicken meat and accounted for a 20% share of global chicken meat production in 2023. Cattle meat is one of the most common sources of collagen, providing a significant amount of this unique protein. With the largest fed-cattle industry in the world, the United States is also the world's largest producer of cattle meat, primarily high-quality, grain-fed cattle meat for domestic and export use.
- Nearly 70% of Canada's milk production is concentrated in Quebec and Ontario. Milk produced in Canada supplies two markets: the fluid milk market, which includes fluid milk for direct consumption, creams, and flavored milk, and the industrial milk market. FAS/Canada forecasts total milk production to reach 10.310 million metric tons (MMT) in 2024, a modest increase from the 2023 estimate of 10.265 MMT. Canada's meat processing companies manufacture a wide variety of meat products, ranging from fresh and frozen meat to processed, smoked, canned, and cooked meats. About 70% of processed meats in Canada, such as sausages or cold cuts, are made with pork.
North America Animal Protein Industry Overview
The North America Animal Protein Market is fragmented, with the top five companies occupying 21.18%. The major players in this market are Ajinomoto Co. Inc., Arla Foods amba, Darling Ingredients Inc., Glanbia PLC and Kerry Group PLC (sorted alphabetically).
Additional Benefits:
- The market estimate (ME) sheet in Excel format
- 3 months of analyst support
TABLE OF CONTENTS
1 EXECUTIVE SUMMARY & KEY FINDINGS
2 INTRODUCTION
- 2.1 Study Assumptions & Market Definition
- 2.2 Scope of the Study
- 2.3 Research Methodology
3 KEY INDUSTRY TRENDS
- 3.1 End User Market Volume
- 3.1.1 Baby Food and Infant Formula
- 3.1.2 Bakery
- 3.1.3 Beverages
- 3.1.4 Breakfast Cereals
- 3.1.5 Condiments/Sauces
- 3.1.6 Confectionery
- 3.1.7 Dairy and Dairy Alternative Products
- 3.1.8 Elderly Nutrition and Medical Nutrition
- 3.1.9 Meat/Poultry/Seafood and Meat Alternative Products
- 3.1.10 RTE/RTC Food Products
- 3.1.11 Snacks
- 3.1.12 Sport/Performance Nutrition
- 3.1.13 Animal Feed
- 3.1.14 Personal Care and Cosmetics
- 3.2 Protein Consumption Trends
- 3.2.1 Animal
- 3.3 Production Trends
- 3.3.1 Animal
- 3.4 Regulatory Framework
- 3.4.1 Canada
- 3.4.2 United States
- 3.5 Value Chain & Distribution Channel Analysis
4 MARKET SEGMENTATION (includes market size in Value in USD and Volume, Forecasts up to 2030 and analysis of growth prospects)
- 4.1 Protein Type
- 4.1.1 Casein and Caseinates
- 4.1.2 Collagen
- 4.1.3 Egg Protein
- 4.1.4 Gelatin
- 4.1.5 Insect Protein
- 4.1.6 Milk Protein
- 4.1.7 Whey Protein
- 4.1.8 Other Animal Protein
- 4.2 End User
- 4.2.1 Animal Feed
- 4.2.2 Food and Beverages
- 4.2.2.1 By Sub End User
- 4.2.2.1.1 Bakery
- 4.2.2.1.2 Beverages
- 4.2.2.1.3 Breakfast Cereals
- 4.2.2.1.4 Condiments/Sauces
- 4.2.2.1.5 Confectionery
- 4.2.2.1.6 Dairy and Dairy Alternative Products
- 4.2.2.1.7 RTE/RTC Food Products
- 4.2.2.1.8 Snacks
- 4.2.3 Personal Care and Cosmetics
- 4.2.4 Supplements
- 4.2.4.1 By Sub End User
- 4.2.4.1.1 Baby Food and Infant Formula
- 4.2.4.1.2 Elderly Nutrition and Medical Nutrition
- 4.2.4.1.3 Sport/Performance Nutrition
- 4.3 Country
- 4.3.1 Canada
- 4.3.2 Mexico
- 4.3.3 United States
- 4.3.4 Rest of North America
5 COMPETITIVE LANDSCAPE
- 5.1 Key Strategic Moves
- 5.2 Market Share Analysis
- 5.3 Company Landscape
- 5.4 Company Profiles (includes Global Level Overview, Market Level Overview, Core Business Segments, Financials, Headcount, Key Information, Market Rank, Market Share, Products and Services, and Analysis of Recent Developments).
- 5.4.1 Agropur Dairy Cooperative
- 5.4.2 Ajinomoto Co. Inc.
- 5.4.3 Arla Foods amba
- 5.4.4 Darling Ingredients Inc.
- 5.4.5 Farbest-Tallman Foods Corporation
- 5.4.6 Glanbia PLC
- 5.4.7 Groupe Lactalis
- 5.4.8 Kerry Group PLC
- 5.4.9 Milk Specialties Global
- 5.4.10 Tessenderlo Group
6 KEY STRATEGIC QUESTIONS FOR PROTEIN INGREDIENTS INDUSTRY CEOS
7 APPENDIX
- 7.1 Global Overview
- 7.1.1 Overview
- 7.1.2 Porter's Five Forces Framework
- 7.1.3 Global Value Chain Analysis
- 7.1.4 Market Dynamics (DROs)
- 7.2 Sources & References
- 7.3 List of Tables & Figures
- 7.4 Primary Insights
- 7.5 Data Pack
- 7.6 Glossary of Terms

