
南米の動物性タンパク質:市場シェア分析、産業動向と統計、成長予測(2025年~2030年)
South America Animal Protein - Market Share Analysis, Industry Trends & Statistics, Growth Forecasts (2025 - 2030)- 発行日
- ページ情報
- 英文 231 Pages
- 納期
- 2~3営業日
- 商品コード
- 1692024
- カスタマイズ可能 お客様のご希望に応じて、既存データの加工や未掲載情報(例:国別セグメント)の追加などの対応が可能です。詳細はお問い合わせください。
- 適宜更新あり 本レポートは最新情報反映のため適宜更新し、内容構成変更を行う場合があります。ご検討の際はお問い合わせください。
- 翻訳ツール提供対象 PDF対応AI翻訳ツールの無料貸し出しサービスのご利用が可能です
概要
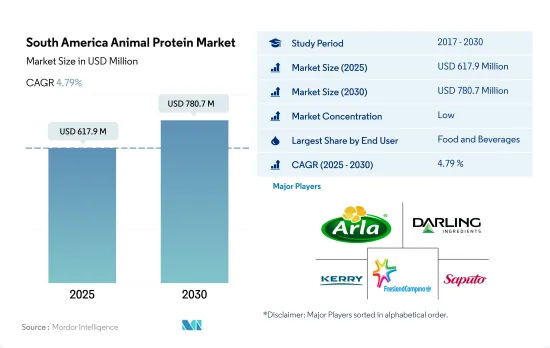
南米の動物性タンパク質市場規模は2025年に6億1,790万米ドルと推計され、2030年には7億8,070万米ドルに達すると予測され、予測期間中(2025年~2030年)のCAGRは4.79%で成長します。
機能性と適合性に基づく卓越した用途とタンパク質強化製品の需要増が飲食品分野を牽引
- エンドユーザー別では、F&B産業がこの地域における動物性タンパク質の主要用途分野です。F&B分野の主なサブセグメントはベーカリーおよび乳製品/乳製品代替品で、2022年には両者とも総量の46%以上を占める。ゼラチンは、タンパク質を添加し、焼き菓子の透明ゲル化剤および増粘剤として機能するため、ベーカリー分野で最も使用されているタンパク質であることに変わりはないです。
- F&Bセグメントに加え、サプリメント・セグメントが最も高い用途シェアを占め、2022年には78%をスポーツ栄養サブセグメントが占めたが、これは主にこの地域全体で肥満が増加しているためです。人口の28.3%が太りすぎのアルゼンチンは、2021年に南米で最も肥満の多い国となりました。人口の28%が肥満のチリは2位。27.9%のウルグアイは3位です。しかし、乳清タンパク質を強化したパーソナルケア分野は、肌を滑らかにし、髪を整えるという機能性により、(2023~2029年の)CAGR値が4.43%と最も高くなると予測されています。
- 乳製品と乳製品代替品は、この地域における動物性タンパク質のもう一つの重要な分野であり、調査期間中に3.19%のCAGRを記録しました。売上の増加は、チーズ製造における凝固剤としてのカゼインの使用と、乳製品デザートカテゴリーにおけるタンパク質強化の継続的動向に起因します。アイスクリームやヨーグルトのような製品のメーカーは、「高タンパク質」や「タンパク質添加」を謳うために、既存製品のタンパク質強化バージョンを発売しています。その結果、カゼインとカゼイネート(チーズ産業に応用されている)に次いで、乳清タンパク質と乳タンパク質が、この分野で最も使用されている動物性タンパク質となりました。これらのタンパク質は、口当たり、粘度、構造を改善するためにも添加されます。
ブラジルとその他南米がフィットネスとスポーツ活動への関与の増加とともにセグメント成長を牽引しています。
- 国別では、ブラジルが2022年に最大のシェアを占め、F&Bとサプリメント部門からの動物性タンパク質需要が売上を独占しました。このような高い需要の背景には、2050年までに3倍になると推定される同国の高齢化があります。懸念の高まりに伴い、消費者のフィットネスやスポーツ活動への参加はますます増えており、サプリメント消費者の中で非運動人口の割合が増加しています。その結果、ブラジルは予測期間中のCAGRが6.72%となり、南米諸国の中で最も速い成長の可能性を記録すると予想されます。
- この地域の酪農産業は非常に発達しているため、南米諸国の牛乳生産量は非常に高いです。ブラジルとアルゼンチンは南米大陸の主要な生乳生産国です。チリとウルグアイも主要な生乳生産国として台頭してきています。そのため、この地域には乳タンパク質生産のための原料が常に安定して供給されています。乳製品および乳製品代替品とベーカリーは、この地域における動物性タンパク質の最大のエンドユーザー分野であり、2022年には総量の46%以上を占める。
- 飲食品は最大のエンドユーザーセグメントであり、同地域の動物性タンパク質販売総量の73.5%以上を占めています。このセグメントの売上の大部分は乳製品および乳製品代替品のサブセグメントによるもので、調査期間中のCAGRは3.19%を記録しました。南米では2020年に6,641万2,000トンの子牛のミルクが生産され、乳製品タンパク質の原料となるかなりの量が供給されました。この地域の広範な生乳生産により、ArlaやFonterraのような主要企業は乳製品原料生産工場を設立しています。
南米の動物性タンパク質市場動向
消費に影響を与えるタンパク質豊富な食事への嗜好の高まり
- グラフは南米各国の一人当たりの動物性タンパク質消費量を示しています。経済的課題にもかかわらず、南米では健康とウェルネス製品への意欲が高まっています。骨粗鬆症や関節の健康など、運動関連の健康問題に対する懸念は消費者にとって最も重要です。その結果、コラーゲンメーカーはこの需要を満たすため、栄養補助食品メーカーをターゲットにするようになっています。2018年には、ブラジルがこの地域をリードし、健康・ウェルネス製品の消費額は217億米ドルを超えました。この地域はまた、心血管問題や糖尿病などの疾患の急増に取り組んでおり、動物由来の栄養補助食品へのシフトを促しています。
- 南米の消費者は食生活と健康の関連性をより強く認識するようになっており、市場の拡大を後押ししています。機能性食品や栄養強化食品への旺盛な需要に後押しされ、タンパク質が豊富な食品の売上が急増しています。消費者は日々の食生活において、天然素材やオーガニックの選択肢を明らかに選好しています。特にアルゼンチンでは、2022年までに有機パッケージ食品と飲料の消費が2020年比で125%増加するという驚異的な数字が示されました。
- ブラジル人の化粧品志向は顕著で、業界各社はコラーゲンやゼラチンペプチドへの投資を活発化させています。これらのペプチドは栄養補助食品だけでなく化粧品にも応用されています。最適な肌の健康のために、ブラジル人は2.5グラムのコラーゲンペプチドを摂取するよう勧められています。関節リウマチや骨粗しょう症などの問題により、2020年には死亡率が16%上昇するといった驚くべき健康統計は、今後数年間でコラーゲンペプチドベースのサプリメントの需要が急増すると予想されることを裏付けています。
動物性タンパク質原料メーカーの原料として、牛乳と食肉の生産が大きく貢献しています。
- グラフは、南米における主要原材料の生産動向を示しています。骨付き牛・豚の生肉、生鮮・冷蔵肉、牛・ヤギの生乳、牛の脱脂乳、乾燥ホエイパウダーなどです。鶏肉生産が課題に直面している一方で、乳タンパク質、乳清タンパク質、カゼイン、カゼイン酸塩のような他の動物性タンパク質は、主原料として牛乳に大きく依存しています。主に悪天候と経済状況による2019年の落ち込みの後、生乳生産は2020年に力強く回復しました。しかし、この明るい勢いは、現在進行中のCOVID-19パンデミックに起因する不確実性によって影を潜めています。アルゼンチンとウルグアイの2020年上半期の累計成長率はそれぞれ8.7%と3.9%でした。さらに、コロンビアやチリといった太平洋沿岸の純輸入国も顕著な生産量の増加を経験しました。
- アルゼンチンはこの地域の重要な生乳生産国として際立っています。しかし、このセクターは、貿易介入主義や重い税負担を特徴とする政府の政策による課題に直面しており、これが経営の複雑化や投資の減少につながっています。こうしたハードルにもかかわらず、アルゼンチンの2021年の生乳総生産量は2020年比で4%増加しました。この地域はまた、食肉処理活動からコラーゲンやゼラチンのような動物性タンパク質を得ています。一方、ブラジルは、生産効率、疾病管理、サプライチェーンの透明性への投資を重視し、牛肉生産を強化し続けています。特筆すべきは、ブラジルの牛肉生産性の急上昇は、20年間で1,700万頭近く増加した国内牛群の大幅な増加に大きく起因していることです。
南米の動物性タンパク質産業の概要
南米の動物性タンパク質市場は断片化されており、上位5社で13.77%を占めています。この市場の主要企業は以下の通り。 Arla Foods amba, Darling Ingredients Inc., Kerry Group plc, Royal FrieslandCampina N.V and Saputo Inc(sorted alphabetically).
その他の特典
- エクセル形式の市場予測(ME)シート
- 3ヶ月のアナリストサポート
目次
第1章 エグゼクティブサマリーと主な調査結果
第2章 イントロダクション
- 調査の前提条件と市場定義
- 調査範囲
- 調査手法
第3章 主要産業動向
- エンドユーザー市場規模
- ベビーフードおよび乳児用調製粉乳
- ベーカリー
- 飲料
- 朝食用シリアル
- 調味料/ソース
- 菓子類
- 乳製品および乳製品代替製品
- 高齢者栄養・医療栄養
- 肉・鶏肉・魚介類および肉代替製品
- RTE/RTC食品
- スナック
- スポーツ/パフォーマンス栄養
- 動物飼料
- パーソナルケアと化粧品
- タンパク質消費動向
- 動物
- 生産動向
- 動物
- 規制の枠組み
- ブラジルとアルゼンチン
- バリューチェーンと流通チャネル分析
第4章 市場セグメンテーション
- タンパク質タイプ
- カゼインとカゼイネート
- コラーゲン
- 卵タンパク質
- ゼラチン
- 昆虫プロテイン
- ミルクプロテイン
- ホエイプロテイン
- その他動物性タンパク質
- エンドユーザー
- 動物飼料
- 食品・飲料
- サブエンドユーザー別
- ベーカリー
- 飲料
- 朝食用シリアル
- 調味料/ソース
- 菓子類
- 乳製品・乳製品代替品
- RTE/RTC食品
- スナック
- パーソナルケアと化粧品
- サプリメント
- サブエンドユーザー別
- ベビーフードおよび乳児用調製粉乳
- 高齢者栄養と医療栄養
- スポーツ/パフォーマンス栄養
- 国別
- アルゼンチン
- ブラジル
- その他の南米
第5章 競合情勢
- 主要な戦略動向
- 市場シェア分析
- 企業情勢
- 企業プロファイル.
- Arla Foods amba
- Darling Ingredients Inc.
- GELITA AG
- Gelnex
- Hilmar Cheese Company, Inc.
- Kerry Group plc
- Lactoprot Deutschland GmbH
- Royal FrieslandCampina N.V
- Saputo Inc
- Sooro Renner Nutricao S.A.
- Tangara Foods S.A
第6章 CEOへの主な戦略的質問
第7章 付録
- 世界概要
- 概要
- ファイブフォース分析フレームワーク
- 世界のバリューチェーン分析
- 市場力学(DROs)
- 情報源と参考文献
- 図表一覧
- 主要洞察
- データパック
- 用語集
目次
The South America Animal Protein Market size is estimated at 617.9 million USD in 2025, and is expected to reach 780.7 million USD by 2030, growing at a CAGR of 4.79% during the forecast period (2025-2030).
Prominent application based on functionality and suitability with growing demand protein-enriched products drive the food and beverages sector
- By end-user, the F&B industry is the leading application sector for animal protein in the region. The key sub-segments of the F&B segment are bakery and dairy/dairy alternatives, both of which accounted for more than 46% of the total volume in 2022. Gelatin remains the most used protein in the bakery sector as it adds protein and acts as a transparent gelling and thickening agent in baked goods.
- In addition to the F&B segment, the supplements segment had the highest application share, with 78% of the application dominated by the sports nutrition sub-segment in 2022, primarily due to rising obesity across the region. Argentina, whose 28.3% of the population is overweight, was the most obese country in South America in 2021. With 28% of its population obese, Chile ranks second. With 27.9%, Uruguay ranks third. However, the whey protein-enriched personal care sector is projected to register the highest CAGR value of 4.43% in (2023-2029), owing to its functionalities as a skin smoothening and hair conditioning agent.
- Dairy and dairy alternatives is another important segment for animal proteins in the region, and it recorded a CAGR of 3.19% during the study period. The rise in sales comes with the usage of casein as a coagulant in cheese manufacture, along with the ongoing trend of protein fortification in the dairy desserts category. Manufacturers of products like ice creams and yogurts have launched protein-enriched versions of their existing products to make the "high protein" and "added protein" claims. As a result, after casein and caseinates (which has application in the cheese industry), whey protein and milk protein were the most used animal proteins in the segment. These proteins are also added to improve mouthfeel, viscosity, and structure.
Brazil followed by Rest of South America with increasing involvement in fitness and sports activities lead the segmental growth
- By country, Brazil claimed the largest share in 2022, with the animal protein demand from the F&B and supplements sectors dominating the sales. This high demand can be attributed to the country's aging population, which is estimated to triple by 2050, covering around 66 million Brazilians. In line with growing concerns, consumers are increasingly getting involved in fitness and sports activities, increasing the proportion of the non-athletic population among supplement consumers. As a result, Brazil is expected to record the fastest growth potential among all South American countries, with a CAGR of 6.72% during the forecast period.
- The dairy industry in the region is very well developed, so milk production is very high in South American countries. Brazil and Argentina are the major milk-producing countries in the continent. Chile and Uruguay are also emerging as major milk-producing countries. Therefore, the region always has a consistent supply of raw materials for dairy protein production. Dairy and dairy alternatives and bakery were the largest end-user segments for animal proteins in the region, representing over 46% of the total volume in 2022.
- Food and beverage was the largest end-user segment, with over 73.5% of the total volume of animal protein sales in the region. The majority of the sales in the segment come from the dairy and dairy alternatives sub-segment, which recorded a CAGR of 3.19% during the study period. South America produced 66.412 million ton of calf milk in 2020, which provided a sizable amount of the raw materials used to make dairy proteins. Due to the region's extensive milk production, key players like Arla and Fonterra have established dairy ingredient production plants.
South America Animal Protein Market Trends
Increasing preference for protein rich diet to influence consumption
- The graph illustrates the per capita consumption of animal protein across South American countries. Despite economic challenges, South America is witnessing a growing appetite for health and wellness products. Concerns over mobility-related health issues, such as osteoporosis and joint health, are paramount for consumers. Consequently, collagen manufacturers are increasingly targeting dietary supplement producers to meet this demand. In 2018, Brazil led the region, with health and wellness product consumption exceeding USD 21.7 billion. The region is also grappling with a surge in diseases like cardiovascular issues and diabetes, prompting a shift towards animal-based dietary supplements.
- South American consumers are becoming more cognizant of the link between diet and health, propelling the market's expansion. The sales of protein-rich foods are surging, driven by a heightened appetite for functional and fortified foods. Consumers are showing a clear preference for natural and organic options in their daily diets. Notably, by 2022, Argentina saw a staggering 125% rise in organic packaged food and beverage consumption from 2020.
- Brazilians exhibit a pronounced inclination towards cosmetics, prompting industry players to ramp up investments in collagen and gelatin peptides. These peptides find applications not just in dietary supplements but also in cosmetics. For optimal skin health, Brazilians are advised to consume 2.5 grams of collagen peptides. Alarming health statistics, such as a 16% rise in the mortality rate in 2020 due to issues like rheumatoid arthritis and osteoporosis, underscore the anticipated surge in demand for collagen peptide-based supplements in the coming years.
Milk and meat production contributes majorly as raw material for animal protein ingredients manufacturers
- The graph illustrates the production trends of key raw materials in South America, including cattle and pig meat with bone, fresh or chilled; raw milk from cattle and goats; skim milk from cows; and dry whey powder. Notably, while chicken meat production faced challenges, other animal proteins, like milk proteins, whey proteins, casein, and caseinates, rely heavily on milk as their primary raw material. After a dip in 2019, primarily due to adverse weather and economic conditions, milk production rebounded strongly in 2020. However, this positive momentum is now overshadowed by the uncertainties stemming from the ongoing COVID-19 pandemic. Argentina and Uruguay saw year-to-date growth rates of 8.7% and 3.9%, respectively, in the first half of 2020. Additionally, net importing nations on the Pacific coast, such as Colombia and Chile, also experienced notable production upticks.
- Argentina stands out as a significant milk producer in the region. Yet, the sector faces challenges due to government policies, marked by trade interventionism and a heavy tax burden, leading to operational complexities and reduced investments. Despite these hurdles, Argentina managed a 4% increase in total milk output in 2021 compared to 2020. The region also derives animal proteins like collagen and gelatin from its meat slaughtering activities. Brazil, on the other hand, continues to bolster its beef production, emphasizing investments in production efficiency, disease control, and supply chain transparency. Notably, Brazil's beef productivity surge is largely attributed to a substantial increase in its national herd, which grew by nearly 17 million heads over two decades.
South America Animal Protein Industry Overview
The South America Animal Protein Market is fragmented, with the top five companies occupying 13.77%. The major players in this market are Arla Foods amba, Darling Ingredients Inc., Kerry Group plc, Royal FrieslandCampina N.V and Saputo Inc (sorted alphabetically).
Additional Benefits:
- The market estimate (ME) sheet in Excel format
- 3 months of analyst support
TABLE OF CONTENTS
1 EXECUTIVE SUMMARY & KEY FINDINGS
2 INTRODUCTION
- 2.1 Study Assumptions & Market Definition
- 2.2 Scope of the Study
- 2.3 Research Methodology
3 KEY INDUSTRY TRENDS
- 3.1 End User Market Volume
- 3.1.1 Baby Food and Infant Formula
- 3.1.2 Bakery
- 3.1.3 Beverages
- 3.1.4 Breakfast Cereals
- 3.1.5 Condiments/Sauces
- 3.1.6 Confectionery
- 3.1.7 Dairy and Dairy Alternative Products
- 3.1.8 Elderly Nutrition and Medical Nutrition
- 3.1.9 Meat/Poultry/Seafood and Meat Alternative Products
- 3.1.10 RTE/RTC Food Products
- 3.1.11 Snacks
- 3.1.12 Sport/Performance Nutrition
- 3.1.13 Animal Feed
- 3.1.14 Personal Care and Cosmetics
- 3.2 Protein Consumption Trends
- 3.2.1 Animal
- 3.3 Production Trends
- 3.3.1 Animal
- 3.4 Regulatory Framework
- 3.4.1 Brazil and Argentina
- 3.5 Value Chain & Distribution Channel Analysis
4 MARKET SEGMENTATION (includes market size in Value in USD and Volume, Forecasts up to 2030 and analysis of growth prospects)
- 4.1 Protein Type
- 4.1.1 Casein and Caseinates
- 4.1.2 Collagen
- 4.1.3 Egg Protein
- 4.1.4 Gelatin
- 4.1.5 Insect Protein
- 4.1.6 Milk Protein
- 4.1.7 Whey Protein
- 4.1.8 Other Animal Protein
- 4.2 End User
- 4.2.1 Animal Feed
- 4.2.2 Food and Beverages
- 4.2.2.1 By Sub End User
- 4.2.2.1.1 Bakery
- 4.2.2.1.2 Beverages
- 4.2.2.1.3 Breakfast Cereals
- 4.2.2.1.4 Condiments/Sauces
- 4.2.2.1.5 Confectionery
- 4.2.2.1.6 Dairy and Dairy Alternative Products
- 4.2.2.1.7 RTE/RTC Food Products
- 4.2.2.1.8 Snacks
- 4.2.3 Personal Care and Cosmetics
- 4.2.4 Supplements
- 4.2.4.1 By Sub End User
- 4.2.4.1.1 Baby Food and Infant Formula
- 4.2.4.1.2 Elderly Nutrition and Medical Nutrition
- 4.2.4.1.3 Sport/Performance Nutrition
- 4.3 Country
- 4.3.1 Argentina
- 4.3.2 Brazil
- 4.3.3 Rest of South America
5 COMPETITIVE LANDSCAPE
- 5.1 Key Strategic Moves
- 5.2 Market Share Analysis
- 5.3 Company Landscape
- 5.4 Company Profiles (includes Global Level Overview, Market Level Overview, Core Business Segments, Financials, Headcount, Key Information, Market Rank, Market Share, Products and Services, and Analysis of Recent Developments).
- 5.4.1 Arla Foods amba
- 5.4.2 Darling Ingredients Inc.
- 5.4.3 GELITA AG
- 5.4.4 Gelnex
- 5.4.5 Hilmar Cheese Company, Inc.
- 5.4.6 Kerry Group plc
- 5.4.7 Lactoprot Deutschland GmbH
- 5.4.8 Royal FrieslandCampina N.V
- 5.4.9 Saputo Inc
- 5.4.10 Sooro Renner Nutricao S.A.
- 5.4.11 Tangara Foods S.A
6 KEY STRATEGIC QUESTIONS FOR PROTEIN INGREDIENTS INDUSTRY CEOS
7 APPENDIX
- 7.1 Global Overview
- 7.1.1 Overview
- 7.1.2 Porter's Five Forces Framework
- 7.1.3 Global Value Chain Analysis
- 7.1.4 Market Dynamics (DROs)
- 7.2 Sources & References
- 7.3 List of Tables & Figures
- 7.4 Primary Insights
- 7.5 Data Pack
- 7.6 Glossary of Terms
- 発行日
- 発行
- Mordor Intelligence
- ページ情報
- 英文 231 Pages
- 納期
- 2~3営業日


