
アジア太平洋地域のスナックバー:市場シェア分析、産業動向、成長予測(2025~2030年)
Asia Pacific Snack Bar - Market Share Analysis, Industry Trends & Statistics, Growth Forecasts (2025 - 2030)
- 発行日
- ページ情報
- 英文 204 Pages
- 納期
- 2~3営業日
- 商品コード
- 1686545
- カスタマイズ可能 お客様のご希望に応じて、既存データの加工や未掲載情報(例:国別セグメント)の追加などの対応が可能です。詳細はお問い合わせください。
- 適宜更新あり 本レポートは最新情報反映のため適宜更新し、内容構成変更を行う場合があります。ご検討の際はお問い合わせください。
- 翻訳ツール提供対象 PDF対応AI翻訳ツールの無料貸し出しサービスのご利用が可能です
概要
アジア太平洋地域のスナックバー市場規模は、2025年に21億2,000万米ドルと推定され、2030年には33億6,000万米ドルに達すると予測され、予測期間中(2025-2030年)のCAGRは9.60%で成長する見込みです。
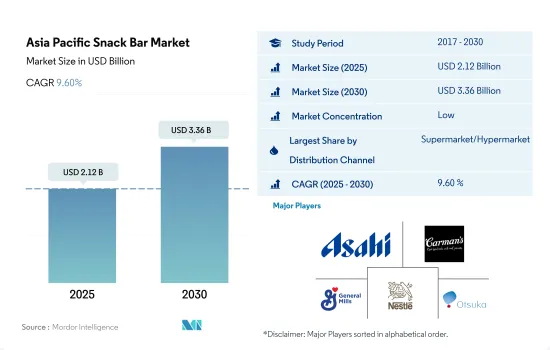
スーパーマーケットとハイパーマーケットが市場シェアの大半を占める。
- アジア太平洋地域では、全体的な小売業セグメントは2022年と比較して2023年には4.59%の成長率を維持しました。このセグメントは、消費者の便利なショッピング施設への志向の高まりとともに、さらに成長すると予想されます。
- スーパーマーケットとハイパーマーケットは、アジア太平洋地域のスナックバー市場で最大の小売業者です。これらの店舗では、幅広い種類のチョコレート製品を独創的なオファーとともに顧客に提供する傾向があります。同地域のスーパーマーケットおよびハイパーマーケットにおけるスナックバー製品の販売量は、2022年に4.22%成長し、2025~2028年にはCAGR 9.42%を記録すると予測されています。スーパーマーケットとハイパーマーケットでは、主に健康志向の消費者の増加により、シリアルバーが最も多く販売され、2023年にはスナックバー市場全体の46.32%のシェアを占める。
- 小売セグメント全体では、コンビニエンスストアが2023年に数量ベースで第2位のセグメントとなりました。アジア太平洋で人気のある店舗には、ウォルマート、セブンイレブン、サークルKなどがあります。2025年までに、アジア太平洋のコンビニエンスストア部門は、2020年比で数量ベースで4.48%の成長率を記録すると推定されます。
- オンライン小売店はアジア太平洋で最も急成長しているセグメントです。eコマース事業の2023年のCAGRは5.85%です。地域全体のインターネットユーザー数の増加が、eコマースサイトの成長加速に影響を与える主な要因です。
- 予測期間中、アジア太平洋地域の小売事業全体は数量ベースで8.21%の成長率を記録すると予想されます。対面式ショッピングへの関心の高まりや、割引やオファーといった要因が、小売業界を大きく牽引する可能性が高いです。
健康志向の商品に対する意識の高まりが、同セグメントの売上を押し上げる可能性が高いです。
- アジア太平洋では、スナックバー分野は2023年には2022年比で5.79%という良好な金額成長率を記録したが、これは主に健康的な食事動向に対する消費者の意識の高まりと、多忙なライフスタイルを送る若者や勤労消費者の存在が大きいためです。多くの人々は、健康的なライフスタイルを維持するために、食事中にカロリーを計算し、それに応じて献立を計画しています。2023年には、この地域の消費者の約70%が、病気や不純物の蔓延を受けて健康志向が強まり、健康とウェルネスへの支出を増やしたいと考えています。
- 国別では、日本が同地域で主要なシェアを占めており、同市場におけるスナックバーの消費量が最も多いことに支えられています。2023年の金額ベースの前年比成長率は2022年比で4.22%を記録しました。利用可能なスナックバーのすべての種類の中で、日本の消費者はプロテイン・バーを、タンパク質が強化された他のどの製品よりも健康的であると認識しています。2022年には、日本の消費者の約76%がプロテイン・バーやエネルギー・バーを健康的だと考えています。オーストラリアは、スナックバーの消費量において同地域で2番目の主要国です。オーストラリアの消費者は、ライフスタイルの変化、食事摂取量の増加、スポーツ文化などを背景に、ヘルシーで便利なスナック製品により多くの支出を行っています。2023年には成人の90%以上がスポーツに関心を持っています。毎年約1,300万人の大人と300万人の子どもがスポーツに参加しています。
- 中国は最も急成長しているセグメントであり、2024年と比較して2030年には金額ベースで11.89%の成長率を記録すると予想されます。同国のスナックバー分野は、ライフスタイルや消費者の嗜好の進化、食の選択における欧米文化の影響により、急速な成長を遂げています。
アジア太平洋地域のスナックバー市場動向
外出先での間食に対する需要の高まりがアジア諸国の市場成長を支える
- 同地域では間食が大きな役割を果たしており、スナックバーはより便利な外出先での間食オプションとなっています。スナックバーはヘルシーで携帯性に優れ、朝食や食事の代わりとしてどこでも手軽に食べられると考えられています。I
- 同地域の消費者は、高タンパク、味、自然さを求めてスナックバーを好みます。2022年には、中国の消費者の13%がプロテインバーに高タンパク質を求め、消費者の12%が天然素材を求めていると主張しています。
- 価格は、この地域の消費者のスナックバーに対する購買行動の主要な要因です。プレミアムスナックバーの動向は、この地域の市場成長と消費者の認知を促進すると予想されます。2022年には、中国の消費者の80%が好みのタンパク質源にプレミアムを支払うと主張しています。
- スナックバーは、健康的な栄養素、生物活性化合物、食物繊維を消費者に届ける理想的な食品フォーマットであるシリアル、フルーツ、ナッツを使用して、しばしば作られる汎用性の高い製品です。
アジア太平洋地域のスナックバー産業概要
アジア太平洋地域のスナックバー市場は断片化されており、上位5社で18.27%を占めています。この市場の主要企業は以下の通りです。 Asahi Group Holdings Ltd, Carman's Fine Foods Pty Ltd, General Mills Inc., Nestle SA and Otsuka Holdings(sorted alphabetically).
その他の特典
- エクセル形式の市場予測(ME)シート
- 3ヶ月間のアナリストサポート
目次
第1章 エグゼクティブサマリーと主な調査結果
第2章 レポートのオファー
第3章 イントロダクション
- 調査の前提条件と市場定義
- 調査範囲
- 調査手法
第4章 主要産業動向
- 規制の枠組み
- 消費者の購買行動
- 成分分析
- バリューチェーンと流通チャネル分析
第5章 市場セグメンテーション
- 菓子類
- シリアルバー
- フルーツ&ナッツバー
- プロテインバー
- 流通チャネル
- コンビニエンスストア
- オンライン小売店
- スーパーマーケット/ハイパーマーケット
- その他
- 国
- オーストラリア
- 中国
- インド
- インドネシア
- 日本
- マレーシア
- ニュージーランド
- 韓国
- その他アジア太平洋地域
第6章 競合情勢
- 主要な戦略動向
- 市場シェア分析
- 企業情勢
- 企業プロファイル
- Amway International Inc.
- Asahi Group Holdings Ltd
- Bagrrys India Private Limited
- Carman's Fine Foods Pty Ltd
- Ferrero International SA
- General Mills Inc.
- Kellogg Company
- Lotus Bakeries
- Mars Incorporated
- Mondelez International Inc.
- Morinaga & Co. Ltd
- Naturell India Pvt. Ltd
- Nestle SA
- Otsuka Holdings Co. Ltd
- PepsiCo Inc.
- Post Holdings Inc.
- Simply Good Foods Co.
第7章 CEOへの主な戦略的質問
第8章 付録
- 世界概要
- 概要
- ファイブフォース分析フレームワーク
- 世界のバリューチェーン分析
- 市場力学(DROs)
- 情報源と参考文献
- 図表一覧
- 主要洞察
- データパック
- 用語集
目次
The Asia Pacific Snack Bar Market size is estimated at 2.12 billion USD in 2025, and is expected to reach 3.36 billion USD by 2030, growing at a CAGR of 9.60% during the forecast period (2025-2030).
Supermarkets and hypermarkets account for a major market share as consumers are interested in in-person grocery shopping and discount offers
- In Asia-Pacific, the overall retailing segment maintained a growth rate of 4.59% in 2023 compared to 2022. The segment is anticipated to grow further with the consumers' growing inclination for convenient shopping facilities.
- Supermarkets and hypermarkets are the largest retailers in the Asia-Pacific snack bar market. These stores have a tendency to offer a wide range of chocolate products with creative offers to their customers. The sales volume of snack bar products in supermarkets and hypermarkets in the region grew by 4.22% in 2022, and it is anticipated to register a CAGR of 9.42% during 2025-2028. Through supermarkets and hypermarkets, cereal bars are sold the most, accounting for a 46.32% share of the total snack bar market in 2023, mainly due to the growing number of health-conscious consumers
- Under the overall retailing segment, convenience store was the second-largest segment by volume in 2023. Some of the popular stores in Asia-Pacific are Walmart, 7-Eleven, and Circle-K. By 2025, the convenience store segment in Asia-Pacific is estimated to register a growth rate of 4.48% by volume compared to 2020.
- Online retail store is the fastest-growing segment in Asia-Pacific. The e-commerce business accounted for a CAGR of 5.85% in 2023. The growing number of internet users across the region is the major factor influencing the acceleration of the growth of e-commerce websites.
- During the forecast period, the overall retailing segment in Asia-Pacific is expected to register a growth rate of 8.21% by volume. Factors such as rising interest in in-person shopping and discounts and offers are likely to drive the retailing industry drastically.
Growing awareness regarding health-oriented products is likely to boost the segment's sales
- In Asia-Pacific, the snack bar segment witnessed a favorable value growth rate of 5.79% in 2023 compared to 2022, primarily due to the growing consciousness among consumers about healthy eating trends and a significant presence of youth and working consumers with hectic lifestyles. Many people count calories while eating and plan their menus accordingly to maintain a healthy lifestyle. In 2023, about 70% of the consumers in the region were willing to increase their spending on health and wellness as they became more health-conscious following the prevalence of ailments and adulteration.
- By country, Japan holds the major share in the region, supported by the highest consumption of snack bars in the market. It registered a Y-o-Y growth rate of 4.22% by value in 2023 compared to 2022. Among all the available snack bar variants, consumers in Japan perceive protein bars as healthier than any other product fortified with protein. In 2022, about 76% of Japanese consumers consider protein and energy bars to be healthy. Australia is the second leading country in the region in terms of snack bar consumption. Australian consumers spend more on healthy and convenient snack products due to the country's changing lifestyles, increasing dietary intake, and sports culture. In 2023, more than 90% of adults had an interest in sports. About 13 million adults and 3 million children take part in sports each year.
- China is likely to be the fastest-growing segment and is expected to register a growth rate of 11.89% by value in 2030 compared to 2024. The snack bar segment in the country is experiencing rapid growth due to evolving lifestyles and consumer preferences, as well as the influence of Western culture in terms of food choices.
Asia Pacific Snack Bar Market Trends
Growing demand for on-the-go food snacking options supports the market growth in Asian countries
- Snacking is playing a major role in the region, with snack bars being a more convenient, on-the-go snack option. They are considered to be healthy, portable, and can be easily consumed anywhere as a breakfast or meal replacement. I
- Consumers in the region prefer snack bars for high protein, taste, and naturalness. In 2022, 13% of consumers in China claimed that they look for high protein in their protein bars, while 12% of consumers look for naturally produced.; Also, more consumers in the region are looking for bar options with smaller portion sizes, such as minis and bites.
- Price is a major factor in consumer buying behavior for snack bars in the region. The trend of premium snack bars is expected to drive market growth and consumer recognition in this region. In 2022, 80% of consumers in China claimed to pay a premium for their preferred protein source.
- Snack bars are versatile products often made, with cereals, fruits, and nuts being an ideal food format to deliver healthy nutrients, bioactive compounds, and dietary fiber to consumers.; Consumers in the region are looking for healthier snack alternatives that can be consumed on the go.
Asia Pacific Snack Bar Industry Overview
The Asia Pacific Snack Bar Market is fragmented, with the top five companies occupying 18.27%. The major players in this market are Asahi Group Holdings Ltd, Carman's Fine Foods Pty Ltd, General Mills Inc., Nestle SA and Otsuka Holdings Co. Ltd (sorted alphabetically).
Additional Benefits:
- The market estimate (ME) sheet in Excel format
- 3 months of analyst support
TABLE OF CONTENTS
1 EXECUTIVE SUMMARY & KEY FINDINGS
2 REPORT OFFERS
3 INTRODUCTION
- 3.1 Study Assumptions & Market Definition
- 3.2 Scope of the Study
- 3.3 Research Methodology
4 KEY INDUSTRY TRENDS
- 4.1 Regulatory Framework
- 4.2 Consumer Buying Behavior
- 4.3 Ingredient Analysis
- 4.4 Value Chain & Distribution Channel Analysis
5 MARKET SEGMENTATION (includes market size in Value in USD and Volume, Forecasts up to 2030 and analysis of growth prospects)
- 5.1 Confectionery Variant
- 5.1.1 Cereal Bar
- 5.1.2 Fruit & Nut Bar
- 5.1.3 Protein Bar
- 5.2 Distribution Channel
- 5.2.1 Convenience Store
- 5.2.2 Online Retail Store
- 5.2.3 Supermarket/Hypermarket
- 5.2.4 Others
- 5.3 Country
- 5.3.1 Australia
- 5.3.2 China
- 5.3.3 India
- 5.3.4 Indonesia
- 5.3.5 Japan
- 5.3.6 Malaysia
- 5.3.7 New Zealand
- 5.3.8 South Korea
- 5.3.9 Rest of Asia-Pacific
6 COMPETITIVE LANDSCAPE
- 6.1 Key Strategic Moves
- 6.2 Market Share Analysis
- 6.3 Company Landscape
- 6.4 Company Profiles
- 6.4.1 Amway International Inc.
- 6.4.2 Asahi Group Holdings Ltd
- 6.4.3 Bagrrys India Private Limited
- 6.4.4 Carman's Fine Foods Pty Ltd
- 6.4.5 Ferrero International SA
- 6.4.6 General Mills Inc.
- 6.4.7 Kellogg Company
- 6.4.8 Lotus Bakeries
- 6.4.9 Mars Incorporated
- 6.4.10 Mondelez International Inc.
- 6.4.11 Morinaga & Co. Ltd
- 6.4.12 Naturell India Pvt. Ltd
- 6.4.13 Nestle SA
- 6.4.14 Otsuka Holdings Co. Ltd
- 6.4.15 PepsiCo Inc.
- 6.4.16 Post Holdings Inc.
- 6.4.17 Simply Good Foods Co.
7 KEY STRATEGIC QUESTIONS FOR CONFECTIONERY CEOS
8 APPENDIX
- 8.1 Global Overview
- 8.1.1 Overview
- 8.1.2 Porter's Five Forces Framework
- 8.1.3 Global Value Chain Analysis
- 8.1.4 Market Dynamics (DROs)
- 8.2 Sources & References
- 8.3 List of Tables & Figures
- 8.4 Primary Insights
- 8.5 Data Pack
- 8.6 Glossary of Terms
- 発行日
- 発行
- Mordor Intelligence
- ページ情報
- 英文 204 Pages
- 納期
- 2~3営業日


