
|
市場調査レポート
商品コード
1685965
米国のスナックバー:市場シェア分析、産業動向・統計、成長予測(2025年~2030年)US Snack Bar - Market Share Analysis, Industry Trends & Statistics, Growth Forecasts (2025 - 2030) |
||||||
カスタマイズ可能
適宜更新あり
|
|||||||
| 米国のスナックバー:市場シェア分析、産業動向・統計、成長予測(2025年~2030年) |
|
出版日: 2025年03月18日
発行: Mordor Intelligence
ページ情報: 英文 162 Pages
納期: 2~3営業日
|

全表示
- 概要
- 目次
概要
米国のスナックバー市場規模は2025年に124億4,000万米ドルと推計され、2030年には186億1,000万米ドルに達すると予測され、予測期間(2025-2030年)のCAGRは8.40%で成長する見込みです。
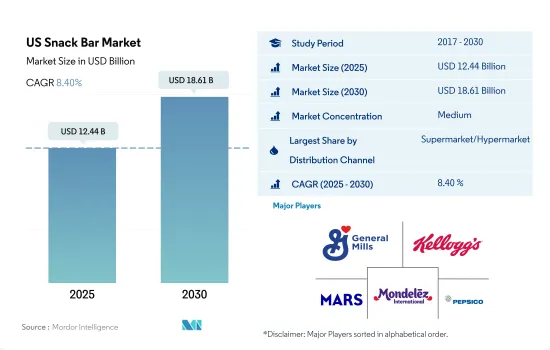
米国のスナックバー流通は、スーパーマーケット/ハイパーマーケットとコンビニエンスストアのセグメントが大部分を占め、2023年には金額シェア70%を占める。
- 米国全体の流通チャネルセグメントは2022年に2021年比8.01%の成長率を経験したが、これは主に味や風味を犠牲にすることなく、小売チャネルを通じて健康志向でヘルシーなスナッキングオプションの消費が増加しているためです。ウォルマート(Walmart)、スプラウト(Sprouts)、クローガー(Kroger)、メイジャー(Meijer)などの大手店舗は、ケトフレンドリーで低糖質の製品専用の通路を設け、健康志向の消費者の買い物体験を簡素化しています。
- オンライン小売店は、2029年に2028年比4.65%の成長率を記録し、最も急成長するセグメントとなりそうです。eコマース部門は、他のどの伝統的な小売チャネルよりも急速に成長しています。この成長は、主にスナックバーのような機能的で健康的な製品に対する需要の高まりによるものであり、これらの製品はオンライン小売店で広く入手可能です。大手小売業者はオンライン媒体を採用し、スナックバー市場を牽引しています。コストコ(Costco)、トレーダージョーズ(Trader Joe's)、ウォルマート(Walmart)などの小売業者はオムニチャネル・ショッピングに力を入れており、特にオンライン機能を実店舗に拡大・統合しています。
- スーパーマーケットが金額ベースで大きなシェアを占めており、2026年中の金額成長率は2027年比で5.6%に達する可能性が高いです。これらの小売チャネルは、提供されるブランドの品揃えの豊富さ、棚面積の広さ、頻繁な価格プロモーションにより、強い地位を占めています。同国の小売業界は広範かつよく組織化されているため、顧客はスナックバーを含むさまざまな菓子製品を購入しやすく、便利です。また、スーパーマーケットやハイパーマーケットには、近接性があるため、市場で入手可能な幅広い商品の中から消費者の購買決定に影響を与えるという利点もあります。
米国のスナックバー市場動向
外出先でのヘルシーな代替品に対する消費者の嗜好の高まりにより売上が増加
- 2023年現在、米国では90%以上の消費者がスナックを食べています。スナックバーの中でもシリアル・バーは多くの消費者が好むスナックバー・カテゴリーであり、2023年にはスナックバー・カテゴリーの50%以上を占める。多忙なスケジュールをこなす働き盛りの消費者とフィットネス愛好家が、米国のスナックバー市場の注目すべき層です。
- 利便性/携帯性、栄養(特にタンパク質含有量)は、スナックバーにとって重要な普遍的購入基準です。また、ミニサイズやひと口サイズなど、ポーションサイズの小さいバーの選択肢を求める顧客も増えています。これは、満足感のある甘い間食として、カロリーを抑えたより健康的な選択肢を提供します。
- 北米では、2023年のスナックバーの小売価格は5.54米ドルでした。しかし、原材料価格のインフレがスナックバーの価格に影響を与えました。例えば、砂糖、オーツ麦、シリアルなどの原材料の小売価格は、2023年にはキログラム当たり3~5米ドルでした。
- 2022年、スナックバーを選ぶ動機のトップは、健康的であること(59%)、便利であること(51%)、消費者がタンパク質を必要としていること(49%)でした。健康志向の消費者は、ジムでのエネルギー補給や日中の手軽でヘルシーなおやつとして、ヘルシーな素材を使ったシリアルバーやその他のスナックバーを楽しんでいます。
米国のスナックバー業界の概要
米国のスナックバー市場は適度に統合されており、上位5社で44.17%を占めています。この市場の主要企業は以下の通りです。General Mills Inc., Kellogg Company, Mars Incorporated, Mondelez International Inc. and PepsiCo Inc.(sorted alphabetically).
その他の特典
- エクセル形式の市場予測(ME)シート
- 3ヶ月のアナリストサポート
目次
第1章 エグゼクティブサマリーと主な調査結果
第2章 レポートのオファー
第3章 イントロダクション
- 調査の前提条件と市場定義
- 調査範囲
- 調査手法
第4章 主要産業動向
- 規制の枠組み
- 消費者の購買行動
- 成分分析
- バリューチェーンと流通チャネル分析
第5章 市場セグメンテーション
- 菓子類
- シリアル・バー
- フルーツ&ナッツバー
- プロテインバー
- 流通チャネル
- コンビニエンスストア
- オンライン小売店
- スーパーマーケット/ハイパーマーケット
- その他
第6章 競合情勢
- 主要な戦略動向
- 市場シェア分析
- 企業情勢
- 企業プロファイル
- 1440 Foods Company
- Abbott Laboratories
- Caveman Foods LLC
- Ferrero International SA
- General Mills Inc.
- Go Macro LLC
- Kellogg Company
- Mars Incorporated
- Mondelez International Inc.
- PepsiCo Inc.
- Power Crunch Pty Ltd
- Probar Inc.
- Simply Good Foods Co.
- The Hershey Company
第7章 CEOへの主な戦略的質問
第8章 付録
- 世界概要
- 概要
- ファイブフォース分析フレームワーク
- 世界のバリューチェーン分析
- 市場力学(DROs)
- 情報源と参考文献
- 図表一覧
- 主要洞察
- データパック
- 用語集
目次
Product Code: 50006
The US Snack Bar Market size is estimated at 12.44 billion USD in 2025, and is expected to reach 18.61 billion USD by 2030, growing at a CAGR of 8.40% during the forecast period (2025-2030).
Snack bar distribution in United States is largely dominated by the supermarket/ hypermarkets and convenience stores segments, holding a share of 70% value share in 2023
- The overall US distribution channel segment experienced a growth rate of 8.01% in 2022 compared to 2021, mainly because of the rising consumption of health-oriented and healthy snacking options through retail channels without sacrificing taste and flavor. Major stores like Walmart, Sprouts, Kroger, and Meijer are creating dedicated aisles for keto-friendly, low-sugar products, simplifying health-conscious consumers' shopping experience.
- Online retail stores are likely to be the fastest-growing segment by recording a growth rate of 4.65% in 2029 relative to 2028. The e-commerce sector is growing faster than any other traditional retail channel. This increase is mostly due to the rising demand for functional and healthy products like snack bars, which are widely accessible at online retailers. Major retailers are adopting the online medium, driving the market for snack bars. Retailers such as Costco, Trader Joe's, and Walmart focus on omnichannel shopping, particularly expanding and integrating online capabilities into brick-and-mortar stores.
- Supermarkets accounted for a major share by value and are likely to attain a value growth rate of 5.6% during 2026 compared to 2027. These retail channels have a strong position due to the wide selection of brands offered, considerable shelf space, and frequent price promotions. The country's extensive and well-organized retail industry gives customers the accessibility and convenience to buy various confectionary products, including snack bars. Supermarkets/hypermarkets also have the added advantage of influencing consumers' purchasing decisions within the wide range of products available in the market due to the proximity factor.
US Snack Bar Market Trends
Growing consumer preferences toward on-the-go healthy alternatives resulted in higher sales
- As of 2023, more than 90% of consumers in the United States consumed snacks. Among snack bars, cereal bars are the favorite snack bar category among most consumers, constituting more than 50% of the snack bar category in 2023. Working consumers with busy schedules and fitness enthusiasts are the notable demographic for the snack bar market in the United States.
- Convenience/portability and nutrition (notably protein content) are important universal purchase criteria for snack bars. Also, more customers are looking for bar options with smaller portion sizes, such as minis and bites. This offers a calorie-controlled, healthier option for satisfying, sweet snacking.
- In North America, in 2023, the retail price of a snack bar was USD 5.54. However, the inflation in the prices of ingredients impacted the price of the snack bar. For instance, the retail prices of ingredients like sugar, oats, and cereal ranged from USD 3 to USD 5 per kilogram in 2023.
- In 2022, the top motivations to choose snack bars were that they were healthy (59%), convenient (51%), and that consumers needed protein (49%). Health-conscious consumers enjoy cereal bars and other snack bars with healthy ingredients to get an energy boost in the gym or to have a quick but healthy treat during the day.
US Snack Bar Industry Overview
The US Snack Bar Market is moderately consolidated, with the top five companies occupying 44.17%. The major players in this market are General Mills Inc., Kellogg Company, Mars Incorporated, Mondelez International Inc. and PepsiCo Inc. (sorted alphabetically).
Additional Benefits:
- The market estimate (ME) sheet in Excel format
- 3 months of analyst support
TABLE OF CONTENTS
1 EXECUTIVE SUMMARY & KEY FINDINGS
2 REPORT OFFERS
3 INTRODUCTION
- 3.1 Study Assumptions & Market Definition
- 3.2 Scope of the Study
- 3.3 Research Methodology
4 KEY INDUSTRY TRENDS
- 4.1 Regulatory Framework
- 4.2 Consumer Buying Behavior
- 4.3 Ingredient Analysis
- 4.4 Value Chain & Distribution Channel Analysis
5 MARKET SEGMENTATION (includes market size in Value in USD and Volume, Forecasts up to 2030 and analysis of growth prospects)
- 5.1 Confectionery Variant
- 5.1.1 Cereal Bar
- 5.1.2 Fruit & Nut Bar
- 5.1.3 Protein Bar
- 5.2 Distribution Channel
- 5.2.1 Convenience Store
- 5.2.2 Online Retail Store
- 5.2.3 Supermarket/Hypermarket
- 5.2.4 Others
6 COMPETITIVE LANDSCAPE
- 6.1 Key Strategic Moves
- 6.2 Market Share Analysis
- 6.3 Company Landscape
- 6.4 Company Profiles
- 6.4.1 1440 Foods Company
- 6.4.2 Abbott Laboratories
- 6.4.3 Caveman Foods LLC
- 6.4.4 Ferrero International SA
- 6.4.5 General Mills Inc.
- 6.4.6 Go Macro LLC
- 6.4.7 Kellogg Company
- 6.4.8 Mars Incorporated
- 6.4.9 Mondelez International Inc.
- 6.4.10 PepsiCo Inc.
- 6.4.11 Power Crunch Pty Ltd
- 6.4.12 Probar Inc.
- 6.4.13 Simply Good Foods Co.
- 6.4.14 The Hershey Company
7 KEY STRATEGIC QUESTIONS FOR CONFECTIONERY CEOS
8 APPENDIX
- 8.1 Global Overview
- 8.1.1 Overview
- 8.1.2 Porter's Five Forces Framework
- 8.1.3 Global Value Chain Analysis
- 8.1.4 Market Dynamics (DROs)
- 8.2 Sources & References
- 8.3 List of Tables & Figures
- 8.4 Primary Insights
- 8.5 Data Pack
- 8.6 Glossary of Terms

