
|
市場調査レポート
商品コード
1686623
スナックバー:市場シェア分析、産業動向・統計、成長予測(2025年~2030年)Snack Bar - Market Share Analysis, Industry Trends & Statistics, Growth Forecasts (2025 - 2030) |
||||||
カスタマイズ可能
適宜更新あり
|
|||||||
| スナックバー:市場シェア分析、産業動向・統計、成長予測(2025年~2030年) |
|
出版日: 2025年03月18日
発行: Mordor Intelligence
ページ情報: 英文 351 Pages
納期: 2~3営業日
|

全表示
- 概要
- 目次
概要
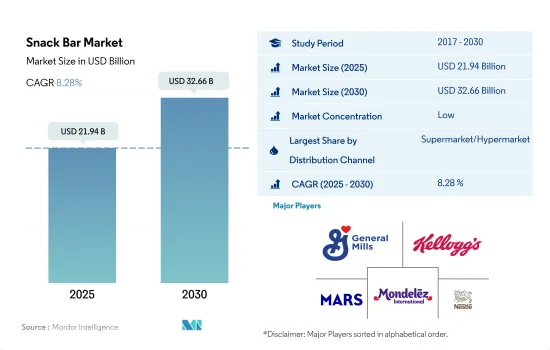
スナックバー市場規模は2025年に219億4,000万米ドルと推定・予測され、2030年には326億6,000万米ドルに達し、予測期間中(2025年~2030年)のCAGRは8.28%で成長すると予測されます。
大手小売業者が世界各国に進出しているため、スーパーマーケットやハイパーマーケットを通じて販売されるシリアルバーの市場成長が増加しています。
- 世界の小売業セグメントは、2020年と比較して2023年には金額ベースで23.05%の成長を維持しました。この成長は、市場における消費者のコンビニエンス・ショッピング施設に対する志向の高まりとともに予想されます。対面式ショッピングへの関心の高まりや、割引キャンペーンへの需要などが、小売業界を大きく牽引していると思われます。スーパーマーケットとハイパーマーケットは、世界的に最も大きく、最も支配的なセグメントであることが観察されました。2022年現在、このセグメントは金額ベースで46.40%のシェアを占めており、市場における多国籍ブランドのネットワークの普及によって成長が促進されています。2022年現在、世界最大のスーパーマーケット・チェーンはLidlで11,200店舗、次いでAldi Sudの7,200店舗、Penny Marketの3,600店舗となっています。
- オンライン小売チャネルは最も急成長している流通チャネルであり、予測期間中のCAGRは7.81%(金額ベース)に達すると予想されます。オンラインストアでは、消費者はプライベートブランドや主流ブランドで販売されている豊富な商品群から好きなものを選ぶことができます。スマートフォンユーザーの増加と主要地域におけるインターネットの普及は、予測期間中に菓子類のオンライン販売を促進すると予想されます。2023年4月現在、世界のインターネット・ユーザー数は51億8,000万人で、これは世界人口の64.6%に相当します。
- コンビニエンスストアは2022年に金額ベースで29.47%と2番目に高いシェアを占めました。売上げの大部分は、課金キオスクの近くにキャンディーやミントのような商品を配置することによって支えられています。
世界中で食間の間食の重要性が高まっており、北米と欧州地域が85%のシェアを占めて市場の成長を後押ししています。
- 世界のスナックバー市場は、2022年と比較して2023年には金額ベースで7.27%の成長を観察しました。予測期間中、スナックバーは世界の菓子類市場で最も急成長するセグメントとなる見込みです。これは、食間のスナック消費が増加し、消費者の間で、外出先でも便利でありながら健康的で栄養価の高いスナック・オプションが求められていることが大きく影響しています。
- 北米は最大の成長地域で、2023年の金額シェアは66.68%、2022年比の前年比成長率は7.66%です。この地域の消費者の間で間食が増加しているため、成長が見込まれています。2023年現在、米国の消費者の90%以上がスナックを消費しています。2022年には、消費者の半数以上(51%)が通常の万能スナックバーを好み、他のタイプのバー製品を求めています。
- 欧州は世界第2位のスナックバー市場であり、2023年には2022年比で金額ベースで6.24%の成長率で拡大することが確認されています。スナックバーの消費は欧州の消費者に浸透しています。2022年には、英国の消費者の半数以上(58%)、ドイツ人の44%、フランスの消費者の30%が、外出先での軽食の一つとしてスナックバーを含む間食をとっています。2021年から2022年にかけて、英国の人口の約96%がグラノーラ/シリアル/スナックバーを少なくとも時折消費しました。
- 南米はスナックバー菓子類市場で最も急成長している地域であり、予測期間中に50.32%の金額成長を達成する可能性が高いです。高繊維質、低カロリー、高タンパク質、天然素材入りのスナックバーなど、健康志向の製品が人気を集めています。2022年には、ブラジルの消費者の56%が週に2回以上スナックバーを消費していました。彼らは、スナックバーは栄養価が高く健康的であるため消費していると主張しています。
世界のスナックバー市場動向
フィットネス愛好者の増加とともに、便利でヘルシーな外出用オプションの動向が高まっていることが、市場成長の主な要因です。
- スナックバーは北米と欧州の先進国で多く消費されています。北米では、スナックバーは油を使ったスナック菓子の代替品として社会人に好まれています。
- スナック・バーの分野では、ブランド・ロイヤルティが製品属性の第1位を占めています。北米では、43%の消費者が好みのブランドのスナックバーを選んでいます。欧州では、スナック・バーの消費者は、特に形状や食感において、新しい感覚を提供できるバーを求めています。
- 製品価格の変動は、シリアル、穀物、砂糖などの原材料価格の上下と関連しています。北米では、2023年のシリアルバー、プロテインバー、フルーツ&ナッツバーの平均販売価格は、それぞれ6.54米ドル、9.36米ドル、7.48米ドルでした。
- さまざまなフレーバーのスナックバーが入手可能になったことで、若い世代が健康的なおやつとして楽しんでいます。欧州では、消費者がより健康的な選択肢としてシリアルバー、プロテインバー、フルーツ&ナッツバーなどのスナックバーを選ぶ傾向が強まっています。
スナックバー業界の概要
スナックバー市場は細分化されており、上位5社で25.58%を占めています。この市場の主要企業は以下の通りです。 General Mills Inc., Kellogg Company, Mars Incorporated, Mondelez International Inc. and Nestle SA(sorted alphabetically).
その他の特典
- エクセル形式の市場予測(ME)シート
- 3ヶ月のアナリストサポート
目次
第1章 エグゼクティブサマリーと主な調査結果
第2章 レポートのオファー
第3章 イントロダクション
- 調査の前提条件と市場定義
- 調査範囲
- 調査手法
第4章 主要産業動向
- 規制の枠組み
- 消費者の購買行動
- 成分分析
- バリューチェーンと流通チャネル分析
第5章 市場セグメンテーション
- 菓子類
- シリアル・バー
- フルーツ&ナッツバー
- プロテインバー
- 流通チャネル
- コンビニエンスストア
- オンライン小売店
- スーパーマーケット/ハイパーマーケット
- その他
- 地域
- アフリカ
- 国別
- エジプト
- ナイジェリア
- 南アフリカ
- その他のアフリカ
- アジア太平洋
- 国別
- オーストラリア
- 中国
- インド
- インドネシア
- 日本
- マレーシア
- ニュージーランド
- 韓国
- その他のアジア太平洋
- 欧州
- 国別
- ベルギー
- フランス
- ドイツ
- イタリア
- オランダ
- ロシア
- スペイン
- スイス
- トルコ
- 英国
- その他の欧州
- 中東
- 国別
- バーレーン
- クウェート
- オマーン
- カタール
- サウジアラビア
- アラブ首長国連邦
- その他の中東
- 北米
- 国別
- カナダ
- メキシコ
- 米国
- その他の北米
- 南米
- 国別
- アルゼンチン
- ブラジル
- その他の南米
- アフリカ
第6章 競合情勢
- 主要な戦略動向
- 市場シェア分析
- 企業情勢
- 企業プロファイル
- Abbott Laboratories
- Associated British Foods plc
- Ferrero International SA
- General Mills Inc.
- Halo Foods Ltd
- Kellogg Company
- Lotus Bakeries
- Mars Incorporated
- Mondelez International Inc.
- Nestle SA
- PepsiCo Inc.
- Post Holdings Inc.
- Simply Good Foods Co.
- The Hershey Company
第7章 CEOへの主な戦略的質問
第8章 付録
- 世界概要
- 概要
- ファイブフォース分析フレームワーク
- 世界のバリューチェーン分析
- 市場力学(DROs)
- 情報源と参考文献
- 図表一覧
- 主要洞察
- データパック
- 用語集
目次
Product Code: 53342
The Snack Bar Market size is estimated at 21.94 billion USD in 2025, and is expected to reach 32.66 billion USD by 2030, growing at a CAGR of 8.28% during the forecast period (2025-2030).
With major retailers making their footprints across all countries globally, there has been an increased market growth of cereal bars sold through supermarkets and hypermarkets
- The global retailing segment maintained growth of 23.05% by value in 2023 compared to 2020. The growth is anticipated with the consumers' growing inclination for convenience shopping facilities in the market. Aspects such as rising interest in in-person shopping and demand for discount offers, etc., are likely to drive the retailing industry drastically. Supermarkets and hypermarkets were observed to be the largest and the most dominating segment globally. As of 2022, the segment occupied a share of 46.40% by value, and the growth is promoted by the proliferation of the network of multinational brands in the market. Globally, Lidl was recognized as the largest supermarket chain with 11,200 outlets, followed by Aldi Sud with 7,200 outlets and Penny Market with 3,600 outlets as of 2022.
- The online retail channel is observed to be the fastest growing distribution channel and expected to observe a CAGR of 7.81% by value over the forecast period, accelerated by the increasing global internet penetration, increasing smartphone usage, and increasing and expansive network of grocery delivery chains. Online stores allow consumers to select from a large collection of product offerings marketed under private labels and mainstream brands. The rising number of smartphone users with the widespread penetration of the internet across key regions is anticipated to foster online sales of confectionery during the forecast period. As of April 2023, there were 5.18 billion internet users worldwide, which amounted to 64.6% of the global population.
- Convenience stores occupied the second-highest share of 29.47% by value in 2022. The sales are mostly favored by product positioning of products like candies and mints near billing kiosks.
The rising prominence of snacking between the meals across the globe, has fueled the market to grow, with major share of 85% contributed by North America and Europe region
- The global snack bar market observed growth of 7.27% by value in 2023 compared to 2022. Snack bars are expected to be the fastest-growing segment in the global confectionery market over the forecast period. This is significantly due to the rising snack consumption between meals, demanding convenient on-the-go yet wholesome and nutritious snack options among consumers.
- North America is the largest-growing region, with a value share of 66.68% in 2023, with a Y-o-Y value growth rate of 7.66% compared to 2022. The growth is anticipated due to the increasing snacking among consumers across the region. As of 2023, more than 90% of consumers in the United States consumed snacks. In 2022, more than half (51%) of the consumers preferred regular, all-purpose snack bars and sought out other types of bar products.
- Europe is identified to be the second-largest snack bar market globally, expanding at a growth of 6.24% by value in 2023 compared to 2022. The consumption of snack bars is pervasive among European consumers. In 2022, more than half (58%) of United Kingdom consumers, 44% of Germans, and 30% of French consumers snacked between meals, including snack bars, as one of the on-the-go snacks. During 2021-2022, around 96% of the UK population consumed granola/cereal/snack bars at least occasionally.
- South America is the fastest-growing region in the snack bar confectionery market and is likely to attain a value growth of 50.32% during the forecast period. Health-oriented products, such as high-fiber, low-calorie, high-protein, and natural ingredients-containing snack bars, are gaining popularity. In 2022, 56% of consumers in Brazil consumed snack bars at least twice a week. They claimed that they consumed snack bars because they are nutritious and healthy.
Global Snack Bar Market Trends
The rising trend of convenient and healthy on-the-go options, along with the increasing number of fitness enthusiasts, remains the major factor for the market's growth
- Snack bars are largely consumed across developed countries in North America and Europe. In North America, snack bars are highly preferred among working professionals as a replacement for oil-based snacks.
- In the snack bar segment, brand loyalty acquires the first position under product attributes. In North America, it was observed that 43% of consumers chose snack bars of their preferred brands. In Europe, snack bar consumers sought bars that could offer new sensory experiences, especially in shape and texture.
- The fluctuation in the product price is connected with the rise and fall in raw material prices, including cereals, grains, sugar, and others. In North America, in 2023, the average selling prices of cereal bars, protein bars, and fruit and nut bars were USD 6.54, USD 9.36, and USD 7.48, respectively.
- With the availability of snack bars in different flavors, they are enjoyed as a healthy treat by the younger generation. In Europe, consumers are increasingly turning to snack bars such as cereal bars, protein bars, and fruit & nut bars as a perceived healthier option.
Snack Bar Industry Overview
The Snack Bar Market is fragmented, with the top five companies occupying 25.58%. The major players in this market are General Mills Inc., Kellogg Company, Mars Incorporated, Mondelez International Inc. and Nestle SA (sorted alphabetically).
Additional Benefits:
- The market estimate (ME) sheet in Excel format
- 3 months of analyst support
TABLE OF CONTENTS
1 EXECUTIVE SUMMARY & KEY FINDINGS
2 REPORT OFFERS
3 INTRODUCTION
- 3.1 Study Assumptions & Market Definition
- 3.2 Scope of the Study
- 3.3 Research Methodology
4 KEY INDUSTRY TRENDS
- 4.1 Regulatory Framework
- 4.2 Consumer Buying Behavior
- 4.3 Ingredient Analysis
- 4.4 Value Chain & Distribution Channel Analysis
5 MARKET SEGMENTATION (includes market size in Value in USD and Volume, Forecasts up to 2030 and analysis of growth prospects)
- 5.1 Confectionery Variant
- 5.1.1 Cereal Bar
- 5.1.2 Fruit & Nut Bar
- 5.1.3 Protein Bar
- 5.2 Distribution Channel
- 5.2.1 Convenience Store
- 5.2.2 Online Retail Store
- 5.2.3 Supermarket/Hypermarket
- 5.2.4 Others
- 5.3 Region
- 5.3.1 Africa
- 5.3.1.1 By Country
- 5.3.1.1.1 Egypt
- 5.3.1.1.2 Nigeria
- 5.3.1.1.3 South Africa
- 5.3.1.1.4 Rest of Africa
- 5.3.2 Asia-Pacific
- 5.3.2.1 By Country
- 5.3.2.1.1 Australia
- 5.3.2.1.2 China
- 5.3.2.1.3 India
- 5.3.2.1.4 Indonesia
- 5.3.2.1.5 Japan
- 5.3.2.1.6 Malaysia
- 5.3.2.1.7 New Zealand
- 5.3.2.1.8 South Korea
- 5.3.2.1.9 Rest of Asia-Pacific
- 5.3.3 Europe
- 5.3.3.1 By Country
- 5.3.3.1.1 Belgium
- 5.3.3.1.2 France
- 5.3.3.1.3 Germany
- 5.3.3.1.4 Italy
- 5.3.3.1.5 Netherlands
- 5.3.3.1.6 Russia
- 5.3.3.1.7 Spain
- 5.3.3.1.8 Switzerland
- 5.3.3.1.9 Turkey
- 5.3.3.1.10 United Kingdom
- 5.3.3.1.11 Rest of Europe
- 5.3.4 Middle East
- 5.3.4.1 By Country
- 5.3.4.1.1 Bahrain
- 5.3.4.1.2 Kuwait
- 5.3.4.1.3 Oman
- 5.3.4.1.4 Qatar
- 5.3.4.1.5 Saudi Arabia
- 5.3.4.1.6 United Arab Emirates
- 5.3.4.1.7 Rest of Middle East
- 5.3.5 North America
- 5.3.5.1 By Country
- 5.3.5.1.1 Canada
- 5.3.5.1.2 Mexico
- 5.3.5.1.3 United States
- 5.3.5.1.4 Rest of North America
- 5.3.6 South America
- 5.3.6.1 By Country
- 5.3.6.1.1 Argentina
- 5.3.6.1.2 Brazil
- 5.3.6.1.3 Rest of South America
- 5.3.1 Africa
6 COMPETITIVE LANDSCAPE
- 6.1 Key Strategic Moves
- 6.2 Market Share Analysis
- 6.3 Company Landscape
- 6.4 Company Profiles
- 6.4.1 Abbott Laboratories
- 6.4.2 Associated British Foods plc
- 6.4.3 Ferrero International SA
- 6.4.4 General Mills Inc.
- 6.4.5 Halo Foods Ltd
- 6.4.6 Kellogg Company
- 6.4.7 Lotus Bakeries
- 6.4.8 Mars Incorporated
- 6.4.9 Mondelez International Inc.
- 6.4.10 Nestle SA
- 6.4.11 PepsiCo Inc.
- 6.4.12 Post Holdings Inc.
- 6.4.13 Simply Good Foods Co.
- 6.4.14 The Hershey Company
7 KEY STRATEGIC QUESTIONS FOR CONFECTIONERY CEOS
8 APPENDIX
- 8.1 Global Overview
- 8.1.1 Overview
- 8.1.2 Porter's Five Forces Framework
- 8.1.3 Global Value Chain Analysis
- 8.1.4 Market Dynamics (DROs)
- 8.2 Sources & References
- 8.3 List of Tables & Figures
- 8.4 Primary Insights
- 8.5 Data Pack
- 8.6 Glossary of Terms
