
|
市場調査レポート
商品コード
1684061
建設補修・改修用化学品-市場シェア分析、産業動向・統計、成長予測(2025年~2030年)Construction Repair and Rehabilitation Chemicals - Market Share Analysis, Industry Trends & Statistics, Growth Forecasts (2025 - 2030) |
||||||
カスタマイズ可能
適宜更新あり
|
|||||||
| 建設補修・改修用化学品-市場シェア分析、産業動向・統計、成長予測(2025年~2030年) |
|
出版日: 2025年03月18日
発行: Mordor Intelligence
ページ情報: 英文 325 Pages
納期: 2~3営業日
|

全表示
- 概要
- 目次
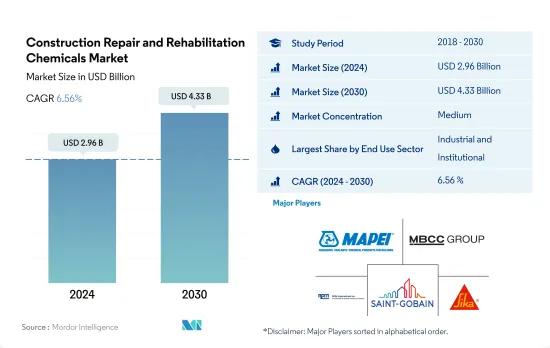
建設補修・改修用化学品市場規模は2024年に29億6,000万米ドルと推定・予測され、2030年には43億3,000万米ドルに達し、市場推計・予測期間(2024年~2030年)のCAGRは6.56%で成長すると予測されます。
産業建設の増加が建設補修・改修用化学品の需要を牽引しそうだ
- 建設補修・改修用化学品の世界市場は、2022年に金額で4.72%の成長を遂げたが、これは商業・工業・施設建設部門からの需要増に牽引されたものです。この成長は2023年も続くと推定され、2022年比4.64%の成長が予測されます。
- 2022年には、工業・施設セクターが圧倒的な消費者として浮上し、建設補修・改修用化学品市場の約48.20%を占めました。このセクターの床面積は2023年に90億2,000万平方フィート拡大すると予想されており、これは主に工業、教育、ヘルスケア建設への投資増加によるものです。その結果、このセクターの建設補修・改修用化学品の需要は2023年に約5.25%増加すると予想されます。
- 今後、産業・施設セクターは成長軌道を維持し、2023年から2030年までのCAGRは金額ベースで7%と予測されます。このセクターの世界の既存床面積は2023年に3,600億平方フィートに達し、2030年にはさらに4,290億平方フィートになると予測されます。さらに、インド、インドネシア、ベトナムなどの経済が急拡大しており、これらの国の効率的な工場の需要を満たす工業用不動産の必要性に大きな影響を与えています。その結果、この分野の補修・再生化学品市場は、2023年の13億3,000万米ドルから2030年には21億5,000万米ドルに急増すると予想されています。
- そのため、予測期間中に大幅な成長が見込まれます。
建設補修・改修用化学品市場の将来はアジア太平洋諸国のGDP成長に影響される
- 世界の建設補修・改修用化学品市場は、2022年に金額ベースで5%増加したが、これは建築物やインフラの改修の急増が原動力となっています。これらのイニシアチブは、経済成長を促進し、エネルギー効率基準を強化することを目的としています。世界の建設補修・改修用化学品市場は、北米とアジア太平洋が牽引し、2023年には金額ベースでさらに4.6%の成長を記録すると予測されています。
- 中国、日本、インドなどの国々が牽引するアジア太平洋は、建設補修・改修用化学品の世界消費を支配しています。この3カ国だけで2022年の市場金額の28%を占めています。特筆すべきは、注入グラウト材に続いて、マイクロコンクリートモルタルがアジア太平洋市場に大きく貢献したことです。
- 欧州は建設補修・改修用化学品の消費量で第2位にランクされており、ドイツ、フランス、英国が主な貢献国です。2022年には、これら3カ国が欧州の市場額の47%近くを占める。産業、施設、インフラ分野が欧州における化学物質の主要消費者です。
- アジア太平洋地域は、2023年から2030年までの金額ベースのCAGRが7.12%で、建設補修・改修用化学品市場で最も高い成長を遂げると予測されています。この成長は、インド、中国、タイ、日本を含むこの地域の堅調な経済によって促進されると思われます。特に、中国とインドのGDPはそれぞれ年率5.2%と5.9%で成長しています。
世界の建設補修・改修用化学品市場の動向
商業建設投資とオフィススペースの増加が商業セクターを押し上げる可能性が高い
- 2022年、世界の商業セクターは、オフィス、ホテル、小売モールのような不動産需要の急増に牽引され、床面積が2%増加しました。特筆すべきはインドの小売業界で、上位7都市でモール面積が260万平方フィートを超え、2021年から27%急増しました。翌2023年には、世界の商業セクターの床面積が約68億平方フィート急増したが、これは主に外国直接投資(FDI)の急増に後押しされたもので、世界中で新たなオフィス、倉庫、小売店舗が必要となりました。
- 2018年から2021年にかけて、世界の商業セクターの床面積は6.33%拡大しました。2021年には、世界のほぼ390の大都市でオフィスの稼働率が80%以上の堅調な伸びを示しました。さらに、2021年第3四半期からは、3,000万平方フィートのオフィススペースが純吸収されました。その結果、2021年の世界の商業セクターの床面積は前年比で約65億平方フィート拡大しました。
- 予測によると、世界の商業セクターの床面積は予測期間中、数量ベースでCAGR 2.21%を記録します。この成長の原動力となっているのは、商業建設支出とオフィススペースに対する需要の高まりです。例えば、米国の商業施設建設支出は2027年までに6,460億米ドルに達する見込みです。インドでは、上位7都市のグレードAオフィス市場が2026年までに約10億平方フィートに拡大し、さらに2030年までに12億平方フィートに拡大すると予想されています。
住宅需要の増加と改修投資が住宅セクターの建設を後押しする可能性が高い
- 2022年、世界の住宅セクターは、人口増加、富裕層の増加、急速な都市化などの要因によって、既存床面積が1.35%増加しました。特に住宅建設部門は、主に住宅数の増加により、2023年には約282億平方フィートの床面積の急増を示しました。特に米国では、2023年までに2億4,119万戸の住宅が建設されると予測されています。
- 2018年から2021年の間に、世界の住宅部門の床面積は数量ベースで約4.05%拡大しました。2020年には、住宅部門は世界の建設業界の44%を占め、最大のサブセクターとしての地位を固め、世界成長の重要な原動力となりました。2021年の世界の住宅床面積は約276億平方フィート増加し、米国だけで133万戸の住宅が完成し、前年比4%増となりました。
- 今後、世界の住宅セクターの床面積は数量ベースで1.50%のCAGRで推移すると予測されます。この成長は、持続的な住宅需要、投資の増加、政府の支援政策によって促進されるであろう。手ごろな価格の住宅が重視されることで、世界の住宅建設セクターは活気を取り戻し、回復の一助となると思われます。例えばインドでは、拡大する都市人口のニーズを満たすため、2030年までにさらに2,500万戸の手頃な価格の住宅が必要になると推定されています。また、欧州では2030年までに住宅改修に約25億ユーロを投資する計画があります。
建設補修・改修用化学品産業の概要
建設補修・改修用化学品市場は適度に統合されており、上位5社で51.58%を占めています。この市場の主要企業は以下の通り。 MAPEI S.p.A., MBCC Group, RPM International Inc., Saint-Gobain and Sika AG(sorted alphabetically).
その他の特典
- エクセル形式の市場予測(ME)シート
- 3ヶ月のアナリストサポート
目次
第1章 エグゼクティブサマリーと主な調査結果
第2章 レポートのオファー
第3章 イントロダクション
- 調査の前提条件と市場定義
- 調査範囲
- 調査手法
第4章 主要産業動向
- 最終用途分野の動向
- 商業
- 産業・施設
- 住宅
- 規制の枠組み
- バリューチェーンと流通チャネル分析
第5章 市場セグメンテーション
- 最終用途部門
- 商業
- 産業・施設
- インフラ
- 住宅
- サブ製品
- ファイバーラッピングシステム
- 注入グラウト材
- マイクロコンクリートモルタル
- 改質モルタル
- 鉄筋保護材
- 地域
- アジア太平洋
- 国別
- オーストラリア
- 中国
- インド
- インドネシア
- 日本
- マレーシア
- 韓国
- タイ
- ベトナム
- その他のアジア太平洋
- 欧州
- 国別
- フランス
- ドイツ
- イタリア
- ロシア
- スペイン
- 英国
- その他の欧州
- 中東・アフリカ
- 国別
- サウジアラビア
- アラブ首長国連邦
- その他の中東・アフリカ
- 北米
- 国別
- カナダ
- メキシコ
- 米国
- 南米
- 国別
- アルゼンチン
- ブラジル
- その他の南米
- アジア太平洋
第6章 競合情勢
- 主要な戦略動向
- 市場シェア分析
- 企業情勢
- 企業プロファイル
- Ardex Group
- Fosroc, Inc.
- MAPEI S.p.A.
- MBCC Group
- MC-Bauchemie
- Remmers Gruppe AG
- RPM International Inc.
- Saint-Gobain
- Sika AG
- Simpson Strong-Tie Company, Inc.
第7章 CEOへの主な戦略的質問CEOへの主な戦略的質問
第8章 付録
- 世界概要
- 概要
- ファイブフォース分析フレームワーク(産業魅力度分析)
- 世界・バリューチェーン分析
- 市場力学(DROs)
- 情報源と参考文献
- 図表一覧
- 主要洞察
- データパック
- 用語集
The Construction Repair and Rehabilitation Chemicals Market size is estimated at 2.96 billion USD in 2024, and is expected to reach 4.33 billion USD by 2030, growing at a CAGR of 6.56% during the forecast period (2024-2030).
Rising industrial construction is likely to drive the demand for repair and rehabilitation chemicals
- The global market for repair and rehabilitation chemicals experienced a 4.72% growth in value in 2022, driven by rising demand from the commercial and industrial and institutional construction sectors. This growth was estimated to continue in 2023, with a projected rate of 4.64% compared to 2022.
- In 2022, the industrial and institutional sector emerged as the dominant consumer, accounting for approximately 48.20% of the repair and rehabilitation chemicals market. This sector's floor area was set to expand by 9.02 billion square feet in 2023, primarily fueled by increased investments in industrial, education, and healthcare construction. Consequently, the demand for repair and rehabilitation chemicals in this sector is expected to rise by about 5.25% in 2023.
- Looking ahead, the industrial and institutional sector is poised to maintain its growth trajectory, with a projected CAGR of 7% in value from 2023 to 2030. The global existing floor area for this sector is forecasted to reach 360 billion square feet in 2023 and further climb to 429 billion square feet by 2030, driven by heightened industrial construction investments worldwide. Furthermore, several economies such as India, Indonesia, and Vietnam have shown rapid expansion that considerably impacted the need for an industrial property to meet the demands of efficient factories in the countries. As a result, the market for repair and rehabilitation chemicals in this sector is anticipated to surge from USD 1.33 billion in 2023 to USD 2.15 billion in 2030.
- Therefore, the market studied is expected to witness substantial growth during the forecast period.
The future of the construction repair and rehabilitation chemicals market is set to be influenced by the GDP growth of Asia-Pacific countries
- The global construction repair and rehabilitation chemicals market witnessed a 5% increase in terms of value in 2022, driven by a surge in building and infrastructure renovations. These initiatives aimed to boost economic growth and enhance energy efficiency standards. The global construction repair and rehabilitation chemicals market is projected to record a further 4.6% growth in 2023 by value, with North America and Asia-Pacific leading the way.
- Asia-Pacific, led by countries such as China, Japan, and India, dominates the global consumption of repair and rehabilitation chemicals. These three nations alone accounted for 28% of the market's value in 2022. Notably, micro-concrete mortars emerged as a significant contributor to the Asia-Pacific market, following injection grouting materials.
- Europe ranks second in terms of repair and rehabilitation chemical consumption, with Germany, France, and the United Kingdom being the primary contributors. In 2022, these three countries represented nearly 47% of Europe's market value. The industrial, institutional, and infrastructure segments are the major consumers of these chemicals in Europe.
- Asia-Pacific is projected to witness the highest growth in the construction repair and rehabilitation chemicals market, with a CAGR of 7.12% in terms of value from 2023 to 2030. This growth is likely to be fueled by the region's robust economies, including India, China, Thailand, and Japan. Notably, China and India's GDPs are growing at annual rates of 5.2% and 5.9%, respectively.
Global Construction Repair and Rehabilitation Chemicals Market Trends
Rising commercial construction investment and office spaces are likely to boost the commercial sector
- In 2022, the global commercial sector witnessed a 2% increase in its floor area, driven by a surge in demand for properties like offices, hotels, and retail malls. Notably, the Indian retail industry saw a significant uptick, with its top seven cities adding over 2.6 million sq. ft of mall space, marking a 27% jump from 2021. The following year, in 2023, the global commercial sector's floor area surged by approximately 6.8 billion sq. ft, largely propelled by a surge in foreign direct investment (FDI), necessitating new offices, warehouses, and retail outlets worldwide.
- Between 2018 and 2021, the global commercial sector's floor area expanded by 6.33% in volume. In 2021, office occupancy witnessed a robust growth of over 80% across nearly 390 metro cities globally. Additionally, from Q3 2021, there was a net absorption of 30 million sq. ft. of office space. Consequently, the global commercial sector's floor area swelled by approximately 6.5 billion sq. ft. in 2021 compared to the previous year.
- Projections indicate that the global commercial sector's floor area will register a CAGR of 2.21% in volume during the forecast period. This growth is fueled by heightened demand for commercial construction spending and office spaces. For instance, commercial construction spending in the United States is set to hit USD 646 billion by 2027. In India, the Grade A office market in the top seven cities is expected to expand to nearly 1 billion sq. ft by 2026 and further to 1.2 billion sq. ft by 2030.
Increasing demand for housing units and investments in renovation are likely to boost residential sector constructions
- In 2022, the global residential sector witnessed a 1.35% increase in its existing floor area, driven by factors like population growth, rising wealth, and rapid urbanization. The residential construction sector, specifically, saw a surge of around 28.2 billion sq. ft in its floor area in 2023, primarily due to a rise in the number of homes. Notably, the United States was projected to have 241.19 million homes by 2023.
- Between 2018 and 2021, the global residential sector's floor area expanded by approximately 4.05% in terms of volume. In 2020, the residential sector accounted for 44% of the global construction industry, solidifying its position as the largest subsector and a key driver of global growth. The global residential floor area grew by about 27.6 billion sq. ft in 2021, with the United States alone completing 1.33 million housing units, marking a 4% increase from the previous year.
- Looking ahead, the global residential sector's floor area is projected to witness a CAGR of 1.50% in terms of volume. This growth will be fueled by sustained housing demand, increased investments, and supportive government policies. The emphasis on affordable housing is set to rejuvenate the global residential construction sector, aiding its recovery. For instance, it is estimated that India will require an additional 25 million affordable housing units by 2030 to meet the needs of its expanding urban population. Additionally, Europe has plans to invest approximately EUR 2.5 billion in residential dwelling renovations by 2030.
Construction Repair and Rehabilitation Chemicals Industry Overview
The Construction Repair and Rehabilitation Chemicals Market is moderately consolidated, with the top five companies occupying 51.58%. The major players in this market are MAPEI S.p.A., MBCC Group, RPM International Inc., Saint-Gobain and Sika AG (sorted alphabetically).
Additional Benefits:
- The market estimate (ME) sheet in Excel format
- 3 months of analyst support
TABLE OF CONTENTS
1 EXECUTIVE SUMMARY & KEY FINDINGS
2 REPORT OFFERS
3 INTRODUCTION
- 3.1 Study Assumptions & Market Definition
- 3.2 Scope of the Study
- 3.3 Research Methodology
4 KEY INDUSTRY TRENDS
- 4.1 End Use Sector Trends
- 4.1.1 Commercial
- 4.1.2 Industrial and Institutional
- 4.1.3 Residential
- 4.2 Regulatory Framework
- 4.3 Value Chain & Distribution Channel Analysis
5 MARKET SEGMENTATION (includes market size, forecasts up to 2030 and analysis of growth prospects.)
- 5.1 End Use Sector
- 5.1.1 Commercial
- 5.1.2 Industrial and Institutional
- 5.1.3 Infrastructure
- 5.1.4 Residential
- 5.2 Sub Product
- 5.2.1 Fiber Wrapping Systems
- 5.2.2 Injection Grouting Materials
- 5.2.3 Micro-concrete Mortars
- 5.2.4 Modified Mortars
- 5.2.5 Rebar Protectors
- 5.3 Region
- 5.3.1 Asia-Pacific
- 5.3.1.1 By Country
- 5.3.1.1.1 Australia
- 5.3.1.1.2 China
- 5.3.1.1.3 India
- 5.3.1.1.4 Indonesia
- 5.3.1.1.5 Japan
- 5.3.1.1.6 Malaysia
- 5.3.1.1.7 South Korea
- 5.3.1.1.8 Thailand
- 5.3.1.1.9 Vietnam
- 5.3.1.1.10 Rest of Asia-Pacific
- 5.3.2 Europe
- 5.3.2.1 By Country
- 5.3.2.1.1 France
- 5.3.2.1.2 Germany
- 5.3.2.1.3 Italy
- 5.3.2.1.4 Russia
- 5.3.2.1.5 Spain
- 5.3.2.1.6 United Kingdom
- 5.3.2.1.7 Rest of Europe
- 5.3.3 Middle East and Africa
- 5.3.3.1 By Country
- 5.3.3.1.1 Saudi Arabia
- 5.3.3.1.2 United Arab Emirates
- 5.3.3.1.3 Rest of Middle East and Africa
- 5.3.4 North America
- 5.3.4.1 By Country
- 5.3.4.1.1 Canada
- 5.3.4.1.2 Mexico
- 5.3.4.1.3 United States
- 5.3.5 South America
- 5.3.5.1 By Country
- 5.3.5.1.1 Argentina
- 5.3.5.1.2 Brazil
- 5.3.5.1.3 Rest of South America
- 5.3.1 Asia-Pacific
6 COMPETITIVE LANDSCAPE
- 6.1 Key Strategic Moves
- 6.2 Market Share Analysis
- 6.3 Company Landscape
- 6.4 Company Profiles
- 6.4.1 Ardex Group
- 6.4.2 Fosroc, Inc.
- 6.4.3 MAPEI S.p.A.
- 6.4.4 MBCC Group
- 6.4.5 MC-Bauchemie
- 6.4.6 Remmers Gruppe AG
- 6.4.7 RPM International Inc.
- 6.4.8 Saint-Gobain
- 6.4.9 Sika AG
- 6.4.10 Simpson Strong-Tie Company, Inc.
7 KEY STRATEGIC QUESTIONS FOR CONCRETE, MORTARS AND CONSTRUCTION CHEMICALS CEOS
8 APPENDIX
- 8.1 Global Overview
- 8.1.1 Overview
- 8.1.2 Porter's Five Forces Framework (Industry Attractiveness Analysis)
- 8.1.3 Global Value Chain Analysis
- 8.1.4 Market Dynamics (DROs)
- 8.2 Sources & References
- 8.3 List of Tables & Figures
- 8.4 Primary Insights
- 8.5 Data Pack
- 8.6 Glossary of Terms

