
インドの建設用化学品-市場シェア分析、産業動向と統計、成長予測(2025年~2030年)
India Construction Chemicals - Market Share Analysis, Industry Trends & Statistics, Growth Forecasts (2025 - 2030)- 発行日
- ページ情報
- 英文 366 Pages
- 納期
- 2~3営業日
- 商品コード
- 1687903
- カスタマイズ可能 お客様のご希望に応じて、既存データの加工や未掲載情報(例:国別セグメント)の追加などの対応が可能です。詳細はお問い合わせください。
- 適宜更新あり 本レポートは最新情報反映のため適宜更新し、内容構成変更を行う場合があります。ご検討の際はお問い合わせください。
- 翻訳ツール提供対象 PDF対応AI翻訳ツールの無料貸し出しサービスのご利用が可能です
概要
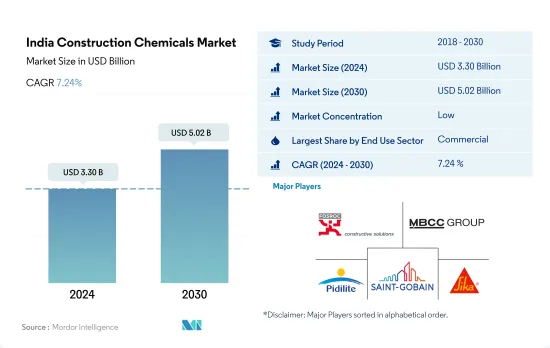
インドの建設用化学品市場規模は2024年に33億米ドルと推定され、2030年には50億2,000万米ドルに達すると予測され、予測期間中(2024~2030年)のCAGRは7.24%で成長する見込みです。
商業・住宅部門がインドの建設用化学品市場の成長を牽引
- インドの建設用化学品市場は、収益性では世界第3位、成長率ではトップです。2022年には、複数の部門にわたる建設活動と支出の増加により、市場規模が6.97%急増しました。2023年も、堅調な不動産とインフラの開発により、市場は6.9%増と上昇基調を維持すると予測されました。
- 政府機関であれ民間団体であれ、その資金源である商業セクターが建設用化学品の需要を支配しています。このような資金的な裏付けにより、住宅やその他の建物タイプに比べ、商業プロジェクトでは建設用化学品への投資がより身近なものとなっています。さらに、高密度で複雑な設計で知られる商業ビルでは、より幅広い種類の建築用化学品が必要となります。
- 住宅部門は、建設用化学品にとって2番目に有利な部門として、僅差で続いています。インドが世界で最も人口の多い国であることは、相当数の住宅を建設することにつながり、需要と市場規模を押し上げています。さらに、防水ソリューションへの一貫した需要が、このセグメントの重要性をさらに高めています。
- 住宅と商業セクターの市場規模は、他のセクターと同程度かつそれ以上の速度で上昇すると推定され、市場推定・予測期間(2023~2030年)のCAGRは7.9%と7.4%を記録します。これらの成長率は、住宅建設促進などの政府の取り組みや、国内外からの投資を誘致するビジネスフレンドリーな環境が後押ししていると推定されます。
インドの建設用化学品市場動向
インドのグレードAオフィス市場は2030年までに12億平方フィートに達すると予想され、商業建築部門の需要を牽引するとみられます。
- 2022年、インドの新規商業床面積は2021年比で6.2%の伸びを示しました。小売セクター、特に上位7都市(デリーNCR、バンガロール、ハイデラバード、ムンバイ、プネー、チェンナイ、コルカタ)では、旺盛な需要が見られ、モール面積は260万平方フィートを超え、2021年から27%増加しました。2023年を展望すると、外国直接投資(FDI)の急増が新たなオフィス、小売店、その他施設の必要性を煽り、このセクターの新規床面積は3,800万平方フィート急増すると予想されます。特に、2023年の建設開発へのFDI資本流入額は9,600万米ドルに達すると予測されています。
- 2020年、インドの商業施設の新設床面積は2019年比で68.3%減少しました。この減少は主に政府による全国的な封鎖が原因で、進行中のプロジェクトが中断され、サプライチェーンが緊張し、労働力の確保に影響を与えました。しかし、2021年に規制が緩和されると、新規床面積が約5億2,600万平方フィート急増し、大幅な回復が見られました。さらに、2021年にはグリーンビルディングへの取り組みが顕著に増加し、商業プロジェクトの約55%が持続可能性を取り入れ、このセグメントの需要をさらに押し上げました。
- 2030年を展望すると、インドの商業施設の新設床面積は3億5,800万平方フィートに達すると予測され、2023年から大幅に急増します。この急増により、ショッピングモール、オフィススペース、その他の商業施設に対する需要が高まっています。例えば、上位7都市におけるインドのグレードAオフィス市場は、2026年までに10億平方フィートに拡大し、2030年までにさらに12億平方フィートに拡大します。その結果、同国の商業施設の新設床面積は、予測期間中にCAGR 5.26%という堅調な伸びを記録する展望です。
住宅需要の増加と不動産セクターの拡大が住宅セクターの需要を押し上げる
- 2022年、インドの住宅床面積は前年を上回る9.4%の伸びを示しました。国内の住宅需要は急増し、上位7都市(デリーNCR、バンガロール、ハイデラバード、ムンバイ、プネー、チェンナイ、コルカタ)の合計で約40万2,000戸が新たに建設され、2021年から44%増加しました。2023年第1四半期には、これらの都市の住宅販売戸数は11.4万戸に達し、前年から9.95万戸以上も急増しました。その結果、インドの住宅新築床面積は2023年には2022年比で約7,100万平方フィート拡大すると予測されました。
- 2020年、インドの住宅セクターは後退に直面し、新設床面積は前年比6.25%減少しました。この減少は、全国的な封鎖、サプライチェーンの混乱、労働力不足、建設生産性の低下、外国投資の落ち込みが原因です。しかし、2021年にはインドの住宅不動産市場は回復し、上位7都市で約16万3,000戸の新築住宅が増加しました。この急増により、2021年の住宅セクターの新設床面積は2020年比で約6億4,900万平方フィートと大幅に増加しました。
- 今後、インドの住宅セクターは、2023~2030年にかけて、数量ベースでCAGR 2.95%を示す展望です。この成長は、持続的な住宅需要、投資の増加、有利な政府施策によるものです。特に、2030年までにインドの人口の40%以上が都市部に居住するようになり、手頃な価格の住宅が約2,500万戸追加される需要が高まると予測されています。さらに、2030年までに住宅不動産市場は主要都市で150万戸に達すると予想されており、このセグメントの需要をさらに促進しています。
インドの建設用化学品産業概要
インドの建設用化学品市場は細分化されており、上位5社で18.71%を占めています。同市場の主要企業は以下の通りです。 Fosroc, Inc., MBCC Group, Pidilite Industries Ltd., Saint-Gobain and Sika AG
その他の特典
- エクセル形式の市場予測(ME)シート
- 3ヶ月のアナリストサポート
目次
第1章 エグゼクティブサマリーと主要調査結果
第2章 レポートのオファー
第3章 イントロダクション
- 調査の前提条件と市場定義
- 調査範囲
- 調査手法
第4章 主要産業動向
- 最終用途セグメントの動向
- 商業
- 産業・施設
- インフラ
- 住宅用
- 主要インフラプロジェクト(現在と発表済み)
- 規制の枠組み
- バリューチェーンと流通チャネル分析
第5章 市場セグメンテーション
- 最終用途セグメント
- 商業
- 産業・施設
- インフラ
- 住宅用
- 製品
- 接着剤
- サブプロダクト別
- ホットメルト
- 反応性
- 溶剤系
- 水性
- アンカーとグラウト
- サブプロダクト別
- セメント系固定材
- 樹脂固定
- その他
- コンクリート混和剤
- サブプロダクト別
- 促進剤
- 空気混入混和剤
- 高範囲減水剤(超可塑剤)
- 遅延剤
- 収縮低減混和剤
- 粘度調整剤
- 減水剤(可塑剤)
- その他
- コンクリート保護塗料
- サブプロダクト別
- アクリル系
- アルキド
- エポキシ
- ポリウレタン
- その他
- フローリング用樹脂
- サブプロダクト別
- アクリル
- エポキシ
- ポリアスパラギン
- ポリウレタン
- その他
- 補修・再生ケミカル
- サブプロダクト別
- ファイバーラッピングシステム
- 注入グラウト材
- マイクロコンクリートモルタル
- 改質モルタル
- 鉄筋保護材
- シーリング材
- サブプロダクト別
- アクリル
- エポキシ
- ポリウレタン
- シリコーン
- その他
- 表面処理薬品
- サブプロダクト別
- 硬化コンパウンド
- 離型剤
- その他
- 防水ソリューション
- サブプロダクト別
- 化学製品
- メンブレン
- 接着剤
第6章 競合情勢
- 主要な戦略動向
- 市場シェア分析
- 企業情勢
- 企業プロファイル
- Ardex Group
- Don Construction Products Ltd.
- ECMAS Group
- Fosroc, Inc.
- MAPEI S.p.A.
- MBCC Group
- Pidilite Industries Ltd.
- Saint-Gobain
- Sika AG
- Thermax Limited
第7章 CEOへの主要戦略的質問
第8章 付録
- 世界概要
- 概要
- ファイブフォース分析フレームワーク(産業魅力度分析)
- 世界のバリューチェーン分析
- 市場力学(DROs)
- 情報源と参考文献
- 図表一覧
- 主要洞察
- データパック
- 用語集
目次
Product Code: 66762
The India Construction Chemicals Market size is estimated at 3.30 billion USD in 2024, and is expected to reach 5.02 billion USD by 2030, growing at a CAGR of 7.24% during the forecast period (2024-2030).
The commercial and residential sectors are leading the growth of the construction chemicals market in India
- India's construction chemicals market ranks third globally in profitability and is the leader in terms of growth. In 2022, the market surged by 6.97% in value, driven by increased construction activity and spending across several sectors. The market was projected to maintain its upward trajectory in 2023, with a 6.9% increase owing to robust real estate and infrastructure developments.
- The commercial sector dominates the demand for construction chemicals, given its funding sources, be it government or private entities. This financial backing makes investing in construction chemicals more accessible in commercial projects compared to residential or other building types. Moreover, commercial buildings, known for their higher densities and intricate designs, necessitate a wider range of construction chemicals.
- The residential sector follows closely as the second most lucrative sector for construction chemicals. India's status as the world's most populous nation translates into a significant number of residential buildings, driving up demand and market value. Additionally, the sector's consistent demand for waterproofing solutions further bolsters its significance.
- The market's value in the residential and commercial sectors is estimated to rise at similar and faster rates than the rest, recording CAGRs of 7.9% and 7.4% during the forecast period (2023-2030). These growth rates are estimated to be propelled by government initiatives, such as housing unit construction drives, and a business-friendly environment attracting both domestic and foreign investments.
India Construction Chemicals Market Trends
India's Grade A office market is expected to reach 1.2 billion sq. ft by 2030 and is likely to drive the demand for the commercial construction sector
- In 2022, India's new commercial floor area saw a 6.2% volume growth compared to 2021. The retail sector, particularly in the top seven cities (Delhi NCR, Bangalore, Hyderabad, Mumbai, Pune, Chennai, and Kolkata), witnessed robust demand, adding over 2.6 million sq. ft of mall space, a 27% increase from 2021. Looking ahead to 2023, the sector's new floor area is expected to surge by 38 million sq. ft, driven by a surge in foreign direct investment (FDI) fueling the need for new offices, retail outlets, and other facilities. Notably, the FDI equity inflow for construction development in 2023 was projected to hit USD 96 million.
- In 2020, India's commercial new floor area plummeted by 68.3% in volume compared to 2019. This decline was primarily due to a nationwide lockdown imposed by the government, which disrupted ongoing projects, strained supply chains, and impacted labor availability. However, as restrictions eased in 2021, the country witnessed a significant rebound, with the new floor area surging by approximately 526 million sq. ft. Additionally, 2021 saw a notable uptick in green building initiatives, with around 55% of commercial projects embracing sustainability, further bolstering the demand for the sector.
- Looking ahead to 2030, India's commercial new floor area is projected to hit 358 million sq. ft, a significant jump from 2023. This surge drives a growing appetite for shopping malls, office spaces, and other commercial facilities. For instance, India's Grade A office market in the top seven cities is set to expand to 1 billion sq. ft by 2026 and further to 1.2 billion sq. ft by 2030. Consequently, the country's commercial new floor area is poised to witness a robust CAGR of 5.26% during the forecast period.
Rise in demand for housing units and increasing real estate sector to boost residential sector demand
- In 2022, India witnessed a 9.4% growth in residential floor area, outpacing the previous year. The demand for housing in the country surged, with the top seven cities (Delhi NCR, Bangalore, Hyderabad, Mumbai, Pune, Chennai, and Kolkata) collectively adding approximately 402,000 new units, marking a 44% increase from 2021. In Q1 2023, housing sales in these cities reached 1.14 lakh units, a staggering jump of over 99,500 units from the previous year. Consequently, it was projected that the residential new floor area in India would expand by approximately 71 million sq. ft in 2023 compared to 2022.
- In 2020, the residential sector in India faced a setback, witnessing a 6.25% decline in new floor area compared to the previous year. This decline was attributed to the nationwide lockdown, disruptions in the supply chain, labor shortages, reduced construction productivity, and a dip in foreign investments. However, in 2021, the Indian residential real estate market rebounded, adding around 163,000 new residential units across the top seven cities. This surge translated into a significant increase of about 649 million sq. ft in the residential sector's new floor area in 2021 compared to 2020.
- Looking ahead, the residential sector in India is poised to exhibit a CAGR of 2.95% in terms of volume from 2023 to 2030. This growth can be attributed to sustained housing demand, increased investments, and favorable government policies. Notably, by 2030, it is projected that over 40% of India's population will reside in urban areas, driving a demand for approximately 25 million additional affordable housing units. Furthermore, by 2030, the residential real estate market is expected to hit 1.5 million units in key cities, further fueling the demand in the sector.
India Construction Chemicals Industry Overview
The India Construction Chemicals Market is fragmented, with the top five companies occupying 18.71%. The major players in this market are Fosroc, Inc., MBCC Group, Pidilite Industries Ltd., Saint-Gobain and Sika AG (sorted alphabetically).
Additional Benefits:
- The market estimate (ME) sheet in Excel format
- 3 months of analyst support
TABLE OF CONTENTS
1 EXECUTIVE SUMMARY & KEY FINDINGS
2 REPORT OFFERS
3 INTRODUCTION
- 3.1 Study Assumptions & Market Definition
- 3.2 Scope of the Study
- 3.3 Research Methodology
4 KEY INDUSTRY TRENDS
- 4.1 End Use Sector Trends
- 4.1.1 Commercial
- 4.1.2 Industrial and Institutional
- 4.1.3 Infrastructure
- 4.1.4 Residential
- 4.2 Major Infrastructure Projects (current And Announced)
- 4.3 Regulatory Framework
- 4.4 Value Chain & Distribution Channel Analysis
5 MARKET SEGMENTATION (includes market size, forecasts up to 2030 and analysis of growth prospects.)
- 5.1 End Use Sector
- 5.1.1 Commercial
- 5.1.2 Industrial and Institutional
- 5.1.3 Infrastructure
- 5.1.4 Residential
- 5.2 Product
- 5.2.1 Adhesives
- 5.2.1.1 By Sub Product
- 5.2.1.1.1 Hot Melt
- 5.2.1.1.2 Reactive
- 5.2.1.1.3 Solvent-borne
- 5.2.1.1.4 Water-borne
- 5.2.2 Anchors and Grouts
- 5.2.2.1 By Sub Product
- 5.2.2.1.1 Cementitious Fixing
- 5.2.2.1.2 Resin Fixing
- 5.2.2.1.3 Other Types
- 5.2.3 Concrete Admixtures
- 5.2.3.1 By Sub Product
- 5.2.3.1.1 Accelerator
- 5.2.3.1.2 Air Entraining Admixture
- 5.2.3.1.3 High Range Water Reducer (Super Plasticizer)
- 5.2.3.1.4 Retarder
- 5.2.3.1.5 Shrinkage Reducing Admixture
- 5.2.3.1.6 Viscosity Modifier
- 5.2.3.1.7 Water Reducer (Plasticizer)
- 5.2.3.1.8 Other Types
- 5.2.4 Concrete Protective Coatings
- 5.2.4.1 By Sub Product
- 5.2.4.1.1 Acrylic
- 5.2.4.1.2 Alkyd
- 5.2.4.1.3 Epoxy
- 5.2.4.1.4 Polyurethane
- 5.2.4.1.5 Other Resin Types
- 5.2.5 Flooring Resins
- 5.2.5.1 By Sub Product
- 5.2.5.1.1 Acrylic
- 5.2.5.1.2 Epoxy
- 5.2.5.1.3 Polyaspartic
- 5.2.5.1.4 Polyurethane
- 5.2.5.1.5 Other Resin Types
- 5.2.6 Repair and Rehabilitation Chemicals
- 5.2.6.1 By Sub Product
- 5.2.6.1.1 Fiber Wrapping Systems
- 5.2.6.1.2 Injection Grouting Materials
- 5.2.6.1.3 Micro-concrete Mortars
- 5.2.6.1.4 Modified Mortars
- 5.2.6.1.5 Rebar Protectors
- 5.2.7 Sealants
- 5.2.7.1 By Sub Product
- 5.2.7.1.1 Acrylic
- 5.2.7.1.2 Epoxy
- 5.2.7.1.3 Polyurethane
- 5.2.7.1.4 Silicone
- 5.2.7.1.5 Other Resin Types
- 5.2.8 Surface Treatment Chemicals
- 5.2.8.1 By Sub Product
- 5.2.8.1.1 Curing Compounds
- 5.2.8.1.2 Mold Release Agents
- 5.2.8.1.3 Other Product Types
- 5.2.9 Waterproofing Solutions
- 5.2.9.1 By Sub Product
- 5.2.9.1.1 Chemicals
- 5.2.9.1.2 Membranes
- 5.2.1 Adhesives
6 COMPETITIVE LANDSCAPE
- 6.1 Key Strategic Moves
- 6.2 Market Share Analysis
- 6.3 Company Landscape
- 6.4 Company Profiles
- 6.4.1 Ardex Group
- 6.4.2 Don Construction Products Ltd.
- 6.4.3 ECMAS Group
- 6.4.4 Fosroc, Inc.
- 6.4.5 MAPEI S.p.A.
- 6.4.6 MBCC Group
- 6.4.7 Pidilite Industries Ltd.
- 6.4.8 Saint-Gobain
- 6.4.9 Sika AG
- 6.4.10 Thermax Limited
7 KEY STRATEGIC QUESTIONS FOR CONCRETE, MORTARS AND CONSTRUCTION CHEMICALS CEOS
8 APPENDIX
- 8.1 Global Overview
- 8.1.1 Overview
- 8.1.2 Porter's Five Forces Framework (Industry Attractiveness Analysis)
- 8.1.3 Global Value Chain Analysis
- 8.1.4 Market Dynamics (DROs)
- 8.2 Sources & References
- 8.3 List of Tables & Figures
- 8.4 Primary Insights
- 8.5 Data Pack
- 8.6 Glossary of Terms
インドの建設用化学品-市場シェア分析、産業動向と統計、成長予測(2025年~2030年)
- 発行日
- 発行
- Mordor Intelligence
- ページ情報
- 英文 366 Pages
- 納期
- 2~3営業日


