
アジア太平洋地域の建設用化学品:市場シェア分析、産業動向・統計、成長予測(2025年~2030年)
Asia-Pacific Construction Chemicals - Market Share Analysis, Industry Trends & Statistics, Growth Forecasts (2025 - 2030)- 発行日
- ページ情報
- 英文 455 Pages
- 納期
- 2~3営業日
- 商品コード
- 1686295
- カスタマイズ可能 お客様のご希望に応じて、既存データの加工や未掲載情報(例:国別セグメント)の追加などの対応が可能です。詳細はお問い合わせください。
- 適宜更新あり 本レポートは最新情報反映のため適宜更新し、内容構成変更を行う場合があります。ご検討の際はお問い合わせください。
- 翻訳ツール提供対象 PDF対応AI翻訳ツールの無料貸し出しサービスのご利用が可能です
概要
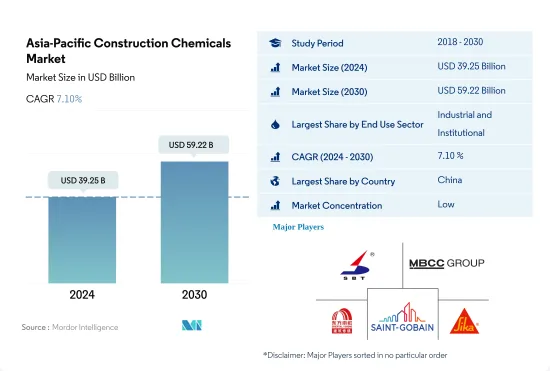
アジア太平洋地域の建設用化学品市場規模は、2024年には392億5,000万米ドルと推定され、2030年には592億2,000万米ドルに達すると予測され、予測期間中(2024-2030年)のCAGRは7.10%で成長すると予測されます。
アジア太平洋地域の建設用化学品市場は住宅分野で最も急成長
- 2022年、アジア太平洋地域の建設用化学品市場は、地域全体の建設活動の急増に牽引され、前年比2.58%増となりました。さらに、エンドユーザー部門が大きな成長を期待していることから、2023年の市場は2022年比で約6%拡大すると予測されました。
- 2022年に20.69%のシェアを占める商業セクターは、同市場の最大株主のひとつです。この優位性は、複雑な設計、多様な要件、多額の予算を特徴とする商業ビルの数が増加していることに起因しています。この地域の注目すべき例としては、上海タワー(中国)、ロッテワールドタワー(韓国)、セントラルワールド(タイ)などがあります。
- アジア太平洋地域には世界人口の半分以上が住んでおり、住宅部門は2番目に儲かる分野です。都市化、一人当たり所得の上昇、多層住宅建設の急増といった要因に加え、建設用化学薬品に対する意識の高まりが、この分野の価値を押し上げています。
- エンドユーザー部門の中では、住宅部門が最も高い成長を遂げ、予測期間(2023~2030年)のCAGRは7.89%と予測されます。この急成長は、急増する都市人口と可処分所得の増加による住宅需要の高まりに後押しされています。
強力な工業・インフラ部門を持つ中国がアジア太平洋地域の建設用化学品市場で優位を占めることが、市場を押し上げると予想されます。
- 2022年のアジア太平洋地域の建設用化学品需要全体は、2021年比で3%近く増加しました。最も大幅な増加が見られたのはインフラ部門で、2021年比で6%の需要増となりました。2023年には、中国とインドネシアが最も顕著な急増を見せ、2022年比でそれぞれ6.2%と6.8%の増加が見込まれると予測されました。
- 中国は支配的なプレーヤーとして、2022年のアジア太平洋地域の建設用化学品品市場の半分以上を占めました。これは、中国がこの地域最大の経済大国であることに後押しされ、建設分野への投資が堅調であるためと考えられます。2022年の中国のインフラ支出は、同地域全体の63%を占める。中国では、産業・機関セクターが最大の消費者で、2022年の総需要の約36%を占めました。
- 日本は中国に僅差で続き、アジア太平洋地域で第2位の建設用化学品消費国です。この背景には、日本の人口の90%が都市部に集中しており、住宅、オフィス、レストラン、工場などの継続的なインフラ開発が必要とされていることがあります。さらに、地震と津波のリスクが高まっていることに対応した日本の厳格な建築基準法が、需要をさらに押し上げています。
- 予測期間(2023~2030年)には、中国がCAGR 7.5%を記録し、建設用化学品の需要が最も急成長する見通しです。この急増は、中国政府が2023年に主要な建設・インフラプロジェクトへの支出を1兆8,000億米ドル増加させる計画を立てていることに起因しています。
アジア太平洋地域の建設用化学品市場の動向
インドなどで小売店やオフィススペースが増加し、アジア太平洋地域の商業建設セクターを後押し
- 2022年、アジア太平洋地域の商業施設の新設床面積は前年比3.23%減少しました。この後退は、規制の圧力、インフレ率の上昇、住宅ローン金利の急上昇といった要因によるものです。2023年には、この地域は回復し、商業施設の新設床面積は約1億4,600万平方フィート増加しました。この急増は主に外国直接投資(FDI)の増加によるもので、新しいオフィス、倉庫、小売店、その他の施設の需要に拍車をかけた。特に、ベトナムの建設部門は2023年に7,144万米ドルのFDI資本を誘致しました。
- 2020年、アジア太平洋地域は商業施設の新設床面積で大幅な後退を経験し、2019年比で21.92%の数量減となりました。この減少の主な原因は、政府による封鎖が広まり、プロジェクト作業が中断され、サプライチェーン、設備、労働力に深刻な影響を与えたことです。しかし、規制が緩和されるにつれ、同地域は目覚ましい回復を見せ、2021年の商業施設の新設床面積は20.98%急増し、約5億2,600万平方フィートの床面積に達しました。
- アジア太平洋地域の商業用新設床面積は大幅な成長が見込まれ、2023年と比較して2030年には14億1,000万平方フィート増加すると推定されます。この急増は、ショッピングモール、オフィススペース、小売店などに対する需要の高まりに後押しされています。アジア太平洋地域は世界の小売大国として台頭しており、世界の小売成長の4分の3近くに寄与しています。例えば、インドのグレードAオフィス市場は、上位7都市で2026年までに10億平方フィート、さらに2030年までに12億平方フィートまで拡大する可能性があります。全体として、アジア太平洋地域の商業施設の新設床面積は、予測期間中にCAGR5.16%を記録すると予測されています。
インドでは2030年までに2,500万戸に達する可能性があるなど、手頃な価格の住宅が増加し、同地域の住宅建設が拡大します。
- 2022年、アジア太平洋地域の住宅着工床面積は前年比約5.39%減少しました。この落ち込みは、COVID-19の大流行時に建築活動が急増した後、セクターが正常化した結果です。この地域の住宅セクターは、人口の増加、富裕層の増加、急速な都市化によって牽引されています。同地域の住宅新築床面積は、2023年には2022年比で4億1,000万平方フィート増加すると予想されました。
- 2020年、アジア太平洋地域の住宅新設床面積は2019年比で約5.06%減少しました。これは主に、政府による封鎖、サプライチェーンの混乱、労働力不足、建設生産性の低下、外国投資の低迷によるものでした。しかし、規制が緩和されるにつれて、この地域では大幅な回復が見られ、2021年には住宅新設戸数の増加により住宅新設床面積が約14億平方フィート急増しました。例えば、2021年だけでも、インドの住宅不動産市場は上位7都市で約16万3,000戸の新築住宅を導入します。
- アジア太平洋地域の住宅新築床面積は、予測期間中にCAGR 3.98%を記録すると予測されます。この成長は、住宅需要、投資の増加、有利な政府政策によるものです。より手頃な価格の住宅建設に注力することで、同地域の住宅建設セクターは活気を取り戻し、回復の一助となることが期待されます。2030年までには、インド人口の40%以上が都市部に居住するようになると推定され、さらに2,500万戸の手頃な価格の住宅需要が見込まれます。この需要の急増により、インドの住宅用不動産市場は2030年までに150万戸に達すると予想されています。
アジア太平洋地域の建設用化学品産業の概要
アジア太平洋地域の建設用化学品品市場は断片化されており、上位5社で13.78%を占めています。この市場の主要企業は以下の通りです。Jiangsu Subote New Material, MBCC Group, Oriental Yuhong, Saint-Gobain and Sika AG(sorted alphabetically).
その他の特典
- エクセル形式の市場予測(ME)シート
- 3ヶ月間のアナリストサポート
目次
第1章 エグゼクティブサマリーと主な調査結果
第2章 レポートのオファー
第3章 イントロダクション
- 調査の前提条件と市場定義
- 調査範囲
- 調査手法
第4章 主要産業動向
- 最終用途分野の動向
- 商業
- 産業・施設
- インフラ
- 住宅
- 主要インフラプロジェクト(現在および発表済み)
- 規制の枠組み
- バリューチェーンと流通チャネル分析
第5章 市場セグメンテーション
- 最終用途分野
- 商業
- 産業・施設
- インフラ
- 住宅
- 製品
- 接着剤
- サブ製品別
- ホットメルト
- 反応性
- 溶剤系
- 水性
- アンカーとグラウト
- サブ製品別
- セメント系固定材
- 樹脂固定
- その他のタイプ
- コンクリート混和剤
- サブ製品別
- 促進剤
- 空気混入混和剤
- 高範囲減水剤(超可塑剤)
- 遅延剤
- 収縮低減混和剤
- 粘度調整剤
- 減水剤(可塑剤)
- その他のタイプ
- コンクリート保護塗料
- サブ製品別
- アクリル系
- アルキド
- エポキシ
- ポリウレタン
- その他の樹脂
- 床用樹脂
- サブ製品別
- アクリル
- エポキシ
- ポリアスパラギン
- ポリウレタン
- その他の樹脂タイプ
- 補修・再生ケミカル
- サブ製品別
- ファイバーラッピングシステム
- 注入グラウト材
- マイクロコンクリートモルタル
- 改質モルタル
- 鉄筋保護材
- シーリング材
- サブ製品別
- アクリル
- エポキシ
- ポリウレタン
- シリコーン
- その他の樹脂
- 表面処理薬品
- サブ製品別
- 硬化コンパウンド
- 離型剤
- その他の製品タイプ
- 防水ソリューション
- サブ製品別
- 化学製品
- メンブレン
- 接着剤
- 国名
- オーストラリア
- 中国
- インド
- インドネシア
- 日本
- マレーシア
- 韓国
- タイ
- ベトナム
- その他アジア太平洋地域
第6章 競合情勢
- 主要な戦略動向
- 市場シェア分析
- 企業情勢
- 企業プロファイル
- Arkema
- Cementaid International Group of Companies
- Fosroc, Inc.
- Jiangsu Subote New Material Co., Ltd.
- Kao Corporation
- Keshun Waterproof Technology Co., ltd.
- Lonseal Corporation
- MAPEI S.p.A.
- MBCC Group
- MUHU(China)Construction Materials Co., Ltd.
- Normet
- Oriental Yuhong
- RPM International Inc.
- Saint-Gobain
- Sika AG
第7章 CEOへの主な戦略的質問
第8章 付録
- 世界概要
- 概要
- ファイブフォース分析フレームワーク(産業魅力度分析)
- 世界のバリューチェーン分析
- 市場力学(DROs)
- 情報源と参考文献
- 図表一覧
- 主要洞察
- データパック
- 用語集
目次
The Asia-Pacific Construction Chemicals Market size is estimated at 39.25 billion USD in 2024, and is expected to reach 59.22 billion USD by 2030, growing at a CAGR of 7.10% during the forecast period (2024-2030).
Asia-Pacific construction chemicals market to grow the fastest in the residential sector
- In 2022, the Asia-Pacific construction chemicals market witnessed a 2.58% increase in value compared to the previous year, driven by a surge in construction activities across the region. Moreover, the market was projected to expand by approximately 6% in 2023 over 2022 as end-user sectors are looking forward to significant growth.
- Accounting for a substantial 20.69% share in 2022, the commercial sector stands as one of the largest shareholders in the market. This dominance can be attributed to the rising number of commercial buildings characterized by intricate designs, diverse requirements, and substantial budgets, all of which result in a relatively wide variety of construction chemicals usage. Notable examples in the region include Shanghai Tower (China), Lotte World Tower (South Korea), and CentralWorld (Thailand).
- With the Asia-Pacific region housing over half of the global population, the residential sector is the second most lucrative segment. Factors such as urbanization, rising per capita income, and a surge in multi-story residential constructions, coupled with growing awareness about construction chemicals, have propelled the sector's value.
- Among the end-user sectors, the residential segment is poised for the highest growth, with a projected CAGR of 7.89% during the forecast period (2023-2030). This surge is fueled by the escalating demand for housing, driven by a burgeoning urban population and increased disposable incomes.
China's dominance in the Asia-Pacific construction chemicals market owing to strong industrial and infrastructure sectors is expected to boost the market
- The overall demand for construction chemicals in the Asia-Pacific increased by nearly 3% in 2022 over 2021. The most significant increase was observed in the infrastructure sector, with a 6% higher demand than in 2021. In 2023, China and Indonesia were projected to see the most significant spikes, with estimated increases of 6.2% and 6.8%, respectively, over 2022.
- China, as the dominant player, accounted for over half of the Asia-Pacific construction chemicals market in 2022. This could be attributed to China's robust investments in its construction sectors, bolstered by its status as the region's largest economy. China's infrastructure spending in 2022 constituted 63% of the region's total. In China, the industrial and institutional sector was the largest consumer, accounting for nearly 36% of the total demand in 2022.
- Japan, following closely behind China, stands as the second-largest consumer of construction chemicals in the Asia-Pacific. This is due to Japan's urban-centric population, with 90% residing in cities, necessitating continuous infrastructure development for housing, offices, restaurants, and factories. Additionally, Japan's stringent building codes, a response to its heightened earthquake and tsunami risks, further contribute to the demand.
- During the forecast period (2023-2030), China is poised to witness the fastest growth in demand for construction chemicals, recording a CAGR of 7.5%. This surge can be attributed to the Chinese government's plan to ramp up spending on major construction and infrastructure projects by USD 1.8 trillion in 2023, which was a significant increase from the previous year.
Asia-Pacific Construction Chemicals Market Trends
Rising retail and office spaces in countries such as India to boost the Asia-Pacific commercial construction sector
- In 2022, Asia-Pacific witnessed a 3.23% decline in its commercial new floor area compared to the previous year. This setback was attributed to factors such as regulatory pressures, higher inflation, and a surge in mortgage rates. In 2023, the region rebounded, with commercial construction new floor area increasing by approximately 146 million sq. ft. This surge was primarily driven by a rise in foreign direct investment (FDI), which spurred the demand for new offices, warehouses, retail outlets, and other facilities. Notably, the Vietnamese construction sector attracted an FDI capital of USD 71.44 million in 2023.
- In 2020, the Asia-Pacific region experienced a significant setback in commercial new floor area, with a volume decline of 21.92% compared to 2019. This decline was primarily due to widespread government lockdowns, which disrupted project work and severely impacted supply chains, equipment, and labor. However, as restrictions eased, the region witnessed a remarkable rebound, with its commercial new floor area surging by 20.98% in 2021, reaching a volume of approximately 526 million sq. ft.
- Asia-Pacific's commercial new floor area is projected to witness substantial growth, with an estimated increase of 1.41 billion sq. ft by 2030 compared to 2023. This surge is fueled by a rising demand for shopping malls, office spaces, retail outlets, and more. The Asia-Pacific region is emerging as a global retail powerhouse, contributing to nearly three-quarters of the worldwide retail growth. For instance, the Indian Grade A office market in its top seven cities may to expand to 1 billion sq. ft by 2026 and further to 1.2 billion sq. ft. by 2030. Overall, the commercial new floor area in Asia-Pacific is projected to witness a volume CAGR of 5.16% during the forecast period.
Rising affordable housing units, such as India's likely to reach 25 million by 2030, to augment the residential constructions in the region
- In 2022, the residential new floor area in the Asia-Pacific region saw a volume decline of approximately 5.39% from the previous year. This dip was a result of the sector normalizing after a surge in building activity during the COVID-19 pandemic. The region's residential sector is driven by a growing population, increasing wealth, and rapid urbanization. The residential new floor area in the region was expected to rise by 410 million sq. ft in 2023 compared to 2022.
- In 2020, the residential new floor area in Asia-Pacific declined in volume by around 5.06% compared to 2019. This was primarily due to government-imposed lockdowns, disruptions in the supply chain, labor shortages, reduced construction productivity, and low foreign investments. However, as restrictions eased, the region saw a significant rebound, with the residential new floor area surging by about 1.4 billion sq. ft in 2021, driven by the addition of new residential housing units. For instance, in 2021 alone, the Indian residential real estate market introduced approximately 163 thousand new residential units across its top seven cities.
- The residential new floor area in the Asia-Pacific region is projected to witness a CAGR of 3.98% during the forecast period. This growth can be attributed to the demand for housing, increased investments, and favorable government policies. The focus on constructing more affordable housing units is expected to rejuvenate the residential construction sector in the region, aiding its recovery. By 2030, it is estimated that over 40% of India's population will reside in urban areas, leading to a demand for an additional 25 million affordable housing units. This surge in demand is expected to push the Indian residential real estate market to reach 1.5 million units by 2030.
Asia-Pacific Construction Chemicals Industry Overview
The Asia-Pacific Construction Chemicals Market is fragmented, with the top five companies occupying 13.78%. The major players in this market are Jiangsu Subote New Material Co., Ltd., MBCC Group, Oriental Yuhong, Saint-Gobain and Sika AG (sorted alphabetically).
Additional Benefits:
- The market estimate (ME) sheet in Excel format
- 3 months of analyst support
TABLE OF CONTENTS
1 EXECUTIVE SUMMARY & KEY FINDINGS
2 REPORT OFFERS
3 INTRODUCTION
- 3.1 Study Assumptions & Market Definition
- 3.2 Scope of the Study
- 3.3 Research Methodology
4 KEY INDUSTRY TRENDS
- 4.1 End Use Sector Trends
- 4.1.1 Commercial
- 4.1.2 Industrial and Institutional
- 4.1.3 Infrastructure
- 4.1.4 Residential
- 4.2 Major Infrastructure Projects (current And Announced)
- 4.3 Regulatory Framework
- 4.4 Value Chain & Distribution Channel Analysis
5 MARKET SEGMENTATION (includes market size, forecasts up to 2030 and analysis of growth prospects.)
- 5.1 End Use Sector
- 5.1.1 Commercial
- 5.1.2 Industrial and Institutional
- 5.1.3 Infrastructure
- 5.1.4 Residential
- 5.2 Product
- 5.2.1 Adhesives
- 5.2.1.1 By Sub Product
- 5.2.1.1.1 Hot Melt
- 5.2.1.1.2 Reactive
- 5.2.1.1.3 Solvent-borne
- 5.2.1.1.4 Water-borne
- 5.2.2 Anchors and Grouts
- 5.2.2.1 By Sub Product
- 5.2.2.1.1 Cementitious Fixing
- 5.2.2.1.2 Resin Fixing
- 5.2.2.1.3 Other Types
- 5.2.3 Concrete Admixtures
- 5.2.3.1 By Sub Product
- 5.2.3.1.1 Accelerator
- 5.2.3.1.2 Air Entraining Admixture
- 5.2.3.1.3 High Range Water Reducer (Super Plasticizer)
- 5.2.3.1.4 Retarder
- 5.2.3.1.5 Shrinkage Reducing Admixture
- 5.2.3.1.6 Viscosity Modifier
- 5.2.3.1.7 Water Reducer (Plasticizer)
- 5.2.3.1.8 Other Types
- 5.2.4 Concrete Protective Coatings
- 5.2.4.1 By Sub Product
- 5.2.4.1.1 Acrylic
- 5.2.4.1.2 Alkyd
- 5.2.4.1.3 Epoxy
- 5.2.4.1.4 Polyurethane
- 5.2.4.1.5 Other Resin Types
- 5.2.5 Flooring Resins
- 5.2.5.1 By Sub Product
- 5.2.5.1.1 Acrylic
- 5.2.5.1.2 Epoxy
- 5.2.5.1.3 Polyaspartic
- 5.2.5.1.4 Polyurethane
- 5.2.5.1.5 Other Resin Types
- 5.2.6 Repair and Rehabilitation Chemicals
- 5.2.6.1 By Sub Product
- 5.2.6.1.1 Fiber Wrapping Systems
- 5.2.6.1.2 Injection Grouting Materials
- 5.2.6.1.3 Micro-concrete Mortars
- 5.2.6.1.4 Modified Mortars
- 5.2.6.1.5 Rebar Protectors
- 5.2.7 Sealants
- 5.2.7.1 By Sub Product
- 5.2.7.1.1 Acrylic
- 5.2.7.1.2 Epoxy
- 5.2.7.1.3 Polyurethane
- 5.2.7.1.4 Silicone
- 5.2.7.1.5 Other Resin Types
- 5.2.8 Surface Treatment Chemicals
- 5.2.8.1 By Sub Product
- 5.2.8.1.1 Curing Compounds
- 5.2.8.1.2 Mold Release Agents
- 5.2.8.1.3 Other Product Types
- 5.2.9 Waterproofing Solutions
- 5.2.9.1 By Sub Product
- 5.2.9.1.1 Chemicals
- 5.2.9.1.2 Membranes
- 5.2.1 Adhesives
- 5.3 Country
- 5.3.1 Australia
- 5.3.2 China
- 5.3.3 India
- 5.3.4 Indonesia
- 5.3.5 Japan
- 5.3.6 Malaysia
- 5.3.7 South Korea
- 5.3.8 Thailand
- 5.3.9 Vietnam
- 5.3.10 Rest of Asia-Pacific
6 COMPETITIVE LANDSCAPE
- 6.1 Key Strategic Moves
- 6.2 Market Share Analysis
- 6.3 Company Landscape
- 6.4 Company Profiles
- 6.4.1 Arkema
- 6.4.2 Cementaid International Group of Companies
- 6.4.3 Fosroc, Inc.
- 6.4.4 Jiangsu Subote New Material Co., Ltd.
- 6.4.5 Kao Corporation
- 6.4.6 Keshun Waterproof Technology Co., ltd.
- 6.4.7 Lonseal Corporation
- 6.4.8 MAPEI S.p.A.
- 6.4.9 MBCC Group
- 6.4.10 MUHU (China) Construction Materials Co., Ltd.
- 6.4.11 Normet
- 6.4.12 Oriental Yuhong
- 6.4.13 RPM International Inc.
- 6.4.14 Saint-Gobain
- 6.4.15 Sika AG
7 KEY STRATEGIC QUESTIONS FOR CONCRETE, MORTARS AND CONSTRUCTION CHEMICALS CEOS
8 APPENDIX
- 8.1 Global Overview
- 8.1.1 Overview
- 8.1.2 Porter's Five Forces Framework (Industry Attractiveness Analysis)
- 8.1.3 Global Value Chain Analysis
- 8.1.4 Market Dynamics (DROs)
- 8.2 Sources & References
- 8.3 List of Tables & Figures
- 8.4 Primary Insights
- 8.5 Data Pack
- 8.6 Glossary of Terms
- 発行日
- 発行
- Mordor Intelligence
- ページ情報
- 英文 455 Pages
- 納期
- 2~3営業日


