
|
市場調査レポート
商品コード
1644516
インドのフレキシブルオフィススペース:市場シェア分析、産業動向と統計、成長予測(2025年~2030年)India Flexible Office Space - Market Share Analysis, Industry Trends & Statistics, Growth Forecasts (2025 - 2030) |
||||||
カスタマイズ可能
適宜更新あり
|
|||||||
| インドのフレキシブルオフィススペース:市場シェア分析、産業動向と統計、成長予測(2025年~2030年) |
|
出版日: 2025年01月05日
発行: Mordor Intelligence
ページ情報: 英文 150 Pages
納期: 2~3営業日
|

全表示
- 概要
- 目次
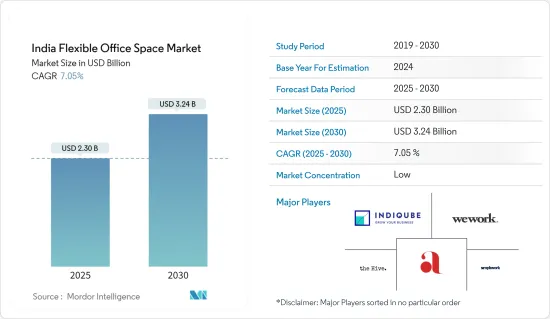
インドのフレキシブルオフィススペース市場規模は2025年に23億米ドルと推定され、予測期間(2025~2030年)のCAGRは7.05%で、2030年には32億4,000万米ドルに達すると予測されます。
主要ハイライト
- ハイブリッドワークモデルの台頭、フレキシブルリースへの需要、進化するワークカルチャーに後押しされ、インドではフレキシブルオフィススペースへのシフトが顕著になっています。この動向は、新興企業、中小企業、大企業など多様な顧客を引き付けています。オフィスリース全体に占めるシェアは、2019年の10.2%から2024年上半期には12.7%に上昇しています。2024年9月のBusiness Standardのレポートによると、フレキシブルオフィスの席数は2021年の8万5,234席から2023年には15万5,000席に急増し、2024年上半期だけで10万6,554席がリースされました。
- フレックススペース産業の進化に関する産業団体の報告によると、2024年上半期現在、インドの上位8都市におけるフレキシブルワークスペースは5,800万平方フィート(MSF)に及び、国内のグレードAオフィス総供給量の7~8%に相当します。2024年上半期だけで、フレックスオフィスの供給は5MSF以上増加し、毎年8~9MSFずつ増加し、2022年には23%、2023年には18%の成長率を記録した過去2年間の勢いをさらに強めています。
- 過去3年半の間、フレキシブルワークスペース部門は年間35~37%という驚異的な成長率を享受してきました。注目すべきは、2024年はすでに軌道に乗っており、2023年のリース件数の70%近くを達成していることです。産業団体の報告書「フレックスからマネージドへ-フレックススペース産業の進化、2024年9月」でも、上位8都市のフレックススペース在庫の分布が詳細に示されています。バンガロールが全体の31%を占め、デリーNCR(16%)、プネ(14%)、ハイデラバード(14%)、ムンバイ(11%)と続きます。さらに、労働力の分散化やワークライフバランスの重視に拍車がかかり、Tier IIとIII都市ではフレキシブルなワークスペースへの需要が急増しています。全国的に見ると、フレキシブルスペースはオフィススペース需要全体の11~13%を占めています。
- マネージドオフィスソリューション(MOS)モデルを活用する企業は、オーダーメイドの一連のサービスを享受し、完全にカスタマイズ型オフィスとワークスペースのあらゆる面をコントロールすることができます。300以上の事業者が存在するこの市場では、上位5%の事業者がグレードAのフレックスストックの50%以上を保有し、そのほとんどがマネージドオフィスソリューション(MOS)を中心にサービスを提供しています。
- 情報技術(特にビジネスプロセス管理)がリードし、2024年のフレキシブルワークスペース吸収額の50%を占めます。次いでエンジニアリング・製造業が18%、銀行・金融サービス保険業(BFSI)が12%となっています。パンデミック後のコスト上昇とリモートワークの実現可能性が、これらのセクターをフレキシブルオフィスソリューションへと向かわせた。
インドのフレキシブルオフィス市場動向
市場はIT・通信セクターの需要で繁栄
インドのフレキシブルオフィス・スペース市場は、主にIT・通信セクターが牽引して大きな成長を遂げています。これらの適応性の高いワークスペースに対する需要の急増は、ハイブリッドワークモデルに移行する企業にとって重要であることを裏付けています。Business Standardによると、2024年上半期のフレキシブルオフィススペースの吸収量は、ITセクターが全体の50%を占め、市場に圧倒的な影響力を持つことが明らかになりました。特に不動産戦略の最適化に熱心なIT企業にとって、フレキシブルオフィスソリューションの魅力はますます高まっています。
ITセグメントにとどまらず、コミュニケーションセグメントの主要企業であるビジネスプロセスマネジメント(BPM)セグメントもこの動向に拍車をかけています。仕事の性質が進化するにつれて、企業は俊敏性の必要性をますます認識するようになり、フレキシブルなオフィススペースへの需要が著しく高まっています。インダストリー・アソシエーションのレポートによると、四半期ごとのリース契約では、IT-BPMセグメントが約32%のシェアを占め、フレキシブルワークスペースが15%、BFSIセグメントが14%となっています。この変化は、柔軟な勤務形態が広く受け入れられていることを意味し、ITとBPMがその最前線にあり、変化するワークフォース力学に迅速に適応しています。
ITとコミュニケーション部門は、フレキシブルなワークスペースを選択する新興企業や中小企業の増加からも恩恵を受けています。2022年と2023年の過去2年間、このセクターでは、多国籍企業、中小企業、ユニコーン企業、新興企業、GCCのサテライトオフィスからの需要が主要原動力となり、合計約1,000万平方フィートの新規リース需要が一貫して続いています。この勢いは2024年、2025年にも続き、India Breifingの報告によれば、年間1,000万~1,200万平方フィートの成長が予測されています。コワーキング環境を採用することで、IT企業や通信企業は、従来のリースのような負担の大きい長期契約なしに、最先端のインフラを利用できるようになります。このシフトはこれらのセクターの利益に資するだけでなく、多様な企業間のコラボレーションやネットワーキングを促進します。
結論として、IT・通信セクターはインドのフレキシブルオフィス市場の成長軌道を形成する上で極めて重要です。適応性の高いワークスペースへの依存度が高まっていることは、柔軟性とイノベーションに向けた幅広い産業のシフトを反映しており、これらのセクターが今後もワークプレイス変革の最前線に位置することを確実にしています。
ベンガルールのオフィス賃貸急増が市場のペースを決める
インドのハイテク産業の中心地と呼ばれるベンガルールは、2024年のオフィス賃貸活動の先頭に立ち、産業団体のデータによると、1月から9月までに1,640万平方フィートという驚異的な面積を吸収しました。この需要急増の主要要因は、ベンガルールの強固なハイテク環境で栄える技術企業と世界のケイパビリティセンター(GCC)です。ハイテクセクターはリース全体の23%を占めており、企業は最先端のインフラと設備を誇るスペースを求めています。
Construction Weekのレポートによると、ベンガルールでは2024年第3四半期だけで620万平方フィートの吸収があり、前年同期比48%増という顕著な伸びを示しました。10万平方フィート以上の大型取引が大半を占め、リース取引の67%を占めました。予想では、年末までに約2,000万平方フィートという記録的な総吸収量を達成する見込みです。IT-BPMセクターのリースシェアが46%とトップランナーである一方、BFSIセクターも2024年第3四半期に同市のリース活動に23%貢献しました。
ベンガルール、ムンバイ、デリーNCR、ハイデラバードなどの主要都市では、IT-BPM、BFSIからエンジニアリング、製造、フレキシブルオペレーターに至るまで、多様なセクターで新規スペース取得が活発化しました。2024年第3四半期は、主にベンガルールとハイデラバードでの竣工に後押しされ、全国的に供給が増加したもの、需要は供給を上回りました。この格差は、特にプレミアムグレードAのスペースに対する引き合いが強まる中、主要都市での竣工を加速させることが急務であることを浮き彫りにしています。
産業団体の主要ハイライトによると、2024年第3四半期には1,000万平方フィートの新規竣工があり、ベンガルールとハイデラバードがそれぞれ50%と24%のシェアを占めています。先頭を走るベンガルールは、2,020万平方フィートのフレックススペースの空室を誇っています。特筆すべきは、ムンバイ、ベンガルール、デリーNCRのようなTier I都市の平均デスクコストは、他の地域よりもプライムなマイクロマーケットで50%高いということです。2024年9月までに、ベンガルールでは80%以上のテナントが今後数年のうちにフレキシブルスペースでポートフォリオを拡大する意向であることが報告されています。
結論として、オフィスリースにおけるベンガルールの優位性とその堅調なフレックススペース市場は、インドのフレキシブルオフィス市場を牽引する極めて重要な役割を強調しています。ベンガルールは多様なセクターに対応できる能力を持ち、質の高いインフラに注力していることから、入居者の進化する需要に応える重要な役割を担っています。
インドのフレキシブルオフィス産業概要
インドのフレキシブルオフィス市場の競合情勢は、国内外の主要企業で占められています。新規参入企業の参入障壁を低くする技術の進歩に後押しされ、市場競争は激化しています。競争優位性を確保するため、インドのフレキシブルオフィス・スペースセグメントの企業は、戦略的パートナーシップ、合併、買収を含む成長戦略を追求しています。主要参入企業としては、WeWork、Awfis、IndiQube、Simpliwork、The Hive、91 Springboard、Redbrics、Mumbai Co-workingなどが挙げられます。
その他の特典
- エクセル形式の市場予測(ME)シート
- 3ヶ月間のアナリストサポート
目次
第1章 イントロダクション
- 調査の成果
- 調査の前提
- 調査範囲
第2章 調査手法
第3章 エグゼクティブサマリー
第4章 市場洞察
- 現在の市場シナリオ
- 技術動向
- 政府の規制と取り組み
- オフィス賃料に関する洞察
- インドにおけるフレキシブルオフィスの立ち上げに関する洞察
- 一般経済と不動産融資の金利レジームに関する洞察
- 地政学とパンデミックが市場に与える影響
第5章 市場力学
- 市場促進要因
- 新興企業と中小企業の台頭
- 外国投資の増加
- 市場抑制要因
- 高い競合と飽和状態
- リースの柔軟性
- 市場機会
- 成長する第2級都市
- 持続可能性とグリーンへの取り組み
- ポーターのファイブフォース分析
- 供給企業の交渉力
- 買い手/消費者の交渉力
- 新規参入業者の脅威
- 代替品の脅威
- 競争企業間の敵対関係の強さ
第6章 市場セグメンテーション
- タイプ別
- プライベートオフィス
- コワーキングオフィス
- バーチャルオフィス
- エンドユーザー別
- IT・通信
- メディアエンターテイメント
- 小売・消費財
- その他
- 都市別
- デリー
- ムンバイ
- バンガロール
- ハイデラバード
- プネー
- インドの他の地域
第7章 競合情勢
- 市場集中概要
- 企業プロファイル
- WeWork
- Mumbai Coworking
- Simpliwork
- The Hive
- Innov8
- 91Springboard
- IndiQube
- Skootr
- Awfis
- Smartworks
- Goodworks
- Spring House Coworking*
第8章 市場の将来
第9章 付録
The India Flexible Office Space Market size is estimated at USD 2.30 billion in 2025, and is expected to reach USD 3.24 billion by 2030, at a CAGR of 7.05% during the forecast period (2025-2030).
Key Highlights
- Driven by the rise of hybrid work models, a demand for flexible leases, and evolving work cultures, India is witnessing a pronounced shift towards flexible office spaces. This trend has attracted a diverse clientele, spanning start-ups, SMEs, and major corporations. Their share of total office leasing has risen from 10.2% in 2019 to 12.7% in the first half of 2024. The uptake of flexible office seats surged from 85,234 in 2021 to 155,000 in 2023, with 106,554 seats leased in just the first half of 2024, as per the reports by Business Standard on September 2024.
- Reported by Industry Associations on Evolution on the Flex Space Industry, as of H1 2024, flexible workspaces across India's top eight cities spanned 58 Million Square Feet (MSF), representing 7-8% of the nation's total Grade A office supply. The first half of 2024 alone saw an addition of over 5 MSF to the flex supply, building on the previous two years' momentum, which saw increases of 8-9 MSF each year, with growth rates of 23% in 2022 and 18% in 2023.
- Over the past 3.5 years, the flexible workspace sector has enjoyed an impressive annual growth rate of 35-37%. Notably, 2024 is already on track, achieving nearly 70% of 2023's leasing figures. From Flex to Managed - Evolution of the Flex Space Industry, September 2024, a report from Industry Associations also details the distribution of flex space inventory in the top 8 cities: Bangalore dominates with 31% of the total stock, trailed by Delhi NCR (16%), Pune (14%), Hyderabad (14%), and Mumbai (11%). Moreover, there's a burgeoning demand for flexible workspaces in Tier II and III cities, spurred by workforce decentralization and a heightened focus on work-life balance. Nationwide, flexible spaces now represent 11-13% of total office space demand.
- Enterprises leveraging the Managed Office Solutions (MOS) model enjoy a suite of tailored services, allowing for a fully custom-built office and control over every aspect of their workspace. Among the 300+ operators in the market, the top 5% dominate, holding over 50% of the Grade A flex stock, with most centering their offerings around Managed Office Solutions (MOS).
- Information Technology (specifically business process management) leads the charge, making up 50% of 2024 absorption in flexible workspaces. They are followed by engineering and manufacturing at 18%, and banking, financial services, and insurance (BFSI) at 12%. Post-pandemic, rising costs and the feasibility of remote work have nudged these sectors towards flexible office solutions.
India Flexible Office Space Market Trends
Market Thrives on IT and Communication Sector Demand
India's flexible office space market is witnessing significant growth, primarily driven by the IT and Communication sectors. The surge in demand for these adaptable workspaces underscores their importance for companies transitioning to hybrid work models. Business Standard reports that in the first half of 2024, the IT sector was responsible for a substantial 50% of the total absorption of flexible office spaces, underscoring its dominant influence on the market. As businesses adapt to the post-pandemic landscape, the allure of flexible office solutions has intensified, especially for IT firms keen on optimizing their real estate strategies.
Beyond the IT realm, the Business Process Management (BPM) segment, a key player in the communication sector, is also fueling this trend. As the nature of work evolves, companies increasingly recognize the need for agility, leading to a marked uptick in demand for flexible office spaces. Reports from Industry Association, indicate that in quarterly leasing, IT-BPM segments commanded the lion's share at ~32%, trailed by flexible workspaces at 15% and the BFSI sector at 14%. This evolution signifies a wider acceptance of flexible work arrangements, with IT and BPM at the forefront, adapting swiftly to the changing workforce dynamics.
The IT and Communication sectors are also benefiting from the rise of startups and small-to-medium enterprises (SMEs) that are increasingly opting for flexible workspaces. Over the past two years, 2022 and 2023, the sector has consistently witnessed new leasing activities totaling around 10 million square feet, driven largely by demand from satellite offices of MNCs, MSMEs, unicorns, startups, and GCCs. This momentum is set to continue into 2024 and 2025, with projections of an annual growth of 10-12 million square feet as reported by India Breifing. By embracing coworking environments, IT and Communication companies gain access to state-of-the-art infrastructure without the burdensome long-term commitments of traditional leases. This shift not only serves the interests of these sectors but also fosters enhanced collaboration and networking among diverse enterprises.
In conclusion, the IT and Communication sectors are pivotal in shaping the growth trajectory of India's flexible office space market. Their increasing reliance on adaptable workspaces reflects a broader industry shift towards flexibility and innovation, ensuring these sectors remain at the forefront of workplace transformation in the years to come.
Bengaluru's Surge in Office Leasing Sets the Pace for Market
Bengaluru, often dubbed India's tech capital, spearheaded office leasing activities in 2024, absorbing a staggering 16.4 million square feet from January to September, as per Industry Association's data. This surge in demand predominantly stems from technology firms and Global Capability Centres (GCCs), both flourishing in Bengaluru's robust tech landscape. With the tech sector accounting for 23% of total leasing, companies are on the lookout for spaces boasting cutting-edge infrastructure and amenities, pivotal for high-stakes operations like R&D and data analytics.
As per reports from Construction Week, in Q3 2024 alone, Bengaluru witnessed an absorption of 6.2 million square feet, marking a notable 48% year-on-year uptick. Large transactions, each spanning 100,000 square feet or more, dominated the scene, making up 67% of the leasing activity. Projections suggest the city is on track to hit a record gross absorption of approximately 20 million square feet by year's end. While the IT-BPM sector remained the frontrunner with a 46% leasing share, the BFSI sector made its mark, contributing 23% to the city's leasing activities in Q3 2024.
Major cities, including Bengaluru, Mumbai, Delhi NCR, and Hyderabad, experienced heightened fresh space take-ups across diverse sectors, from IT-BPM and BFSI to engineering, manufacturing, and flexible operators. While Q3 2024 saw a nationwide uptick in supply, primarily fueled by completions in Bengaluru and Hyderabad, demand outpaced this supply. This disparity underscores the urgency for accelerated completions in major cities, especially as inquiries for premium Grade A spaces intensify.
Key highlights from Industry Associations, reveal that Q3 2024 witnessed 10 million square feet of new completions, with Bengaluru and Hyderabad claiming 50% and 24% shares, respectively. Leading the charge, Bengaluru boasts a flex space availability of 20.2 million square feet. Notably, the average desk cost in Tier I cities like Mumbai, Bengaluru, and Delhi NCR is 50% steeper in prime micro-markets than in other locales. By September 2024, reports indicate that over 80% of occupiers in Bengaluru are inclined to expand their portfolios with flexible spaces in the coming years.
In conclusion, Bengaluru's dominance in office leasing and its robust flex space market highlight its pivotal role in driving India's flexible office space market. The city's ability to cater to diverse sectors and its focus on quality infrastructure position it as a key player in meeting the evolving demands of occupiers.
India Flexible Office Space Industry Overview
Major international and domestic players populate the competitive landscape of India's flexible office space market. High competition characterizes this market, fueled by technological advancements that lower entry barriers for newcomers. To secure a competitive edge, companies in India's flexible office space arena pursue growth strategies, including strategic partnerships, mergers, and acquisitions. Some of the major players include WeWork, Awfis, IndiQube, Simpliwork, The Hive, 91 Springboard, Redbrics, Mumbai Co-working, etc., among others.
Additional Benefits:
- The market estimate (ME) sheet in Excel format
- 3 months of analyst support
TABLE OF CONTENTS
1 INTRODUCTION
- 1.1 Study Deliverables
- 1.2 Study Assumptions
- 1.3 Scope of the Study
2 RESEARCH METHODOLOGY
3 EXECUTIVE SUMMARY
4 MARKET INSIGHTS
- 4.1 Current Market Scenario
- 4.2 Technological Trends
- 4.3 Government Regulations and Initiatives
- 4.4 Insights on Office Rents
- 4.5 Insights on Flexible Office Space Startups in India
- 4.6 Insights into Interest Rate Regime for General Economy and Real Estate Lending
- 4.7 Impact of Geopolitics and Pandemic on the Market
5 MARKET DYNAMICS
- 5.1 Market Drivers
- 5.1.1 Rise of Startups and SMEs
- 5.1.2 Increase in Foreign Investment
- 5.2 Market Restraints
- 5.2.1 High Competition and Saturation
- 5.2.2 Lease Flexibility
- 5.3 Market Opportunities
- 5.3.1 Growing Tier - 2 Cities
- 5.3.2 Sustainability and Green Initiatives
- 5.4 Porter's Five Forces Analysis
- 5.4.1 Bargaining Power of Suppliers
- 5.4.2 Bargaining Power of Buyers/Consumers
- 5.4.3 Threat of New Entrants
- 5.4.4 Threat of Substitute Products
- 5.4.5 Intensity of Competitive Rivalry
6 MARKET SEGMENTATION
- 6.1 By Type
- 6.1.1 Private Officees
- 6.1.2 Coworking Offices
- 6.1.3 Virtual Offices
- 6.2 By End User
- 6.2.1 IT and Telecommunications
- 6.2.2 Media and Entertainment
- 6.2.3 Retail and Consumer Goods
- 6.2.4 Other End Users
- 6.3 By City
- 6.3.1 Delhi
- 6.3.2 Mumbai
- 6.3.3 Bangalore
- 6.3.4 Hyderabad
- 6.3.5 Pune
- 6.3.6 Rest of India
7 COMPETITIVE LANDSCAPE
- 7.1 Market Concentration Overview
- 7.2 Company Profiles
- 7.2.1 WeWork
- 7.2.2 Mumbai Coworking
- 7.2.3 Simpliwork
- 7.2.4 The Hive
- 7.2.5 Innov8
- 7.2.6 91Springboard
- 7.2.7 IndiQube
- 7.2.8 Skootr
- 7.2.9 Awfis
- 7.2.10 Smartworks
- 7.2.11 Goodworks
- 7.2.12 Spring House Coworking*
