
|
市場調査レポート
商品コード
1644495
世界のオフィススペース-市場シェア分析、産業動向と統計、成長予測(2025年~2030年)Global Office Space - Market Share Analysis, Industry Trends & Statistics, Growth Forecasts (2025 - 2030) |
||||||
カスタマイズ可能
適宜更新あり
|
|||||||
| 世界のオフィススペース-市場シェア分析、産業動向と統計、成長予測(2025年~2030年) |
|
出版日: 2025年01月05日
発行: Mordor Intelligence
ページ情報: 英文 120 Pages
納期: 2~3営業日
|

全表示
- 概要
- 目次
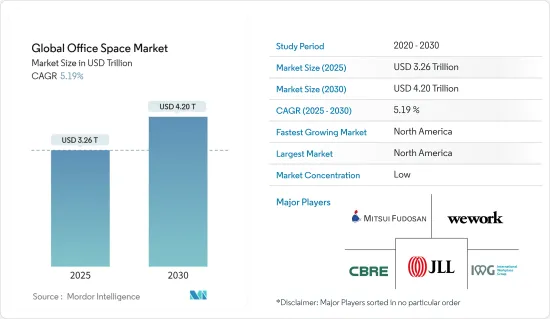
世界のオフィススペース市場規模は2025年に3兆2,600億米ドルと推定され、2030年には4兆2,000億米ドルに達すると予測され、予測期間(2025~2030年)のCAGRは5.19%です。
特に大企業は、長期契約による古典的なオフィススペースのリース・モデルをいまだに利用しています。コワーキングスペースやサービスオフィスといった柔軟なワークスペースソリューションの開発や、会議室の需要は、柔軟な勤務形態の増加によって促進されています。英国では、2023年7月に「雇用関係軟質ワーキング法案」が議会で採択され、王室許可を得ています。
柔軟な賃貸条件で共有ワークスペースを提供するコワーキングスペースは、フリーランサーや新興企業、さらには既存企業の間で人気を博しています。このようなスペースは、コラボレーション環境、ネットワーキングの機会、アメニティを提供することが多く、柔軟性を求める企業を惹きつけています。
技術はオフィススペースにおいてますます重要な役割を果たすようになってきています。IoTデバイス、居住センサ、統合コミュニケーションツールなどのスマートオフィスソリューションは、効率性、セキュリティ、ワークプレイスエクスペリエンスを向上させています。2023年1月、Global IT CorporationとKonica Minolta Inc.は、ソフトウェア開発能力を強化し、オフィススペース市場の成長を後押しするため、合弁会社「Konica Minolta Solution Labs Inc」の設立を発表しました。Konica Minoltaは、スマートオフィスソリューションや未開拓のソフトウェアソリューションの可能性など、市場の他の周辺セグメントも対象としています。
世界のオフィススペース市場動向
軟質なオフィススペースの人気が高まる
一部の都市を中心に軟質ワークスペース市場が成熟し、パンデミックへの備えの必要性が高まったことで、オフィススペースの需要が大幅に増加しました。新興企業の台頭や、不動産戦略として軟質ワークスペースを提供する既存企業の評価が高まったことが、この動向を下支えしました。技術企業が、経済的に厳しい環境下でもコストをうまくコントロールできるような柔軟なモデルで世界の能力センターを設立しようとしているため、軟質なオフィススペースへの需要が高まると考えられます。パンデミックと景気後退の影響により、柔軟性の向上とリース期間の短縮が入居者から求められると予想されます。資本コストや運営コストを配分する際にも、より慎重になると考えられます。この動向は今後も続くと予想され、企業のオフィスは、設備の整ったスペース、リース期間の短いスペース、または平均ロックイン期間が36ヶ月以下の民間運営スペースを探す可能性があります。産業レポートによると、2024年までに軟質ワークスペースのデスク数は254万から310万に増加すると予想されています。
しかし、稼働率と需要の増加に伴い、重要なマイクロマーケット事業者は価格の改善を模索しています。個室オフィスのフレックス契約の稼働率は80%以上、共有スペースでは65%以上と、パンデミック前の水準に戻った。2022年10月に欧州で平均9%の上昇が記録されたように、フレックス事業者は個室オフィスのデスクに対してより高い価格を請求しました。
インド各都市はアジア太平洋で最も高いプライムオフィス賃貸料の伸びを記録
インドでは、2023年上半期にムンバイ首都圏が最も高い賃料を記録し、首都圏(NCR)、ベンガルールがこれに続きました。ムンバイではスペースの空室が限られているため、前年同期比約16%の賃料上昇を記録し、次いでデリーNCRとプネがそれぞれ前年同期比3%と2%のわずかな上昇にとどまった。
ベンガルールとハイデラバードでは、リースの勢いを上回るスペースの継続的な流入により、空室レベルが上昇しました。インドの商業用不動産セクターは、世界経済の成長鈍化という逆風から完全に免れたわけではなく、一部の企業では人員削減が行われ、いくつかの都市ではテクニカルリセッションが発生しました。第1四半期の需要は前年同期比14%減と目に見えて減速し、第2四半期も前年同期比9%減となりました。
多くのハイテク企業が従業員のオフィス復帰を奨励する中、同市の賃貸活動は顕著に改善しました。2023年上半期のチェンナイにおけるリース契約件数の46%をITセクターが占め、同市のオフィス市場におけるITセクターの重要性が引き続き高いことが示されました。IT-BPMセクターに続き、軟質ワークスペースが積極的にリースされ、その寄与率は21%、リース面積は約90万平方フィートとなりました。エネルギー化学セクターの入居企業も積極的で、2022年上半期のごくわずかなシェアから、2023年上半期には19%のシェアを獲得しました。
世界のオフィススペース産業概要
世界のオフィススペース市場は競争が激しく、複数の参入企業で構成されています。同市場の著名な参入企業には、CBRE Group、Mitsui Fudosan、Jones Lang LaSalle Incorporated、IWG PLC、WeWorkなどがあります。これらの企業は、市場シェアと収益性を高めるために、戦略的な共同イニシアティブを活用しています。ベンダーは、さらなる事業拡大と成長のために、相次ぐ合併・買収戦略、研究開発、地域拡大、新製品導入戦略に依存しています。
その他の特典
- エクセル形式の市場予測(ME)シート
- 3ヶ月間のアナリストサポート
目次
第1章 イントロダクション
- 調査の成果
- 調査の前提
- 調査範囲
第2章 調査手法
- 分析手法
- 調査フェーズ
第3章 エグゼクティブサマリー
第4章 市場洞察
- 市場概要
- 政府の規制と取り組み
- 産業の技術動向
- オフィス賃料に関する洞察
- オフィススペース計画に関する洞察
- COVID-19が市場に与える影響
- バリューチェーン/サプライチェーン分析
第5章 市場力学
- 市場促進要因
- 柔軟なワークアレンジメントとコワーキングスペース
- 市場抑制要因
- リモートワークの動向
- 市場機会
- 技術統合とスマートオフィス
- 産業の魅力-ポーターのファイブフォース分析
- 新規参入業者の脅威
- 買い手/消費者の交渉力
- 供給企業の交渉力
- 代替品の脅威
- 競争企業間の敵対関係の強さ
第6章 市場セグメンテーション
- 建物タイプ別
- 改修
- 新築
- エンドユーザー別
- IT・通信
- メディアエンターテインメント
- 小売・消費財
- その他
- 地域別
- 北米
- 米国
- カナダ
- 欧州
- ドイツ
- 英国
- フランス
- その他の欧州
- アジア太平洋
- インド
- 中国
- 日本
- その他のアジア太平洋
- 中東・アフリカ
- 南アフリカ
- アラブ首長国連邦
- サウジアラビア
- エジプト
- その他の中東・アフリカ
- ラテンアメリカ
- メキシコ
- ブラジル
- アルゼンチン
- その他のラテンアメリカ
- 北米
第7章 競合情勢
- 市場集中度概要
- 企業プロファイル
- CBRE Group Inc.
- Mitsui Fudosan Co. Ltd
- Jones Lang LaSalle Incorporated
- IWG PLC
- WeWork
- Knotel Inc.
- Servcorp
- The Office Group
- WOJO
- Mindspace*
- その他の企業
第8章 市場機会と今後の動向
第9章 付録
The Global Office Space Market size is estimated at USD 3.26 trillion in 2025, and is expected to reach USD 4.20 trillion by 2030, at a CAGR of 5.19% during the forecast period (2025-2030).
In particular, larger companies still use a classic leasing model for office space on long-term agreements. Nevertheless, the development of flexible workspace solutions, such as coworking spaces and service offices, and the demand for meeting rooms are fueled by the increasing flexibility in working arrangements. The Employment Relations Flexible Working Bill was adopted by Parliament in July 2023 and received royal assent in the United Kingdom.
Coworking spaces, offering shared workspaces with flexible lease terms, have gained popularity among freelancers, start-ups, and even established enterprises. These spaces often provide a collaborative environment, networking opportunities, and amenities, attracting businesses seeking flexibility.
Technology is playing an increasingly significant role in office spaces. Smart office solutions, including IoT devices, occupancy sensors, and integrated communication tools, enhance efficiency, security, and workplace experience. In January 2023, Global IT Corporation and Konica Minolta Inc. announced the establishment of a joint venture, Konica Minolta Solution Labs Inc., to fortify software development capabilities and boost the growth of the office space market. Konica Minolta also targets other peripheral areas of the market, such as smart office solutions and the potential for untapped software solutions.
Global Office Space Market Trends
The Popularity Of Flexible Office Spaces is Increasing
The demand for office spaces increased significantly due to the maturity of the flexible workspace market, particularly in some cities, and the need for pandemic preparedness. The emergence of several start-ups and greater appreciation for existing market players offering flexible workspaces as real estate strategies underpinned this trend. As technology companies seek to set up global capability centers with a flexible model that allows them to control costs successfully in an economically challenging environment, demand for flexible office space will increase. Increased flexibility and shorter lease periods are expected to be requested by occupiers due to the effects of the pandemic and recession. They will be more careful when allocating capital and operational costs. This trend is expected to continue, and enterprise corporate offices may look for fitted-out spaces, shorter leases, or privately operated spaces with an average lock-in period of 36 months or less. According to industry reports, by 2024, the number of flexible workspace desks is expected to increase from 2.54 million to 3.1 million.
However, with increased occupancy levels and demand, vital micro-market operators are looking to improve their prices. The occupancy rate of flex contracts in private offices returned to a pre-pandemic level of more than 80% and more than 65% for shared space. Flex operators charged higher prices for private office desks, as recorded by an average 9% increase in October 2022 in Europe.
Indian Cities Recorded Highest Prime Office Rental Growth in Asia-Pacific
In India, the Mumbai Metropolitan Region recorded the highest office rental, followed by the National Capital Region (NCR) and Bengaluru, in the first half of 2023. The highest rental growth of approximately 16% Y-o-Y was recorded in Mumbai owing to limited availability of space, followed by Delhi-NCR and Pune, which noted a marginal rise of 3% and 2% Y-o-Y, respectively.
Bengaluru and Hyderabad saw a rise in vacancy levels due to a consistent infusion of space outpacing the leasing momentum. The Indian commercial real estate sector was not completely insulated from headwinds of slowing global economic growth, with select organizations reducing headcount and a few cities undergoing a technical recession. There was a visible slowdown in demand in the first quarter, with a 14% decline compared to the previous year, which continued in the second quarter, with demand contracting by 9% Y-o-Y.
With quite a few tech companies encouraging employees to return to the office, leasing activity saw a marked improvement in the city. The IT sector accounted for 46% of the leasing activity in Chennai in H1 2023, demonstrating its continued importance to the city's office market. Following the IT-BPM sector, flexible workspaces were leased aggressively, with a contribution of 21% and nearly 0.9 million sq. ft of leased area. The energy and chemicals sector occupiers were also active, with a substantial 19% share in leasing activity in H1 2023, up from a negligible share in H1 2022.
Global Office Space Industry Overview
The global office space market is highly competitive and consists of several players. Some prominent players in the market include CBRE Group, Mitsui Fudosan, Jones Lang LaSalle Incorporated, IWG PLC, and WeWork. These companies leverage strategic collaborative initiatives to increase their market share and profitability. Vendors depend on successive merger and acquisition strategies, research and development, geographic expansion, and new product introduction strategies to execute further business expansion and growth.
Additional Benefits:
- The market estimate (ME) sheet in Excel format
- 3 months of analyst support
TABLE OF CONTENTS
1 INTRODUCTION
- 1.1 Study Deliverables
- 1.2 Study Assumptions
- 1.3 Scope of the Study
2 RESEARCH METHODOLOGY
- 2.1 Analysis Methodology
- 2.2 Research Phases
3 EXECUTIVE SUMMARY
4 MARKET INSIGHTS
- 4.1 Market Overview
- 4.2 Government Regulations and Initiatives
- 4.3 Technological Trends in the Industry
- 4.4 Insights into Office Rents
- 4.5 Insights into Office Space Planning
- 4.6 Impact of Covid-19 on the Market
- 4.7 Value Chain / Supply Chain Analysis
5 MARKET DYNAMICS
- 5.1 Market Drivers
- 5.1.1 Flexible Work Arrangements and Coworking Spaces
- 5.2 Market Restraints
- 5.2.1 Remote Work Trends
- 5.3 Market Opportunities
- 5.3.1 Technology Integration and Smart Offices
- 5.4 Industry Attractiveness - Porter's Five Forces Analysis
- 5.4.1 Threat of New Entrants
- 5.4.2 Bargaining Power of Buyers/Consumers
- 5.4.3 Bargaining Power of Suppliers
- 5.4.4 Threat of Substitute Products
- 5.4.5 Intensity of Competitive Rivalry
6 MARKET SEGMENTATION
- 6.1 By Building Type
- 6.1.1 Retrofits
- 6.1.2 New Buildings
- 6.2 By End User
- 6.2.1 IT and Telecommunications
- 6.2.2 Media and Entertainment
- 6.2.3 Retail and Consumer Goods
- 6.2.4 Other End-users
- 6.3 By Geography
- 6.3.1 North America
- 6.3.1.1 United States
- 6.3.1.2 Canada
- 6.3.2 Europe
- 6.3.2.1 Germany
- 6.3.2.2 United Kingdom
- 6.3.2.3 France
- 6.3.2.4 Rest of the Europe
- 6.3.3 Asia-Pacific
- 6.3.3.1 India
- 6.3.3.2 China
- 6.3.3.3 Japan
- 6.3.3.4 Rest of the Asia-Pacific
- 6.3.4 Middle East and Africa
- 6.3.4.1 South Africa
- 6.3.4.2 United Arab Emirates
- 6.3.4.3 Saudi Arabia
- 6.3.4.4 Egypt
- 6.3.4.5 Rest of the Middle East and Africa
- 6.3.5 Latin America
- 6.3.5.1 Mexico
- 6.3.5.2 Brazil
- 6.3.5.3 Argentina
- 6.3.5.4 Rest of the Latin America
- 6.3.1 North America
7 COMPETITIVE LANDSCAPE
- 7.1 Market Concentration Overview
- 7.2 Company Profiles
- 7.2.1 CBRE Group Inc.
- 7.2.2 Mitsui Fudosan Co. Ltd
- 7.2.3 Jones Lang LaSalle Incorporated
- 7.2.4 IWG PLC
- 7.2.5 WeWork
- 7.2.6 Knotel Inc.
- 7.2.7 Servcorp
- 7.2.8 The Office Group
- 7.2.9 WOJO
- 7.2.10 Mindspace*
- 7.3 Other Companies
