|
|
市場調査レポート
商品コード
1502492
世界の植物性食肉市場2024-2028Global plant-based meat market 2024-2028 |
||||||
|
|||||||
カスタマイズ可能
|
|||||||

| 世界の植物性食肉市場2024-2028 |
|
出版日: 2024年05月31日
発行: TechNavio
ページ情報: 英文 175 Pages
納期: 即納可能
|

全表示
- 概要
- 図表
- 目次
Technavio社は、植物性食肉市場を調査し、2023年から2028年にかけて272億9,380万米ドル、予測期間中のCAGRは36.92%で成長すると予測しています。
当レポートでは、植物性食肉市場の全体的な分析、市場規模・予測、動向、成長促進要因、課題、約25のベンダーを網羅したベンダー分析などを掲載しています。
現在の市場シナリオ、最新動向と促進要因、市場環境全体に関する最新分析を提供しています。市場は、新製品の発売、ベンダーによる市場への投資の増加、ビーガンライフスタイルを実践する人々の増加によって牽引されています。
| 市場範囲 | |
|---|---|
| 基準年 | 2024 |
| 終了年 | 2028 |
| 予測期間 | 2024-2028 |
| 成長モメンタム | 加速 |
| 前年比2024年 | 27.84% |
| CAGR | 36.92% |
| 増分額 | 272億9,380万米ドル |
本調査では、今後数年間の植物性食肉市場成長を牽引する主な要因として、消費者層の変化を挙げています。また、プライベートブランドやセレブリティの推薦が市場の大きな需要につながります。
目次
第1章 エグゼクティブサマリー
- 市場概要
第2章 市場情勢
- 市場エコシステム
- 市場の特徴
- バリューチェーン分析
第3章 市場規模の評価
- 市場の定義
- 市場セグメント分析
- 市場規模 2023
- 市場の見通し 2023-2028
第4章 市場規模実績
- 世界植物性食肉市場 2018-2022
- フードサービス別システムセグメント分析 2018-2022
- タイプ別セグメント分析 2018-2022
- 地域別セグメント分析 2018-2022
- 国別セグメント分析 2018-2022
第5章 ファイブフォース分析
- ファイブフォースの要約
- 買い手の交渉力
- 供給企業の交渉力
- 新規参入業者の脅威
- 代替品の脅威
- 競争の脅威
- 市況
第6章 市場セグメンテーションフードサービスシステム
- 市場セグメンテーション
- 比較フードサービスシステム
- 冷凍:市場規模と予測 2023-2028
- 冷蔵:市場規模と予測 2023-2028
- 常温保存可能:市場規模と予測 2023-2028
- 市場機会フードサービスシステム
第7章 市場セグメンテーション:タイプ別
- 市場セグメンテーション
- 比較:タイプ別
- 植物由来の牛肉:市場規模と予測 2023-2028
- 植物由来の鶏肉:市場規模と予測 2023-2028
- 植物由来の豚肉:市場規模と予測 2023-2028
- その他:市場規模と予測 2023-2028
- 市場機会:タイプ別
第8章 顧客情勢
- 顧客情勢の概要
第9章 地域別情勢
- 地域別セグメンテーション
- 地域別比較
- 北米:市場規模と予測 2023-2028
- 欧州:市場規模と予測 2023-2028
- アジア太平洋:市場規模と予測 2023-2028
- 南米:市場規模と予測 2023-2028
- 中東・アフリカ:市場規模と予測 2023-2028
- 米国:市場規模と予測 2023-2028
- 英国:市場規模と予測 2023-2028
- ドイツ:市場規模と予測 2023-2028
- イタリア:市場規模と予測 2023-2028
- フランス:市場規模と予測 2023-2028
- 市場機会:地域情勢別
第10章 促進要因・課題・機会・抑制要因
- 市場促進要因
- 市場の課題
- 促進要因と課題の影響
- 市場の機会・抑制要因
第11章 競合情勢
- 概要
- 競合情勢
- 混乱の状況
- 業界のリスク
第12章 競合分析
- 企業プロファイル
- 企業の市場ポジショニング
- Albertsons Co. Inc
- Beyond Meat Inc.
- Conagra Brands Inc.
- Ecozone Ltd.
- Gathered Foods Corp.
- Green Monday
- Hormel Foods Corp.
- Impossible Foods Inc.
- Jensen Meat Co.
- Kellogg Co.
- Kerry Group Plc
- Maple Leaf Foods Inc.
- Monde Nissin Corp.
- The Kraft Heinz Co.
- The Tofurky Co. Inc.
第13章 付録
Exhibits:
- Exhibits1: Executive Summary - Chart on Market Overview
- Exhibits2: Executive Summary - Data Table on Market Overview
- Exhibits3: Executive Summary - Chart on Global Market Characteristics
- Exhibits4: Executive Summary - Chart on Market By Geographical Landscape
- Exhibits5: Executive Summary - Chart on Market Segmentation by Foodservice System
- Exhibits6: Executive Summary - Chart on Market Segmentation by Type
- Exhibits7: Executive Summary - Chart on Incremental Growth
- Exhibits8: Executive Summary - Data Table on Incremental Growth
- Exhibits9: Executive Summary - Chart on Company Market Positioning
- Exhibits10: Parent Market
- Exhibits11: Data Table on - Parent Market
- Exhibits12: Market characteristics analysis
- Exhibits13: Value Chain Analysis
- Exhibits14: Offerings of companies included in the market definition
- Exhibits15: Market segments
- Exhibits16: Chart on Global - Market size and forecast 2023-2028 ($ million)
- Exhibits17: Data Table on Global - Market size and forecast 2023-2028 ($ million)
- Exhibits18: Chart on Global Market: Year-over-year growth 2023-2028 (%)
- Exhibits19: Data Table on Global Market: Year-over-year growth 2023-2028 (%)
- Exhibits20: Historic Market Size - Data Table on Global Plant-Based Meat Market 2018 - 2022 ($ million)
- Exhibits21: Historic Market Size - Foodservice System Segment 2018 - 2022 ($ million)
- Exhibits22: Historic Market Size - Type Segment 2018 - 2022 ($ million)
- Exhibits23: Historic Market Size - Geography Segment 2018 - 2022 ($ million)
- Exhibits24: Historic Market Size - Country Segment 2018 - 2022 ($ million)
- Exhibits25: Five forces analysis - Comparison between 2023 and 2028
- Exhibits26: Bargaining power of buyers - Impact of key factors 2023 and 2028
- Exhibits27: Bargaining power of suppliers - Impact of key factors in 2023 and 2028
- Exhibits28: Threat of new entrants - Impact of key factors in 2023 and 2028
- Exhibits29: Threat of substitutes - Impact of key factors in 2023 and 2028
- Exhibits30: Threat of rivalry - Impact of key factors in 2023 and 2028
- Exhibits31: Chart on Market condition - Five forces 2023 and 2028
- Exhibits32: Chart on Foodservice System - Market share 2023-2028 (%)
- Exhibits33: Data Table on Foodservice System - Market share 2023-2028 (%)
- Exhibits34: Chart on Comparison by Foodservice System
- Exhibits35: Data Table on Comparison by Foodservice System
- Exhibits36: Chart on Frozen - Market size and forecast 2023-2028 ($ million)
- Exhibits37: Data Table on Frozen - Market size and forecast 2023-2028 ($ million)
- Exhibits38: Chart on Frozen - Year-over-year growth 2023-2028 (%)
- Exhibits39: Data Table on Frozen - Year-over-year growth 2023-2028 (%)
- Exhibits40: Chart on Refrigerated - Market size and forecast 2023-2028 ($ million)
- Exhibits41: Data Table on Refrigerated - Market size and forecast 2023-2028 ($ million)
- Exhibits42: Chart on Refrigerated - Year-over-year growth 2023-2028 (%)
- Exhibits43: Data Table on Refrigerated - Year-over-year growth 2023-2028 (%)
- Exhibits44: Chart on Shelf-stable - Market size and forecast 2023-2028 ($ million)
- Exhibits45: Data Table on Shelf-stable - Market size and forecast 2023-2028 ($ million)
- Exhibits46: Chart on Shelf-stable - Year-over-year growth 2023-2028 (%)
- Exhibits47: Data Table on Shelf-stable - Year-over-year growth 2023-2028 (%)
- Exhibits48: Market opportunity by Foodservice System ($ million)
- Exhibits49: Data Table on Market opportunity by Foodservice System ($ million)
- Exhibits50: Chart on Type - Market share 2023-2028 (%)
- Exhibits51: Data Table on Type - Market share 2023-2028 (%)
- Exhibits52: Chart on Comparison by Type
- Exhibits53: Data Table on Comparison by Type
- Exhibits54: Chart on Plant based beef - Market size and forecast 2023-2028 ($ million)
- Exhibits55: Data Table on Plant based beef - Market size and forecast 2023-2028 ($ million)
- Exhibits56: Chart on Plant based beef - Year-over-year growth 2023-2028 (%)
- Exhibits57: Data Table on Plant based beef - Year-over-year growth 2023-2028 (%)
- Exhibits58: Chart on Plant based chicken - Market size and forecast 2023-2028 ($ million)
- Exhibits59: Data Table on Plant based chicken - Market size and forecast 2023-2028 ($ million)
- Exhibits60: Chart on Plant based chicken - Year-over-year growth 2023-2028 (%)
- Exhibits61: Data Table on Plant based chicken - Year-over-year growth 2023-2028 (%)
- Exhibits62: Chart on Plant based pork - Market size and forecast 2023-2028 ($ million)
- Exhibits63: Data Table on Plant based pork - Market size and forecast 2023-2028 ($ million)
- Exhibits64: Chart on Plant based pork - Year-over-year growth 2023-2028 (%)
- Exhibits65: Data Table on Plant based pork - Year-over-year growth 2023-2028 (%)
- Exhibits66: Chart on Others - Market size and forecast 2023-2028 ($ million)
- Exhibits67: Data Table on Others - Market size and forecast 2023-2028 ($ million)
- Exhibits68: Chart on Others - Year-over-year growth 2023-2028 (%)
- Exhibits69: Data Table on Others - Year-over-year growth 2023-2028 (%)
- Exhibits70: Market opportunity by Type ($ million)
- Exhibits71: Data Table on Market opportunity by Type ($ million)
- Exhibits72: Analysis of price sensitivity, lifecycle, customer purchase basket, adoption rates, and purchase criteria
- Exhibits73: Chart on Market share By Geographical Landscape 2023-2028 (%)
- Exhibits74: Data Table on Market share By Geographical Landscape 2023-2028 (%)
- Exhibits75: Chart on Geographic comparison
- Exhibits76: Data Table on Geographic comparison
- Exhibits77: Chart on North America - Market size and forecast 2023-2028 ($ million)
- Exhibits78: Data Table on North America - Market size and forecast 2023-2028 ($ million)
- Exhibits79: Chart on North America - Year-over-year growth 2023-2028 (%)
- Exhibits80: Data Table on North America - Year-over-year growth 2023-2028 (%)
- Exhibits81: Chart on Europe - Market size and forecast 2023-2028 ($ million)
- Exhibits82: Data Table on Europe - Market size and forecast 2023-2028 ($ million)
- Exhibits83: Chart on Europe - Year-over-year growth 2023-2028 (%)
- Exhibits84: Data Table on Europe - Year-over-year growth 2023-2028 (%)
- Exhibits85: Chart on APAC - Market size and forecast 2023-2028 ($ million)
- Exhibits86: Data Table on APAC - Market size and forecast 2023-2028 ($ million)
- Exhibits87: Chart on APAC - Year-over-year growth 2023-2028 (%)
- Exhibits88: Data Table on APAC - Year-over-year growth 2023-2028 (%)
- Exhibits89: Chart on South America - Market size and forecast 2023-2028 ($ million)
- Exhibits90: Data Table on South America - Market size and forecast 2023-2028 ($ million)
- Exhibits91: Chart on South America - Year-over-year growth 2023-2028 (%)
- Exhibits92: Data Table on South America - Year-over-year growth 2023-2028 (%)
- Exhibits93: Chart on Middle East and Africa - Market size and forecast 2023-2028 ($ million)
- Exhibits94: Data Table on Middle East and Africa - Market size and forecast 2023-2028 ($ million)
- Exhibits95: Chart on Middle East and Africa - Year-over-year growth 2023-2028 (%)
- Exhibits96: Data Table on Middle East and Africa - Year-over-year growth 2023-2028 (%)
- Exhibits97: Chart on US - Market size and forecast 2023-2028 ($ million)
- Exhibits98: Data Table on US - Market size and forecast 2023-2028 ($ million)
- Exhibits99: Chart on US - Year-over-year growth 2023-2028 (%)
- Exhibits100: Data Table on US - Year-over-year growth 2023-2028 (%)
- Exhibits101: Chart on UK - Market size and forecast 2023-2028 ($ million)
- Exhibits102: Data Table on UK - Market size and forecast 2023-2028 ($ million)
- Exhibits103: Chart on UK - Year-over-year growth 2023-2028 (%)
- Exhibits104: Data Table on UK - Year-over-year growth 2023-2028 (%)
- Exhibits105: Chart on Germany - Market size and forecast 2023-2028 ($ million)
- Exhibits106: Data Table on Germany - Market size and forecast 2023-2028 ($ million)
- Exhibits107: Chart on Germany - Year-over-year growth 2023-2028 (%)
- Exhibits108: Data Table on Germany - Year-over-year growth 2023-2028 (%)
- Exhibits109: Chart on Italy - Market size and forecast 2023-2028 ($ million)
- Exhibits110: Data Table on Italy - Market size and forecast 2023-2028 ($ million)
- Exhibits111: Chart on Italy - Year-over-year growth 2023-2028 (%)
- Exhibits112: Data Table on Italy - Year-over-year growth 2023-2028 (%)
- Exhibits113: Chart on France - Market size and forecast 2023-2028 ($ million)
- Exhibits114: Data Table on France - Market size and forecast 2023-2028 ($ million)
- Exhibits115: Chart on France - Year-over-year growth 2023-2028 (%)
- Exhibits116: Data Table on France - Year-over-year growth 2023-2028 (%)
- Exhibits117: Market opportunity By Geographical Landscape ($ million)
- Exhibits118: Data Tables on Market opportunity By Geographical Landscape ($ million)
- Exhibits119: Impact of drivers and challenges in 2023 and 2028
- Exhibits120: Overview on criticality of inputs and factors of differentiation
- Exhibits121: Overview on factors of disruption
- Exhibits122: Impact of key risks on business
- Exhibits123: Companies covered
- Exhibits124: Matrix on companies position and classification
- Exhibits125: Albertsons Co. Inc - Overview
- Exhibits126: Albertsons Co. Inc - Product / Service
- Exhibits127: Albertsons Co. Inc - Key offerings
- Exhibits128: Beyond Meat Inc. - Overview
- Exhibits129: Beyond Meat Inc. - Product / Service
- Exhibits130: Beyond Meat Inc. - Key offerings
- Exhibits131: Conagra Brands Inc. - Overview
- Exhibits132: Conagra Brands Inc. - Business segments
- Exhibits133: Conagra Brands Inc. - Key offerings
- Exhibits134: Conagra Brands Inc. - Segment focus
- Exhibits135: Ecozone Ltd. - Overview
- Exhibits136: Ecozone Ltd. - Product / Service
- Exhibits137: Ecozone Ltd. - Key offerings
- Exhibits138: Gathered Foods Corp. - Overview
- Exhibits139: Gathered Foods Corp. - Product / Service
- Exhibits140: Gathered Foods Corp. - Key offerings
- Exhibits141: Green Monday - Overview
- Exhibits142: Green Monday - Product / Service
- Exhibits143: Green Monday - Key offerings
- Exhibits144: Hormel Foods Corp. - Overview
- Exhibits145: Hormel Foods Corp. - Business segments
- Exhibits146: Hormel Foods Corp. - Key offerings
- Exhibits147: Hormel Foods Corp. - Segment focus
- Exhibits148: Impossible Foods Inc. - Overview
- Exhibits149: Impossible Foods Inc. - Product / Service
- Exhibits150: Impossible Foods Inc. - Key offerings
- Exhibits151: Jensen Meat Co. - Overview
- Exhibits152: Jensen Meat Co. - Product / Service
- Exhibits153: Jensen Meat Co. - Key offerings
- Exhibits154: Kellogg Co. - Overview
- Exhibits155: Kellogg Co. - Business segments
- Exhibits156: Kellogg Co. - Key news
- Exhibits157: Kellogg Co. - Key offerings
- Exhibits158: Kellogg Co. - Segment focus
- Exhibits159: Kerry Group Plc - Overview
- Exhibits160: Kerry Group Plc - Business segments
- Exhibits161: Kerry Group Plc - Key offerings
- Exhibits162: Kerry Group Plc - Segment focus
- Exhibits163: Maple Leaf Foods Inc. - Overview
- Exhibits164: Maple Leaf Foods Inc. - Business segments
- Exhibits165: Maple Leaf Foods Inc. - Key offerings
- Exhibits166: Maple Leaf Foods Inc. - Segment focus
- Exhibits167: Monde Nissin Corp. - Overview
- Exhibits168: Monde Nissin Corp. - Business segments
- Exhibits169: Monde Nissin Corp. - Key offerings
- Exhibits170: Monde Nissin Corp. - Segment focus
- Exhibits171: The Kraft Heinz Co. - Overview
- Exhibits172: The Kraft Heinz Co. - Business segments
- Exhibits173: The Kraft Heinz Co. - Key offerings
- Exhibits174: The Kraft Heinz Co. - Segment focus
- Exhibits175: The Tofurky Co. Inc. - Overview
- Exhibits176: The Tofurky Co. Inc. - Product / Service
- Exhibits177: The Tofurky Co. Inc. - Key offerings
- Exhibits178: Inclusions checklist
- Exhibits179: Exclusions checklist
- Exhibits180: Currency conversion rates for US$
- Exhibits181: Research methodology
- Exhibits182: Information sources
- Exhibits183: Data validation
- Exhibits184: Validation techniques employed for market sizing
- Exhibits185: Data synthesis
- Exhibits186: 360 degree market analysis
- Exhibits187: List of abbreviations
Technavio has been monitoring the plant-based meat market and is forecast to grow by USD 27293.8 mn during 2023-2028, accelerating at a CAGR of 36.92% during the forecast period. Our report on the plant-based meat market provides a holistic analysis, market size and forecast, trends, growth drivers, and challenges, as well as vendor analysis covering around 25 vendors.
The report offers an up-to-date analysis regarding the current market scenario, the latest trends and drivers, and the overall market environment. The market is driven by new product launches, increasing investments by vendors in the market, and increase in the number of people following the vegan lifestyle.
Technavio's plant-based meat market is segmented as below:
| Market Scope | |
|---|---|
| Base Year | 2024 |
| End Year | 2028 |
| Series Year | 2024-2028 |
| Growth Momentum | Accelerate |
| YOY 2024 | 27.84% |
| CAGR | 36.92% |
| Incremental Value | $27293.8mn |
By Foodservice System
- Frozen
- Refrigerated
- Shelf-stable
By Type
- Plant based beef
- Plant based chicken
- Plant based pork
- Others
By Geographical Landscape
- North America
- Europe
- APAC
- South America
- Middle East and Africa
This study identifies the changing consumer demographics as one of the prime reasons driving the plant-based meat market growth during the next few years. Also, growth of private-label brands and celebrity endorsement will lead to sizable demand in the market.
Technavio presents a detailed picture of the market by the way of study, synthesis, and summation of data from multiple sources by an analysis of key parameters. Our report on the plant-based meat market covers the following areas:
- Plant-based meat market sizing
- Plant-based meat market forecast
- Plant-based meat market industry analysis
Technavio's robust vendor analysis is designed to help clients improve their market position, and in line with this, this report provides a detailed analysis of several leading plant-based meat market vendors that include Albertsons Co. Inc, Beyond Meat Inc., Conagra Brands Inc., Ecozone Ltd., Gathered Foods Corp., Green Monday, Hormel Foods Corp., Impossible Foods Inc., Jensen Meat Co., Kellogg Co., Kerry Group Plc, Kroger Co., Maple Leaf Foods Inc., Monde Nissin Corp., Nestle SA, New Wave Foods, The Kraft Heinz Co., The Tofurky Co. Inc., Tyson Foods Inc., and Unilever PLC. Also, the plant-based meat market analysis report includes information on upcoming trends and challenges that will influence market growth. This is to help companies strategize and leverage all forthcoming growth opportunities.
The study was conducted using an objective combination of primary and secondary information including inputs from key participants in the industry. The report contains a comprehensive market and vendor landscape in addition to an analysis of the key vendors.
Technavio presents a detailed picture of the market by the way of study, synthesis, and summation of data from multiple sources by an analysis of key parameters such as profit, pricing, competition, and promotions. It presents various market facets by identifying the key industry influencers. The data presented is comprehensive, reliable, and a result of extensive research - both primary and secondary. Technavio's market research reports provide a complete competitive landscape and an in-depth vendor selection methodology and analysis using qualitative and quantitative research to forecast accurate market growth.
Table of Contents
1 Executive Summary
- 1.1 Market overview
- Executive Summary - Chart on Market Overview
- Executive Summary - Data Table on Market Overview
- Executive Summary - Chart on Global Market Characteristics
- Executive Summary - Chart on Market By Geographical Landscape
- Executive Summary - Chart on Market Segmentation by Foodservice System
- Executive Summary - Chart on Market Segmentation by Type
- Executive Summary - Chart on Incremental Growth
- Executive Summary - Data Table on Incremental Growth
- Executive Summary - Chart on Company Market Positioning
2 Market Landscape
- 2.1 Market ecosystem
- Parent Market
- Data Table on - Parent Market
- 2.2 Market characteristics
- Market characteristics analysis
- 2.3 Value chain analysis
- Value Chain Analysis
3 Market Sizing
- 3.1 Market definition
- Offerings of companies included in the market definition
- 3.2 Market segment analysis
- Market segments
- 3.3 Market size 2023
- 3.4 Market outlook: Forecast for 2023-2028
- Chart on Global - Market size and forecast 2023-2028 ($ million)
- Data Table on Global - Market size and forecast 2023-2028 ($ million)
- Chart on Global Market: Year-over-year growth 2023-2028 (%)
- Data Table on Global Market: Year-over-year growth 2023-2028 (%)
4 Historic Market Size
- 4.1 Global Plant-Based Meat Market 2018 - 2022
- Historic Market Size - Data Table on Global Plant-Based Meat Market 2018 - 2022 ($ million)
- 4.2 Foodservice System segment analysis 2018 - 2022
- Historic Market Size - Foodservice System Segment 2018 - 2022 ($ million)
- 4.3 Type segment analysis 2018 - 2022
- Historic Market Size - Type Segment 2018 - 2022 ($ million)
- 4.4 Geography segment analysis 2018 - 2022
- Historic Market Size - Geography Segment 2018 - 2022 ($ million)
- 4.5 Country segment analysis 2018 - 2022
- Historic Market Size - Country Segment 2018 - 2022 ($ million)
5 Five Forces Analysis
- 5.1 Five forces summary
- Five forces analysis - Comparison between 2023 and 2028
- 5.2 Bargaining power of buyers
- Bargaining power of buyers - Impact of key factors 2023 and 2028
- 5.3 Bargaining power of suppliers
- Bargaining power of suppliers - Impact of key factors in 2023 and 2028
- 5.4 Threat of new entrants
- Threat of new entrants - Impact of key factors in 2023 and 2028
- 5.5 Threat of substitutes
- Threat of substitutes - Impact of key factors in 2023 and 2028
- 5.6 Threat of rivalry
- Threat of rivalry - Impact of key factors in 2023 and 2028
- 5.7 Market condition
- Chart on Market condition - Five forces 2023 and 2028
6 Market Segmentation by Foodservice System
- 6.1 Market segments
- Chart on Foodservice System - Market share 2023-2028 (%)
- Data Table on Foodservice System - Market share 2023-2028 (%)
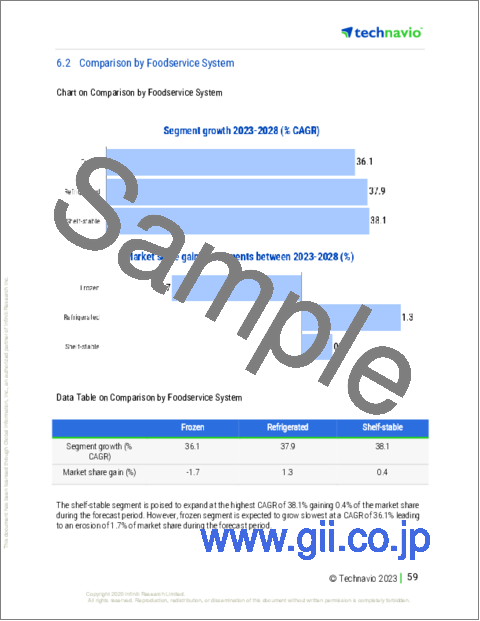
- 6.2 Comparison by Foodservice System
- Chart on Comparison by Foodservice System
- Data Table on Comparison by Foodservice System
- 6.3 Frozen - Market size and forecast 2023-2028
- Chart on Frozen - Market size and forecast 2023-2028 ($ million)
- Data Table on Frozen - Market size and forecast 2023-2028 ($ million)
- Chart on Frozen - Year-over-year growth 2023-2028 (%)
- Data Table on Frozen - Year-over-year growth 2023-2028 (%)
- 6.4 Refrigerated - Market size and forecast 2023-2028
- Chart on Refrigerated - Market size and forecast 2023-2028 ($ million)
- Data Table on Refrigerated - Market size and forecast 2023-2028 ($ million)
- Chart on Refrigerated - Year-over-year growth 2023-2028 (%)
- Data Table on Refrigerated - Year-over-year growth 2023-2028 (%)
- 6.5 Shelf-stable - Market size and forecast 2023-2028
- Chart on Shelf-stable - Market size and forecast 2023-2028 ($ million)
- Data Table on Shelf-stable - Market size and forecast 2023-2028 ($ million)
- Chart on Shelf-stable - Year-over-year growth 2023-2028 (%)
- Data Table on Shelf-stable - Year-over-year growth 2023-2028 (%)
- 6.6 Market opportunity by Foodservice System
- Market opportunity by Foodservice System ($ million)
- Data Table on Market opportunity by Foodservice System ($ million)
7 Market Segmentation by Type
- 7.1 Market segments
- Chart on Type - Market share 2023-2028 (%)
- Data Table on Type - Market share 2023-2028 (%)
- 7.2 Comparison by Type
- Chart on Comparison by Type
- Data Table on Comparison by Type
- 7.3 Plant based beef - Market size and forecast 2023-2028
- Chart on Plant based beef - Market size and forecast 2023-2028 ($ million)
- Data Table on Plant based beef - Market size and forecast 2023-2028 ($ million)
- Chart on Plant based beef - Year-over-year growth 2023-2028 (%)
- Data Table on Plant based beef - Year-over-year growth 2023-2028 (%)
- 7.4 Plant based chicken - Market size and forecast 2023-2028
- Chart on Plant based chicken - Market size and forecast 2023-2028 ($ million)
- Data Table on Plant based chicken - Market size and forecast 2023-2028 ($ million)
- Chart on Plant based chicken - Year-over-year growth 2023-2028 (%)
- Data Table on Plant based chicken - Year-over-year growth 2023-2028 (%)
- 7.5 Plant based pork - Market size and forecast 2023-2028
- Chart on Plant based pork - Market size and forecast 2023-2028 ($ million)
- Data Table on Plant based pork - Market size and forecast 2023-2028 ($ million)
- Chart on Plant based pork - Year-over-year growth 2023-2028 (%)
- Data Table on Plant based pork - Year-over-year growth 2023-2028 (%)
- 7.6 Others - Market size and forecast 2023-2028
- Chart on Others - Market size and forecast 2023-2028 ($ million)
- Data Table on Others - Market size and forecast 2023-2028 ($ million)
- Chart on Others - Year-over-year growth 2023-2028 (%)
- Data Table on Others - Year-over-year growth 2023-2028 (%)
- 7.7 Market opportunity by Type
- Market opportunity by Type ($ million)
- Data Table on Market opportunity by Type ($ million)
8 Customer Landscape
- 8.1 Customer landscape overview
- Analysis of price sensitivity, lifecycle, customer purchase basket, adoption rates, and purchase criteria
9 Geographic Landscape
- 9.1 Geographic segmentation
- Chart on Market share By Geographical Landscape 2023-2028 (%)
- Data Table on Market share By Geographical Landscape 2023-2028 (%)
- 9.2 Geographic comparison
- Chart on Geographic comparison
- Data Table on Geographic comparison
- 9.3 North America - Market size and forecast 2023-2028
- Chart on North America - Market size and forecast 2023-2028 ($ million)
- Data Table on North America - Market size and forecast 2023-2028 ($ million)
- Chart on North America - Year-over-year growth 2023-2028 (%)
- Data Table on North America - Year-over-year growth 2023-2028 (%)
- 9.4 Europe - Market size and forecast 2023-2028
- Chart on Europe - Market size and forecast 2023-2028 ($ million)
- Data Table on Europe - Market size and forecast 2023-2028 ($ million)
- Chart on Europe - Year-over-year growth 2023-2028 (%)
- Data Table on Europe - Year-over-year growth 2023-2028 (%)
- 9.5 APAC - Market size and forecast 2023-2028
- Chart on APAC - Market size and forecast 2023-2028 ($ million)
- Data Table on APAC - Market size and forecast 2023-2028 ($ million)
- Chart on APAC - Year-over-year growth 2023-2028 (%)
- Data Table on APAC - Year-over-year growth 2023-2028 (%)
- 9.6 South America - Market size and forecast 2023-2028
- Chart on South America - Market size and forecast 2023-2028 ($ million)
- Data Table on South America - Market size and forecast 2023-2028 ($ million)
- Chart on South America - Year-over-year growth 2023-2028 (%)
- Data Table on South America - Year-over-year growth 2023-2028 (%)
- 9.7 Middle East and Africa - Market size and forecast 2023-2028
- Chart on Middle East and Africa - Market size and forecast 2023-2028 ($ million)
- Data Table on Middle East and Africa - Market size and forecast 2023-2028 ($ million)
- Chart on Middle East and Africa - Year-over-year growth 2023-2028 (%)
- Data Table on Middle East and Africa - Year-over-year growth 2023-2028 (%)
- 9.8 US - Market size and forecast 2023-2028
- Chart on US - Market size and forecast 2023-2028 ($ million)
- Data Table on US - Market size and forecast 2023-2028 ($ million)
- Chart on US - Year-over-year growth 2023-2028 (%)
- Data Table on US - Year-over-year growth 2023-2028 (%)
- 9.9 UK - Market size and forecast 2023-2028
- Chart on UK - Market size and forecast 2023-2028 ($ million)
- Data Table on UK - Market size and forecast 2023-2028 ($ million)
- Chart on UK - Year-over-year growth 2023-2028 (%)
- Data Table on UK - Year-over-year growth 2023-2028 (%)
- 9.10 Germany - Market size and forecast 2023-2028
- Chart on Germany - Market size and forecast 2023-2028 ($ million)
- Data Table on Germany - Market size and forecast 2023-2028 ($ million)
- Chart on Germany - Year-over-year growth 2023-2028 (%)
- Data Table on Germany - Year-over-year growth 2023-2028 (%)
- 9.11 Italy - Market size and forecast 2023-2028
- Chart on Italy - Market size and forecast 2023-2028 ($ million)
- Data Table on Italy - Market size and forecast 2023-2028 ($ million)
- Chart on Italy - Year-over-year growth 2023-2028 (%)
- Data Table on Italy - Year-over-year growth 2023-2028 (%)
- 9.12 France - Market size and forecast 2023-2028
- Chart on France - Market size and forecast 2023-2028 ($ million)
- Data Table on France - Market size and forecast 2023-2028 ($ million)
- Chart on France - Year-over-year growth 2023-2028 (%)
- Data Table on France - Year-over-year growth 2023-2028 (%)
- 9.13 Market opportunity By Geographical Landscape
- Market opportunity By Geographical Landscape ($ million)
- Data Tables on Market opportunity By Geographical Landscape ($ million)
10 Drivers, Challenges, and Opportunity/Restraints
- 10.1 Market drivers
- 10.2 Market challenges
- 10.3 Impact of drivers and challenges
- Impact of drivers and challenges in 2023 and 2028
- 10.4 Market opportunities/restraints
11 Competitive Landscape
- 11.1 Overview
- 11.2 Competitive Landscape
- Overview on criticality of inputs and factors of differentiation
- 11.3 Landscape disruption
- Overview on factors of disruption
- 11.4 Industry risks
- Impact of key risks on business
12 Competitive Analysis
- 12.1 Companies profiled
- Companies covered
- 12.2 Market positioning of companies
- Matrix on companies position and classification
- 12.3 Albertsons Co. Inc
- Albertsons Co. Inc - Overview
- Albertsons Co. Inc - Product / Service
- Albertsons Co. Inc - Key offerings
- 12.4 Beyond Meat Inc.
- Beyond Meat Inc. - Overview
- Beyond Meat Inc. - Product / Service
- Beyond Meat Inc. - Key offerings
- 12.5 Conagra Brands Inc.
- Conagra Brands Inc. - Overview
- Conagra Brands Inc. - Business segments
- Conagra Brands Inc. - Key offerings
- Conagra Brands Inc. - Segment focus
- 12.6 Ecozone Ltd.
- Ecozone Ltd. - Overview
- Ecozone Ltd. - Product / Service
- Ecozone Ltd. - Key offerings
- 12.7 Gathered Foods Corp.
- Gathered Foods Corp. - Overview
- Gathered Foods Corp. - Product / Service
- Gathered Foods Corp. - Key offerings
- 12.8 Green Monday
- Green Monday - Overview
- Green Monday - Product / Service
- Green Monday - Key offerings
- 12.9 Hormel Foods Corp.
- Hormel Foods Corp. - Overview
- Hormel Foods Corp. - Business segments
- Hormel Foods Corp. - Key offerings
- Hormel Foods Corp. - Segment focus
- 12.10 Impossible Foods Inc.
- Impossible Foods Inc. - Overview
- Impossible Foods Inc. - Product / Service
- Impossible Foods Inc. - Key offerings
- 12.11 Jensen Meat Co.
- Jensen Meat Co. - Overview
- Jensen Meat Co. - Product / Service
- Jensen Meat Co. - Key offerings
- 12.12 Kellogg Co.
- Kellogg Co. - Overview
- Kellogg Co. - Business segments
- Kellogg Co. - Key news
- Kellogg Co. - Key offerings
- Kellogg Co. - Segment focus
- 12.13 Kerry Group Plc
- Kerry Group Plc - Overview
- Kerry Group Plc - Business segments
- Kerry Group Plc - Key offerings
- Kerry Group Plc - Segment focus
- 12.14 Maple Leaf Foods Inc.
- Maple Leaf Foods Inc. - Overview
- Maple Leaf Foods Inc. - Business segments
- Maple Leaf Foods Inc. - Key offerings
- Maple Leaf Foods Inc. - Segment focus
- 12.15 Monde Nissin Corp.
- Monde Nissin Corp. - Overview
- Monde Nissin Corp. - Business segments
- Monde Nissin Corp. - Key offerings
- Monde Nissin Corp. - Segment focus
- 12.16 The Kraft Heinz Co.
- The Kraft Heinz Co. - Overview
- The Kraft Heinz Co. - Business segments
- The Kraft Heinz Co. - Key offerings
- The Kraft Heinz Co. - Segment focus
- 12.17 The Tofurky Co. Inc.
- The Tofurky Co. Inc. - Overview
- The Tofurky Co. Inc. - Product / Service
- The Tofurky Co. Inc. - Key offerings
13 Appendix
- 13.1 Scope of the report
- 13.2 Inclusions and exclusions checklist
- Inclusions checklist
- Exclusions checklist
- 13.3 Currency conversion rates for US$
- Currency conversion rates for US$
- 13.4 Research methodology
- Research methodology
- 13.5 Data procurement
- Information sources
- 13.6 Data validation
- Data validation
- 13.7 Validation techniques employed for market sizing
- Validation techniques employed for market sizing
- 13.8 Data synthesis
- Data synthesis
- 13.9 360 degree market analysis
- 360 degree market analysis
- 13.10 List of abbreviations
- List of abbreviations

