|
|
市場調査レポート
商品コード
1792215
小売業におけるジェネレーティブAIの世界市場 2025-2029Global Generative AI in Retail Market 2025-2029 |
||||||

|
|||||||
カスタマイズ可能
|
|||||||


| 小売業におけるジェネレーティブAIの世界市場 2025-2029 |
|
出版日: 2025年08月07日
発行: TechNavio
ページ情報: 英文 237 Pages
納期: 即納可能
|

全表示
- 概要
- 図表
- 目次
小売業におけるジェネレーティブAI市場は2024-2029年に38億4,670万米ドル、予測期間中のCAGRは40.5%で成長すると予測されます。
当レポートでは、小売業におけるジェネレーティブAI市場の全体的な分析、市場規模・予測、動向、成長促進要因、課題、約25のベンダーを網羅したベンダー分析などを掲載しています。
現在の市場シナリオ、最新動向と促進要因、市場環境全体に関する最新分析を提供しています。市場は、超パーソナライゼーションと顧客体験の向上、業務効率とコスト削減の追求、高度なAIと技術的アクセシビリティの民主化が必須です。
| 市場範囲 | |
|---|---|
| 基準年 | 2025 |
| 終了年 | 2029 |
| 予測期間 | 2025-2029 |
| 成長モメンタム | 加速 |
| 前年比 | 30.7% |
| CAGR | 40.5% |
| 増分額 | 38億4,670万米ドル |
本調査は、業界の主要参加者からのインプットを含め、一次情報と二次情報を客観的に組み合わせて実施しました。レポートには、主要企業の分析に加え、包括的な市場規模データ、地域別分析によるセグメント、ベンダー情勢が含まれています。レポートには過去データと予測データがあります。
本調査では、今後数年間における小売業におけるジェネレーティブAI市場の成長を促進する主な要因の1つとして、没入型・双方向型コマースを実現するマルチモーダルAIの台頭を挙げています。また、ドメインに特化した微調整や特化したモデルへのシフト、責任あるAI、説明可能性、偏りの緩和への重点の高まりは、市場の大きな需要につながるでしょう。
目次
第1章 エグゼクティブサマリー
- 市場概要
第2章 Technavio分析
- 価格・ライフサイクル・顧客購入バスケット・採用率・購入基準の分析
- インプットの重要性と差別化の要因
- 混乱の要因
- 促進要因と課題の影響
第3章 市場情勢
- 市場エコシステム
- 市場の特徴
- バリューチェーン分析
第4章 市場規模
- 市場の定義
- 市場セグメント分析
- 市場規模 2024
- 市場の見通し 2024-2029
第5章 ファイブフォース分析
- ファイブフォースの要約
- 買い手の交渉力
- 供給企業の交渉力
- 新規参入業者の脅威
- 代替品の脅威
- 競争の脅威
- 市況
第6章 市場セグメンテーション:プラットフォーム別
- 市場セグメント
- 比較:プラットフォーム別
- eコマースプラットフォーム:市場規模と予測 2024-2029
- オムニチャネル小売業者:市場規模と予測 2024-2029
- 実店舗:市場規模と予測 2024-2029
- 市場機会:プラットフォーム別
第7章 市場セグメンテーション:技術別
- 市場セグメント
- 比較:技術別
- NLP:市場規模と予測 2024-2029
- コンピュータービジョン:市場規模と予測 2024-2029
- マルチモーダルAI:市場規模と予測 2024-2029
- LLM:市場規模と予測 2024-2029
- 強化学習:市場規模と予測 2024-2029
- 市場機会:技術別
第8章 市場セグメンテーション:用途別
- 市場セグメント
- 比較:用途別
- パーソナライゼーションと顧客体験:市場規模と予測 2024-2029
- 在庫とサプライチェーンの最適化:市場規模と予測 2024-2029
- コンテンツ生成:市場規模と予測 2024-2029
- カスタマーサポート:市場規模と予測 2024-2029
- その他:市場規模と予測 2024-2029
- 市場機会:用途別
第9章 顧客情勢
- 顧客情勢の概要
第10章 地域別情勢
- 地域別セグメンテーション
- 地域別比較
- 北米:市場規模と予測 2024-2029
- アジア太平洋:市場規模と予測 2024-2029
- 欧州:市場規模と予測 2024-2029
- 南米:市場規模と予測 2024-2029
- 中東・アフリカ:市場規模と予測 2024-2029
- 米国:市場規模と予測 2024-2029
- カナダ:市場規模と予測 2024-2029
- 中国:市場規模と予測 2024-2029
- インド:市場規模と予測 2024-2029
- 英国:市場規模と予測 2024-2029
- ドイツ:市場規模と予測 2024-2029
- 日本:市場規模と予測 2024-2029
- フランス:市場規模と予測 2024-2029
- オーストラリア:市場規模と予測 2024-2029
- ブラジル:市場規模と予測 2024-2029
- 市場機会:地域情勢別
第11章 促進要因・課題・機会・抑制要因
- 市場促進要因
- 市場の課題
- 促進要因と課題の影響
- 市場の機会・抑制要因
第12章 競合情勢
- 概要
- 競合情勢
- 混乱の状況
- 業界のリスク
第13章 競合分析
- 企業プロファイル
- 企業ランキング指数
- 企業の市場ポジショニング
- A Mad Street Den
- Adobe Inc.
- Amazon Web Services Inc.
- Constructor
- COVEO
- Dynamic Yield Ltd.
- Google LLC
- HIVERY
- Lily AI
- Microsoft Corp.
- Salesforce Inc.
- Shopify Inc.
- Stylumia Intelligence Technology Pvt Ltd
- Syte
- Zebra Technologies Corp.
第14章 付録
Exhibits:
- Exhibits1: Executive Summary - Chart on Market Overview
- Exhibits2: Executive Summary - Data Table on Market Overview
- Exhibits3: Executive Summary - Chart on Global Market Characteristics
- Exhibits4: Executive Summary - Chart on Market By Geographical Landscape
- Exhibits5: Executive Summary - Chart on Market Segmentation by Platform
- Exhibits6: Executive Summary - Chart on Market Segmentation by Technology
- Exhibits7: Executive Summary - Chart on Market Segmentation by Application
- Exhibits8: Executive Summary - Chart on Incremental Growth
- Exhibits9: Executive Summary - Data Table on Incremental Growth
- Exhibits10: Executive Summary - Chart on Company Market Positioning
- Exhibits11: Analysis of price sensitivity, lifecycle, customer purchase basket, adoption rates, and purchase criteria
- Exhibits12: Overview on criticality of inputs and factors of differentiation
- Exhibits13: Overview on factors of disruption
- Exhibits14: Impact of drivers and challenges in 2024 and 2029
- Exhibits15: Parent Market
- Exhibits16: Data Table on - Parent Market
- Exhibits17: Market characteristics analysis
- Exhibits18: Value chain analysis
- Exhibits19: Offerings of companies included in the market definition
- Exhibits20: Market segments
- Exhibits21: Chart on Global - Market size and forecast 2024-2029 ($ million)
- Exhibits22: Data Table on Global - Market size and forecast 2024-2029 ($ million)
- Exhibits23: Chart on Global Market: Year-over-year growth 2024-2029 (%)
- Exhibits24: Data Table on Global Market: Year-over-year growth 2024-2029 (%)
- Exhibits25: Five forces analysis - Comparison between 2024 and 2029
- Exhibits26: Bargaining power of buyers - Impact of key factors 2024 and 2029
- Exhibits27: Bargaining power of suppliers - Impact of key factors in 2024 and 2029
- Exhibits28: Threat of new entrants - Impact of key factors in 2024 and 2029
- Exhibits29: Threat of substitutes - Impact of key factors in 2024 and 2029
- Exhibits30: Threat of rivalry - Impact of key factors in 2024 and 2029
- Exhibits31: Chart on Market condition - Five forces 2024 and 2029
- Exhibits32: Chart on Platform - Market share 2024-2029 (%)
- Exhibits33: Data Table on Platform - Market share 2024-2029 (%)
- Exhibits34: Chart on Comparison by Platform
- Exhibits35: Data Table on Comparison by Platform
- Exhibits36: Chart on E-commerce platforms - Market size and forecast 2024-2029 ($ million)
- Exhibits37: Data Table on E-commerce platforms - Market size and forecast 2024-2029 ($ million)
- Exhibits38: Chart on E-commerce platforms - Year-over-year growth 2024-2029 (%)
- Exhibits39: Data Table on E-commerce platforms - Year-over-year growth 2024-2029 (%)
- Exhibits40: Chart on Omnichannel retailers - Market size and forecast 2024-2029 ($ million)
- Exhibits41: Data Table on Omnichannel retailers - Market size and forecast 2024-2029 ($ million)
- Exhibits42: Chart on Omnichannel retailers - Year-over-year growth 2024-2029 (%)
- Exhibits43: Data Table on Omnichannel retailers - Year-over-year growth 2024-2029 (%)
- Exhibits44: Chart on Brick-and-mortar stores - Market size and forecast 2024-2029 ($ million)
- Exhibits45: Data Table on Brick-and-mortar stores - Market size and forecast 2024-2029 ($ million)
- Exhibits46: Chart on Brick-and-mortar stores - Year-over-year growth 2024-2029 (%)
- Exhibits47: Data Table on Brick-and-mortar stores - Year-over-year growth 2024-2029 (%)
- Exhibits48: Market opportunity by Platform ($ million)
- Exhibits49: Data Table on Market opportunity by Platform ($ million)
- Exhibits50: Chart on Technology - Market share 2024-2029 (%)
- Exhibits51: Data Table on Technology - Market share 2024-2029 (%)
- Exhibits52: Chart on Comparison by Technology
- Exhibits53: Data Table on Comparison by Technology
- Exhibits54: Chart on NLP - Market size and forecast 2024-2029 ($ million)
- Exhibits55: Data Table on NLP - Market size and forecast 2024-2029 ($ million)
- Exhibits56: Chart on NLP - Year-over-year growth 2024-2029 (%)
- Exhibits57: Data Table on NLP - Year-over-year growth 2024-2029 (%)
- Exhibits58: Chart on Computer vision - Market size and forecast 2024-2029 ($ million)
- Exhibits59: Data Table on Computer vision - Market size and forecast 2024-2029 ($ million)
- Exhibits60: Chart on Computer vision - Year-over-year growth 2024-2029 (%)
- Exhibits61: Data Table on Computer vision - Year-over-year growth 2024-2029 (%)
- Exhibits62: Chart on Multimodal AI - Market size and forecast 2024-2029 ($ million)
- Exhibits63: Data Table on Multimodal AI - Market size and forecast 2024-2029 ($ million)
- Exhibits64: Chart on Multimodal AI - Year-over-year growth 2024-2029 (%)
- Exhibits65: Data Table on Multimodal AI - Year-over-year growth 2024-2029 (%)
- Exhibits66: Chart on LLMs - Market size and forecast 2024-2029 ($ million)
- Exhibits67: Data Table on LLMs - Market size and forecast 2024-2029 ($ million)
- Exhibits68: Chart on LLMs - Year-over-year growth 2024-2029 (%)
- Exhibits69: Data Table on LLMs - Year-over-year growth 2024-2029 (%)
- Exhibits70: Chart on Reinforcement learning - Market size and forecast 2024-2029 ($ million)
- Exhibits71: Data Table on Reinforcement learning - Market size and forecast 2024-2029 ($ million)
- Exhibits72: Chart on Reinforcement learning - Year-over-year growth 2024-2029 (%)
- Exhibits73: Data Table on Reinforcement learning - Year-over-year growth 2024-2029 (%)
- Exhibits74: Market opportunity by Technology ($ million)
- Exhibits75: Data Table on Market opportunity by Technology ($ million)
- Exhibits76: Chart on Application - Market share 2024-2029 (%)
- Exhibits77: Data Table on Application - Market share 2024-2029 (%)
- Exhibits78: Chart on Comparison by Application
- Exhibits79: Data Table on Comparison by Application
- Exhibits80: Chart on Personalization and customer experience - Market size and forecast 2024-2029 ($ million)
- Exhibits81: Data Table on Personalization and customer experience - Market size and forecast 2024-2029 ($ million)
- Exhibits82: Chart on Personalization and customer experience - Year-over-year growth 2024-2029 (%)
- Exhibits83: Data Table on Personalization and customer experience - Year-over-year growth 2024-2029 (%)
- Exhibits84: Chart on Inventory and supply chain optimization - Market size and forecast 2024-2029 ($ million)
- Exhibits85: Data Table on Inventory and supply chain optimization - Market size and forecast 2024-2029 ($ million)
- Exhibits86: Chart on Inventory and supply chain optimization - Year-over-year growth 2024-2029 (%)
- Exhibits87: Data Table on Inventory and supply chain optimization - Year-over-year growth 2024-2029 (%)
- Exhibits88: Chart on Content generation - Market size and forecast 2024-2029 ($ million)
- Exhibits89: Data Table on Content generation - Market size and forecast 2024-2029 ($ million)
- Exhibits90: Chart on Content generation - Year-over-year growth 2024-2029 (%)
- Exhibits91: Data Table on Content generation - Year-over-year growth 2024-2029 (%)
- Exhibits92: Chart on Customer support - Market size and forecast 2024-2029 ($ million)
- Exhibits93: Data Table on Customer support - Market size and forecast 2024-2029 ($ million)
- Exhibits94: Chart on Customer support - Year-over-year growth 2024-2029 (%)
- Exhibits95: Data Table on Customer support - Year-over-year growth 2024-2029 (%)
- Exhibits96: Chart on Others - Market size and forecast 2024-2029 ($ million)
- Exhibits97: Data Table on Others - Market size and forecast 2024-2029 ($ million)
- Exhibits98: Chart on Others - Year-over-year growth 2024-2029 (%)
- Exhibits99: Data Table on Others - Year-over-year growth 2024-2029 (%)
- Exhibits100: Market opportunity by Application ($ million)
- Exhibits101: Data Table on Market opportunity by Application ($ million)
- Exhibits102: Analysis of price sensitivity, lifecycle, customer purchase basket, adoption rates, and purchase criteria
- Exhibits103: Chart on Market share By Geographical Landscape 2024-2029 (%)
- Exhibits104: Data Table on Market share By Geographical Landscape 2024-2029 (%)
- Exhibits105: Chart on Geographic comparison
- Exhibits106: Data Table on Geographic comparison
- Exhibits107: Chart on North America - Market size and forecast 2024-2029 ($ million)
- Exhibits108: Data Table on North America - Market size and forecast 2024-2029 ($ million)
- Exhibits109: Chart on North America - Year-over-year growth 2024-2029 (%)
- Exhibits110: Data Table on North America - Year-over-year growth 2024-2029 (%)
- Exhibits111: Chart on APAC - Market size and forecast 2024-2029 ($ million)
- Exhibits112: Data Table on APAC - Market size and forecast 2024-2029 ($ million)
- Exhibits113: Chart on APAC - Year-over-year growth 2024-2029 (%)
- Exhibits114: Data Table on APAC - Year-over-year growth 2024-2029 (%)
- Exhibits115: Chart on Europe - Market size and forecast 2024-2029 ($ million)
- Exhibits116: Data Table on Europe - Market size and forecast 2024-2029 ($ million)
- Exhibits117: Chart on Europe - Year-over-year growth 2024-2029 (%)
- Exhibits118: Data Table on Europe - Year-over-year growth 2024-2029 (%)
- Exhibits119: Chart on South America - Market size and forecast 2024-2029 ($ million)
- Exhibits120: Data Table on South America - Market size and forecast 2024-2029 ($ million)
- Exhibits121: Chart on South America - Year-over-year growth 2024-2029 (%)
- Exhibits122: Data Table on South America - Year-over-year growth 2024-2029 (%)
- Exhibits123: Chart on Middle East and Africa - Market size and forecast 2024-2029 ($ million)
- Exhibits124: Data Table on Middle East and Africa - Market size and forecast 2024-2029 ($ million)
- Exhibits125: Chart on Middle East and Africa - Year-over-year growth 2024-2029 (%)
- Exhibits126: Data Table on Middle East and Africa - Year-over-year growth 2024-2029 (%)
- Exhibits127: Chart on US - Market size and forecast 2024-2029 ($ million)
- Exhibits128: Data Table on US - Market size and forecast 2024-2029 ($ million)
- Exhibits129: Chart on US - Year-over-year growth 2024-2029 (%)
- Exhibits130: Data Table on US - Year-over-year growth 2024-2029 (%)
- Exhibits131: Chart on Canada - Market size and forecast 2024-2029 ($ million)
- Exhibits132: Data Table on Canada - Market size and forecast 2024-2029 ($ million)
- Exhibits133: Chart on Canada - Year-over-year growth 2024-2029 (%)
- Exhibits134: Data Table on Canada - Year-over-year growth 2024-2029 (%)
- Exhibits135: Chart on China - Market size and forecast 2024-2029 ($ million)
- Exhibits136: Data Table on China - Market size and forecast 2024-2029 ($ million)
- Exhibits137: Chart on China - Year-over-year growth 2024-2029 (%)
- Exhibits138: Data Table on China - Year-over-year growth 2024-2029 (%)
- Exhibits139: Chart on India - Market size and forecast 2024-2029 ($ million)
- Exhibits140: Data Table on India - Market size and forecast 2024-2029 ($ million)
- Exhibits141: Chart on India - Year-over-year growth 2024-2029 (%)
- Exhibits142: Data Table on India - Year-over-year growth 2024-2029 (%)
- Exhibits143: Chart on UK - Market size and forecast 2024-2029 ($ million)
- Exhibits144: Data Table on UK - Market size and forecast 2024-2029 ($ million)
- Exhibits145: Chart on UK - Year-over-year growth 2024-2029 (%)
- Exhibits146: Data Table on UK - Year-over-year growth 2024-2029 (%)
- Exhibits147: Chart on Germany - Market size and forecast 2024-2029 ($ million)
- Exhibits148: Data Table on Germany - Market size and forecast 2024-2029 ($ million)
- Exhibits149: Chart on Germany - Year-over-year growth 2024-2029 (%)
- Exhibits150: Data Table on Germany - Year-over-year growth 2024-2029 (%)
- Exhibits151: Chart on Japan - Market size and forecast 2024-2029 ($ million)
- Exhibits152: Data Table on Japan - Market size and forecast 2024-2029 ($ million)
- Exhibits153: Chart on Japan - Year-over-year growth 2024-2029 (%)
- Exhibits154: Data Table on Japan - Year-over-year growth 2024-2029 (%)
- Exhibits155: Chart on France - Market size and forecast 2024-2029 ($ million)
- Exhibits156: Data Table on France - Market size and forecast 2024-2029 ($ million)
- Exhibits157: Chart on France - Year-over-year growth 2024-2029 (%)
- Exhibits158: Data Table on France - Year-over-year growth 2024-2029 (%)
- Exhibits159: Chart on Australia - Market size and forecast 2024-2029 ($ million)
- Exhibits160: Data Table on Australia - Market size and forecast 2024-2029 ($ million)
- Exhibits161: Chart on Australia - Year-over-year growth 2024-2029 (%)
- Exhibits162: Data Table on Australia - Year-over-year growth 2024-2029 (%)
- Exhibits163: Chart on Brazil - Market size and forecast 2024-2029 ($ million)
- Exhibits164: Data Table on Brazil - Market size and forecast 2024-2029 ($ million)
- Exhibits165: Chart on Brazil - Year-over-year growth 2024-2029 (%)
- Exhibits166: Data Table on Brazil - Year-over-year growth 2024-2029 (%)
- Exhibits167: Market opportunity By Geographical Landscape ($ million)
- Exhibits168: Data Tables on Market opportunity By Geographical Landscape ($ million)
- Exhibits169: Impact of drivers and challenges in 2024 and 2029
- Exhibits170: Overview on criticality of inputs and factors of differentiation
- Exhibits171: Overview on factors of disruption
- Exhibits172: Impact of key risks on business
- Exhibits173: Companies covered
- Exhibits174: Company ranking index
- Exhibits175: Matrix on companies position and classification
- Exhibits176: A Mad Street Den - Overview
- Exhibits177: A Mad Street Den - Product / Service
- Exhibits178: A Mad Street Den - Key offerings
- Exhibits179: SWOT
- Exhibits180: Adobe Inc. - Overview
- Exhibits181: Adobe Inc. - Business segments
- Exhibits182: Adobe Inc. - Key news
- Exhibits183: Adobe Inc. - Key offerings
- Exhibits184: Adobe Inc. - Segment focus
- Exhibits185: SWOT
- Exhibits186: Amazon Web Services Inc. - Overview
- Exhibits187: Amazon Web Services Inc. - Product / Service
- Exhibits188: Amazon Web Services Inc. - Key news
- Exhibits189: Amazon Web Services Inc. - Key offerings
- Exhibits190: SWOT
- Exhibits191: Constructor - Overview
- Exhibits192: Constructor - Product / Service
- Exhibits193: Constructor - Key offerings
- Exhibits194: SWOT
- Exhibits195: COVEO - Overview
- Exhibits196: COVEO - Product / Service
- Exhibits197: COVEO - Key offerings
- Exhibits198: SWOT
- Exhibits199: Dynamic Yield Ltd. - Overview
- Exhibits200: Dynamic Yield Ltd. - Product / Service
- Exhibits201: Dynamic Yield Ltd. - Key offerings
- Exhibits202: SWOT
- Exhibits203: Google LLC - Overview
- Exhibits204: Google LLC - Product / Service
- Exhibits205: Google LLC - Key offerings
- Exhibits206: SWOT
- Exhibits207: HIVERY - Overview
- Exhibits208: HIVERY - Product / Service
- Exhibits209: HIVERY - Key offerings
- Exhibits210: SWOT
- Exhibits211: Lily AI - Overview
- Exhibits212: Lily AI - Product / Service
- Exhibits213: Lily AI - Key offerings
- Exhibits214: SWOT
- Exhibits215: Microsoft Corp. - Overview
- Exhibits216: Microsoft Corp. - Business segments
- Exhibits217: Microsoft Corp. - Key news
- Exhibits218: Microsoft Corp. - Key offerings
- Exhibits219: Microsoft Corp. - Segment focus
- Exhibits220: SWOT
- Exhibits221: Salesforce Inc. - Overview
- Exhibits222: Salesforce Inc. - Product / Service
- Exhibits223: Salesforce Inc. - Key news
- Exhibits224: Salesforce Inc. - Key offerings
- Exhibits225: SWOT
- Exhibits226: Shopify Inc. - Overview
- Exhibits227: Shopify Inc. - Product / Service
- Exhibits228: Shopify Inc. - Key offerings
- Exhibits229: SWOT
- Exhibits230: Stylumia Intelligence Technology Pvt Ltd - Overview
- Exhibits231: Stylumia Intelligence Technology Pvt Ltd - Product / Service
- Exhibits232: Stylumia Intelligence Technology Pvt Ltd - Key offerings
- Exhibits233: SWOT
- Exhibits234: Syte - Overview
- Exhibits235: Syte - Product / Service
- Exhibits236: Syte - Key offerings
- Exhibits237: SWOT
- Exhibits238: Zebra Technologies Corp. - Overview
- Exhibits239: Zebra Technologies Corp. - Business segments
- Exhibits240: Zebra Technologies Corp. - Key news
- Exhibits241: Zebra Technologies Corp. - Key offerings
- Exhibits242: Zebra Technologies Corp. - Segment focus
- Exhibits243: SWOT
- Exhibits244: Inclusions checklist
- Exhibits245: Exclusions checklist
- Exhibits246: Currency conversion rates for US$
- Exhibits247: Research methodology
- Exhibits248: Information sources
- Exhibits249: Data validation
- Exhibits250: Validation techniques employed for market sizing
- Exhibits251: Data synthesis
- Exhibits252: 360 degree market analysis
- Exhibits253: List of abbreviations
The generative AI in retail market is forecasted to grow by USD 3,846.7 mn during 2024-2029, accelerating at a CAGR of 40.5% during the forecast period. The report on the generative AI in retail market provides a holistic analysis, market size and forecast, trends, growth drivers, and challenges, as well as vendor analysis covering around 25 vendors.
The report offers an up-to-date analysis regarding the current market scenario, the latest trends and drivers, and the overall market environment. The market is driven by imperative for hyper-personalization and enhanced customer experience, pursuit of operational efficiency and cost reduction, and democratization of advanced AI and technological accessibility.
| Market Scope | |
|---|---|
| Base Year | 2025 |
| End Year | 2029 |
| Series Year | 2025-2029 |
| Growth Momentum | Accelerate |
| YOY 2025 | 30.7% |
| CAGR | 40.5% |
| Incremental Value | $3,846.7 mn |
The study was conducted using an objective combination of primary and secondary information including inputs from key participants in the industry. The report contains a comprehensive market size data, segment with regional analysis and vendor landscape in addition to an analysis of the key companies. Reports have historic and forecast data.
Technavio's generative AI in retail market is segmented as below:
By Platform
- E-commerce platforms
- Omnichannel retailers
- Brick-and-mortar stores
By Technology
- NLP
- Computer vision
- Multimodal AI
- LLMs
- Reinforcement learning
By Application
- Personalization and customer experience
- Inventory and supply chain optimization
- Content generation
- Customer support
- Others
By Geographical Landscape
- North America
- APAC
- Europe
- South America
- Middle East and Africa
This study identifies the rise of multimodal AI for immersive and interactive commerce as one of the prime reasons driving the generative AI in retail market growth during the next few years. Also, shift toward domain-specific fine-tuning and specialized models and growing emphasis on responsible AI, explainability, and bias mitigation will lead to sizable demand in the market.
The report on the generative AI in retail market covers the following areas:
- generative AI In Retail Market sizing
- generative AI In Retail Market forecast
- generative AI In Retail Market industry analysis
The robust vendor analysis is designed to help clients improve their market position, and in line with this, this report provides a detailed analysis of several leading generative AI in retail market vendors that include A Mad Street Den, Adobe Inc., Amazon Web Services Inc., Constructor, COVEO, Dynamic Yield Ltd., Google LLC, HIVERY, Klevu, Lily AI, Microsoft Corp., Persado Holdings PLC, Salesforce Inc., Shopify Inc., Stylumia Intelligence Technology Pvt Ltd, Syte, Zebra Technologies Corp., and Zeta Global Holdings Corp.. Also, the generative AI in retail market analysis report includes information on upcoming trends and challenges that will influence market growth. This is to help companies strategize and leverage all forthcoming growth opportunities.
The publisher presents a detailed picture of the market by the way of study, synthesis, and summation of data from multiple sources by an analysis of key parameters such as profit, pricing, competition, and promotions. It presents various market facets by identifying the key industry influencers. The data presented is comprehensive, reliable, and a result of extensive primary and secondary research. The market research reports provide a complete competitive landscape and an in-depth vendor selection methodology and analysis using qualitative and quantitative research to forecast accurate market growth.
Table of Contents
1 Executive Summary
- 1.1 Market overview
- Executive Summary - Chart on Market Overview
- Executive Summary - Data Table on Market Overview
- Executive Summary - Chart on Global Market Characteristics
- Executive Summary - Chart on Market By Geographical Landscape
- Executive Summary - Chart on Market Segmentation by Platform
- Executive Summary - Chart on Market Segmentation by Technology
- Executive Summary - Chart on Market Segmentation by Application
- Executive Summary - Chart on Incremental Growth
- Executive Summary - Data Table on Incremental Growth
- Executive Summary - Chart on Company Market Positioning
2 Technavio Analysis
- 2.1 Analysis of price sensitivity, lifecycle, customer purchase basket, adoption rates, and purchase criteria
- Analysis of price sensitivity, lifecycle, customer purchase basket, adoption rates, and purchase criteria
- 2.2 Criticality of inputs and Factors of differentiation
- Overview on criticality of inputs and factors of differentiation
- 2.3 Factors of disruption
- Overview on factors of disruption
- 2.4 Impact of drivers and challenges
- Impact of drivers and challenges in 2024 and 2029
3 Market Landscape
- 3.1 Market ecosystem
- Parent Market
- Data Table on - Parent Market
- 3.2 Market characteristics
- Market characteristics analysis
- 3.3 Value chain analysis
- Value chain analysis
4 Market Sizing
- 4.1 Market definition
- Offerings of companies included in the market definition
- 4.2 Market segment analysis
- Market segments
- 4.3 Market size 2024
- 4.4 Market outlook: Forecast for 2024-2029
- Chart on Global - Market size and forecast 2024-2029 ($ million)
- Data Table on Global - Market size and forecast 2024-2029 ($ million)
- Chart on Global Market: Year-over-year growth 2024-2029 (%)
- Data Table on Global Market: Year-over-year growth 2024-2029 (%)
5 Five Forces Analysis
- 5.1 Five forces summary
- Five forces analysis - Comparison between 2024 and 2029
- 5.2 Bargaining power of buyers
- Bargaining power of buyers - Impact of key factors 2024 and 2029
- 5.3 Bargaining power of suppliers
- Bargaining power of suppliers - Impact of key factors in 2024 and 2029
- 5.4 Threat of new entrants
- Threat of new entrants - Impact of key factors in 2024 and 2029
- 5.5 Threat of substitutes
- Threat of substitutes - Impact of key factors in 2024 and 2029
- 5.6 Threat of rivalry
- Threat of rivalry - Impact of key factors in 2024 and 2029
- 5.7 Market condition
- Chart on Market condition - Five forces 2024 and 2029
6 Market Segmentation by Platform
- 6.1 Market segments
- Chart on Platform - Market share 2024-2029 (%)
- Data Table on Platform - Market share 2024-2029 (%)
- 6.2 Comparison by Platform
- Chart on Comparison by Platform
- Data Table on Comparison by Platform
- 6.3 E-commerce platforms - Market size and forecast 2024-2029
- Chart on E-commerce platforms - Market size and forecast 2024-2029 ($ million)
- Data Table on E-commerce platforms - Market size and forecast 2024-2029 ($ million)
- Chart on E-commerce platforms - Year-over-year growth 2024-2029 (%)
- Data Table on E-commerce platforms - Year-over-year growth 2024-2029 (%)
- 6.4 Omnichannel retailers - Market size and forecast 2024-2029
- Chart on Omnichannel retailers - Market size and forecast 2024-2029 ($ million)
- Data Table on Omnichannel retailers - Market size and forecast 2024-2029 ($ million)
- Chart on Omnichannel retailers - Year-over-year growth 2024-2029 (%)
- Data Table on Omnichannel retailers - Year-over-year growth 2024-2029 (%)
- 6.5 Brick-and-mortar stores - Market size and forecast 2024-2029
- Chart on Brick-and-mortar stores - Market size and forecast 2024-2029 ($ million)
- Data Table on Brick-and-mortar stores - Market size and forecast 2024-2029 ($ million)
- Chart on Brick-and-mortar stores - Year-over-year growth 2024-2029 (%)
- Data Table on Brick-and-mortar stores - Year-over-year growth 2024-2029 (%)
- 6.6 Market opportunity by Platform
- Market opportunity by Platform ($ million)
- Data Table on Market opportunity by Platform ($ million)
7 Market Segmentation by Technology
- 7.1 Market segments
- Chart on Technology - Market share 2024-2029 (%)
- Data Table on Technology - Market share 2024-2029 (%)
- 7.2 Comparison by Technology
- Chart on Comparison by Technology
- Data Table on Comparison by Technology
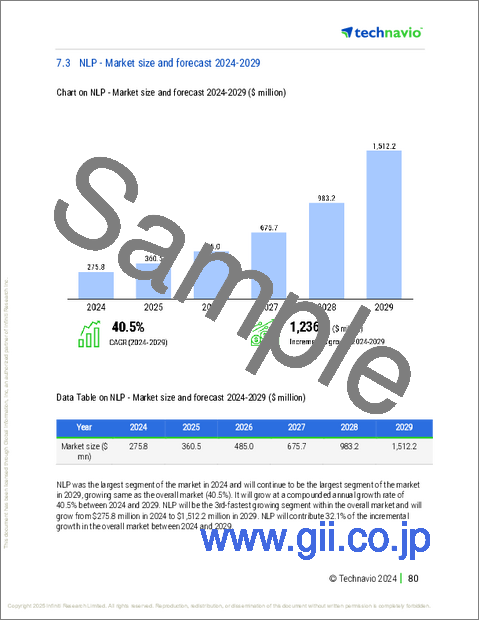
- 7.3 NLP - Market size and forecast 2024-2029
- Chart on NLP - Market size and forecast 2024-2029 ($ million)
- Data Table on NLP - Market size and forecast 2024-2029 ($ million)
- Chart on NLP - Year-over-year growth 2024-2029 (%)
- Data Table on NLP - Year-over-year growth 2024-2029 (%)
- 7.4 Computer vision - Market size and forecast 2024-2029
- Chart on Computer vision - Market size and forecast 2024-2029 ($ million)
- Data Table on Computer vision - Market size and forecast 2024-2029 ($ million)
- Chart on Computer vision - Year-over-year growth 2024-2029 (%)
- Data Table on Computer vision - Year-over-year growth 2024-2029 (%)
- 7.5 Multimodal AI - Market size and forecast 2024-2029
- Chart on Multimodal AI - Market size and forecast 2024-2029 ($ million)
- Data Table on Multimodal AI - Market size and forecast 2024-2029 ($ million)
- Chart on Multimodal AI - Year-over-year growth 2024-2029 (%)
- Data Table on Multimodal AI - Year-over-year growth 2024-2029 (%)
- 7.6 LLMs - Market size and forecast 2024-2029
- Chart on LLMs - Market size and forecast 2024-2029 ($ million)
- Data Table on LLMs - Market size and forecast 2024-2029 ($ million)
- Chart on LLMs - Year-over-year growth 2024-2029 (%)
- Data Table on LLMs - Year-over-year growth 2024-2029 (%)
- 7.7 Reinforcement learning - Market size and forecast 2024-2029
- Chart on Reinforcement learning - Market size and forecast 2024-2029 ($ million)
- Data Table on Reinforcement learning - Market size and forecast 2024-2029 ($ million)
- Chart on Reinforcement learning - Year-over-year growth 2024-2029 (%)
- Data Table on Reinforcement learning - Year-over-year growth 2024-2029 (%)
- 7.8 Market opportunity by Technology
- Market opportunity by Technology ($ million)
- Data Table on Market opportunity by Technology ($ million)
8 Market Segmentation by Application
- 8.1 Market segments
- Chart on Application - Market share 2024-2029 (%)
- Data Table on Application - Market share 2024-2029 (%)
- 8.2 Comparison by Application
- Chart on Comparison by Application
- Data Table on Comparison by Application
- 8.3 Personalization and customer experience - Market size and forecast 2024-2029
- Chart on Personalization and customer experience - Market size and forecast 2024-2029 ($ million)
- Data Table on Personalization and customer experience - Market size and forecast 2024-2029 ($ million)
- Chart on Personalization and customer experience - Year-over-year growth 2024-2029 (%)
- Data Table on Personalization and customer experience - Year-over-year growth 2024-2029 (%)
- 8.4 Inventory and supply chain optimization - Market size and forecast 2024-2029
- Chart on Inventory and supply chain optimization - Market size and forecast 2024-2029 ($ million)
- Data Table on Inventory and supply chain optimization - Market size and forecast 2024-2029 ($ million)
- Chart on Inventory and supply chain optimization - Year-over-year growth 2024-2029 (%)
- Data Table on Inventory and supply chain optimization - Year-over-year growth 2024-2029 (%)
- 8.5 Content generation - Market size and forecast 2024-2029
- Chart on Content generation - Market size and forecast 2024-2029 ($ million)
- Data Table on Content generation - Market size and forecast 2024-2029 ($ million)
- Chart on Content generation - Year-over-year growth 2024-2029 (%)
- Data Table on Content generation - Year-over-year growth 2024-2029 (%)
- 8.6 Customer support - Market size and forecast 2024-2029
- Chart on Customer support - Market size and forecast 2024-2029 ($ million)
- Data Table on Customer support - Market size and forecast 2024-2029 ($ million)
- Chart on Customer support - Year-over-year growth 2024-2029 (%)
- Data Table on Customer support - Year-over-year growth 2024-2029 (%)
- 8.7 Others - Market size and forecast 2024-2029
- Chart on Others - Market size and forecast 2024-2029 ($ million)
- Data Table on Others - Market size and forecast 2024-2029 ($ million)
- Chart on Others - Year-over-year growth 2024-2029 (%)
- Data Table on Others - Year-over-year growth 2024-2029 (%)
- 8.8 Market opportunity by Application
- Market opportunity by Application ($ million)
- Data Table on Market opportunity by Application ($ million)
9 Customer Landscape
- 9.1 Customer landscape overview
- Analysis of price sensitivity, lifecycle, customer purchase basket, adoption rates, and purchase criteria
10 Geographic Landscape
- 10.1 Geographic segmentation
- Chart on Market share By Geographical Landscape 2024-2029 (%)
- Data Table on Market share By Geographical Landscape 2024-2029 (%)
- 10.2 Geographic comparison
- Chart on Geographic comparison
- Data Table on Geographic comparison
- 10.3 North America - Market size and forecast 2024-2029
- Chart on North America - Market size and forecast 2024-2029 ($ million)
- Data Table on North America - Market size and forecast 2024-2029 ($ million)
- Chart on North America - Year-over-year growth 2024-2029 (%)
- Data Table on North America - Year-over-year growth 2024-2029 (%)
- 10.4 APAC - Market size and forecast 2024-2029
- Chart on APAC - Market size and forecast 2024-2029 ($ million)
- Data Table on APAC - Market size and forecast 2024-2029 ($ million)
- Chart on APAC - Year-over-year growth 2024-2029 (%)
- Data Table on APAC - Year-over-year growth 2024-2029 (%)
- 10.5 Europe - Market size and forecast 2024-2029
- Chart on Europe - Market size and forecast 2024-2029 ($ million)
- Data Table on Europe - Market size and forecast 2024-2029 ($ million)
- Chart on Europe - Year-over-year growth 2024-2029 (%)
- Data Table on Europe - Year-over-year growth 2024-2029 (%)
- 10.6 South America - Market size and forecast 2024-2029
- Chart on South America - Market size and forecast 2024-2029 ($ million)
- Data Table on South America - Market size and forecast 2024-2029 ($ million)
- Chart on South America - Year-over-year growth 2024-2029 (%)
- Data Table on South America - Year-over-year growth 2024-2029 (%)
- 10.7 Middle East and Africa - Market size and forecast 2024-2029
- Chart on Middle East and Africa - Market size and forecast 2024-2029 ($ million)
- Data Table on Middle East and Africa - Market size and forecast 2024-2029 ($ million)
- Chart on Middle East and Africa - Year-over-year growth 2024-2029 (%)
- Data Table on Middle East and Africa - Year-over-year growth 2024-2029 (%)
- 10.8 US - Market size and forecast 2024-2029
- Chart on US - Market size and forecast 2024-2029 ($ million)
- Data Table on US - Market size and forecast 2024-2029 ($ million)
- Chart on US - Year-over-year growth 2024-2029 (%)
- Data Table on US - Year-over-year growth 2024-2029 (%)
- 10.9 Canada - Market size and forecast 2024-2029
- Chart on Canada - Market size and forecast 2024-2029 ($ million)
- Data Table on Canada - Market size and forecast 2024-2029 ($ million)
- Chart on Canada - Year-over-year growth 2024-2029 (%)
- Data Table on Canada - Year-over-year growth 2024-2029 (%)
- 10.10 China - Market size and forecast 2024-2029
- Chart on China - Market size and forecast 2024-2029 ($ million)
- Data Table on China - Market size and forecast 2024-2029 ($ million)
- Chart on China - Year-over-year growth 2024-2029 (%)
- Data Table on China - Year-over-year growth 2024-2029 (%)
- 10.11 India - Market size and forecast 2024-2029
- Chart on India - Market size and forecast 2024-2029 ($ million)
- Data Table on India - Market size and forecast 2024-2029 ($ million)
- Chart on India - Year-over-year growth 2024-2029 (%)
- Data Table on India - Year-over-year growth 2024-2029 (%)
- 10.12 UK - Market size and forecast 2024-2029
- Chart on UK - Market size and forecast 2024-2029 ($ million)
- Data Table on UK - Market size and forecast 2024-2029 ($ million)
- Chart on UK - Year-over-year growth 2024-2029 (%)
- Data Table on UK - Year-over-year growth 2024-2029 (%)
- 10.13 Germany - Market size and forecast 2024-2029
- Chart on Germany - Market size and forecast 2024-2029 ($ million)
- Data Table on Germany - Market size and forecast 2024-2029 ($ million)
- Chart on Germany - Year-over-year growth 2024-2029 (%)
- Data Table on Germany - Year-over-year growth 2024-2029 (%)
- 10.14 Japan - Market size and forecast 2024-2029
- Chart on Japan - Market size and forecast 2024-2029 ($ million)
- Data Table on Japan - Market size and forecast 2024-2029 ($ million)
- Chart on Japan - Year-over-year growth 2024-2029 (%)
- Data Table on Japan - Year-over-year growth 2024-2029 (%)
- 10.15 France - Market size and forecast 2024-2029
- Chart on France - Market size and forecast 2024-2029 ($ million)
- Data Table on France - Market size and forecast 2024-2029 ($ million)
- Chart on France - Year-over-year growth 2024-2029 (%)
- Data Table on France - Year-over-year growth 2024-2029 (%)
- 10.16 Australia - Market size and forecast 2024-2029
- Chart on Australia - Market size and forecast 2024-2029 ($ million)
- Data Table on Australia - Market size and forecast 2024-2029 ($ million)
- Chart on Australia - Year-over-year growth 2024-2029 (%)
- Data Table on Australia - Year-over-year growth 2024-2029 (%)
- 10.17 Brazil - Market size and forecast 2024-2029
- Chart on Brazil - Market size and forecast 2024-2029 ($ million)
- Data Table on Brazil - Market size and forecast 2024-2029 ($ million)
- Chart on Brazil - Year-over-year growth 2024-2029 (%)
- Data Table on Brazil - Year-over-year growth 2024-2029 (%)
- 10.18 Market opportunity By Geographical Landscape
- Market opportunity By Geographical Landscape ($ million)
- Data Tables on Market opportunity By Geographical Landscape ($ million)
11 Drivers, Challenges, and Opportunity/Restraints
- 11.1 Market drivers
- 11.2 Market challenges
- 11.3 Impact of drivers and challenges
- Impact of drivers and challenges in 2024 and 2029
- 11.4 Market opportunities/restraints
12 Competitive Landscape
- 12.1 Overview
- 12.2 Competitive Landscape
- Overview on criticality of inputs and factors of differentiation
- 12.3 Landscape disruption
- Overview on factors of disruption
- 12.4 Industry risks
- Impact of key risks on business
13 Competitive Analysis
- 13.1 Companies profiled
- Companies covered
- 13.2 Company ranking index
- Company ranking index
- 13.3 Market positioning of companies
- Matrix on companies position and classification
- 13.4 A Mad Street Den
- A Mad Street Den - Overview
- A Mad Street Den - Product / Service
- A Mad Street Den - Key offerings
- SWOT
- 13.5 Adobe Inc.
- Adobe Inc. - Overview
- Adobe Inc. - Business segments
- Adobe Inc. - Key news
- Adobe Inc. - Key offerings
- Adobe Inc. - Segment focus
- SWOT
- 13.6 Amazon Web Services Inc.
- Amazon Web Services Inc. - Overview
- Amazon Web Services Inc. - Product / Service
- Amazon Web Services Inc. - Key news
- Amazon Web Services Inc. - Key offerings
- SWOT
- 13.7 Constructor
- Constructor - Overview
- Constructor - Product / Service
- Constructor - Key offerings
- SWOT
- 13.8 COVEO
- COVEO - Overview
- COVEO - Product / Service
- COVEO - Key offerings
- SWOT
- 13.9 Dynamic Yield Ltd.
- Dynamic Yield Ltd. - Overview
- Dynamic Yield Ltd. - Product / Service
- Dynamic Yield Ltd. - Key offerings
- SWOT
- 13.10 Google LLC
- Google LLC - Overview
- Google LLC - Product / Service
- Google LLC - Key offerings
- SWOT
- 13.11 HIVERY
- HIVERY - Overview
- HIVERY - Product / Service
- HIVERY - Key offerings
- SWOT
- 13.12 Lily AI
- Lily AI - Overview
- Lily AI - Product / Service
- Lily AI - Key offerings
- SWOT
- 13.13 Microsoft Corp.
- Microsoft Corp. - Overview
- Microsoft Corp. - Business segments
- Microsoft Corp. - Key news
- Microsoft Corp. - Key offerings
- Microsoft Corp. - Segment focus
- SWOT
- 13.14 Salesforce Inc.
- Salesforce Inc. - Overview
- Salesforce Inc. - Product / Service
- Salesforce Inc. - Key news
- Salesforce Inc. - Key offerings
- SWOT
- 13.15 Shopify Inc.
- Shopify Inc. - Overview
- Shopify Inc. - Product / Service
- Shopify Inc. - Key offerings
- SWOT
- 13.16 Stylumia Intelligence Technology Pvt Ltd
- Stylumia Intelligence Technology Pvt Ltd - Overview
- Stylumia Intelligence Technology Pvt Ltd - Product / Service
- Stylumia Intelligence Technology Pvt Ltd - Key offerings
- SWOT
- 13.17 Syte
- Syte - Overview
- Syte - Product / Service
- Syte - Key offerings
- SWOT
- 13.18 Zebra Technologies Corp.
- Zebra Technologies Corp. - Overview
- Zebra Technologies Corp. - Business segments
- Zebra Technologies Corp. - Key news
- Zebra Technologies Corp. - Key offerings
- Zebra Technologies Corp. - Segment focus
- SWOT
14 Appendix
- 14.1 Scope of the report
- 14.2 Inclusions and exclusions checklist
- Inclusions checklist
- Exclusions checklist
- 14.3 Currency conversion rates for US$
- Currency conversion rates for US$
- 14.4 Research methodology
- Research methodology
- 14.5 Data procurement
- Information sources
- 14.6 Data validation
- Data validation
- 14.7 Validation techniques employed for market sizing
- Validation techniques employed for market sizing
- 14.8 Data synthesis
- Data synthesis
- 14.9 360 degree market analysis
- 360 degree market analysis
- 14.10 List of abbreviations
- List of abbreviations
