
|
市場調査レポート
商品コード
1666974
オープントランジション転送スイッチ市場の機会、成長促進要因、産業動向分析、2025~2034年の予測Open Transition Transfer Switch Market Opportunity, Growth Drivers, Industry Trend Analysis, and Forecast 2025 - 2034 |
||||||
カスタマイズ可能
|
|||||||
| オープントランジション転送スイッチ市場の機会、成長促進要因、産業動向分析、2025~2034年の予測 |
|
出版日: 2024年12月26日
発行: Global Market Insights Inc.
ページ情報: 英文 100 Pages
納期: 2~3営業日
|

全表示
- 概要
- 目次
2024年に14億米ドルと評価されたオープントランジション転送スイッチの世界市場は、2025年から2034年にかけてCAGR 4.9%で成長すると予測されています。
この成長には、住宅、商業、産業用途で信頼性の高い電源バックアップシステムに対するニーズが高まっていることが背景にあります。安全性、効率性、規制基準の遵守が重視されるようになり、技術革新が促進され続けています。再生可能エネルギーの統合を推進する政府の取り組みは、業界に新たな道を開きます。オートメーションと接続技術の進歩は、シームレスな移行とリアルタイムの遠隔監視を可能にし、市場の提供を大幅に改善しました。
これらのシステムへのスマート技術の統合は、現代のエネルギー課題に対処することで業界を変革しています。電力変動を検知して対応するように設計された自動化ソリューションが普及し、性能と信頼性が向上しています。カスタマイズに対する消費者の期待の高まりと、厳格な安全基準への準拠の必要性により、メーカー各社は、進化する需要に合わせた堅牢で効率的な設計の実現に注力しています。これらの進歩は、持続可能で弾力性のあるエネルギーインフラへの幅広いシフトと一致しており、オープントランジション転送スイッチを現代の電力システムに不可欠なコンポーネントとして位置づけています。
| 市場範囲 | |
|---|---|
| 開始年 | 2024 |
| 予測年 | 2025-2034 |
| 開始金額 | 14億米ドル |
| 予測金額 | 24億米ドル |
| CAGR | 4.9% |
サーキットブレーカーベースのスイッチング機構は、2034年までに13億米ドルを超えると予想されています。より高い故障電流を処理し、優れた保護を提供できることから、多くの用途で好んで使用されています。さらに、自動化とインテリジェント制御の導入が進んでいるため、これらのシステムの機能が強化され、採用がさらに進んでいます。メーカー各社は引き続き技術革新に注力し、運用効率と信頼性を最優先したソリューションを提供することで競争しています。
米国は、2034年までに同国のオープントランジション転送スイッチ部門が4億米ドルを超えると予測されており、今後も同市場の主要プレーヤーであり続けると思われます。電力の信頼性に対する懸念が高まり、複数の産業でバックアップ電源システムへの依存度が高まっていることが、この地域の主な促進要因となっています。再生可能エネルギー、特に太陽光発電の普及は、これらのシステムがハイブリッドエネルギーのセットアップにシームレスに統合できるため、需要をさらに加速させています。米国を拠点とするメーカーは、製品の機能性を向上させ、スマート・エネルギー・ソリューションに対するニーズの高まりに対応するため、遠隔診断やモニタリング機能などの最先端技術を取り入れることに注力しています。
信頼性が高く、効率的でインテリジェントな送電システムへの需要が高まり続ける中、世界のオープントランジション転送スイッチ市場は持続的な成長を遂げようとしています。技術革新、安全性、持続可能性を重視するこの業界は、現代のエネルギー管理システムにおける重要なプレーヤーとしての役割を確実なものにしています。
目次
第1章 調査手法と調査範囲
- 市場の定義
- 基本推定と計算
- 予測計算
- データソース
- 1次データ
- 2次データ
- 有償
- 公的
第2章 エグゼクティブサマリー
第3章 業界洞察
- エコシステム分析
- 規制状況
- 業界への影響要因
- 促進要因
- 業界の潜在的リスク&課題
- 成長可能性分析
- ポーターの分析
- 供給企業の交渉力
- 買い手の交渉力
- 新規参入業者の脅威
- 代替品の脅威
- PESTEL分析
第4章 競合情勢
- 戦略ダッシュボード
- イノベーションと持続可能性の展望
第5章 市場規模・予測:事業別、2021年~2034年
- 主要動向
- 手動
- 非自動
- 自動
- バイパス分離
第6章 市場規模・予測:スイッチング機構別、2021年~2034年
- 主要動向
- コンタクタ
- サーキットブレーカー
第7章 市場規模・予測:アンペア定格別、2021年~2034年
- 主要動向
- 400アンペア以下
- 401アンペア~1600アンペア
- 1600アンペア以上超
第8章 市場規模・予測:設置場所別、2021年~2034年
- 主要動向
- 緊急システム
- 法定システム
- 重要業務用電源システム
- オプション待機システム
第9章 市場規模・予測:地域別、2021年~2034年
- 主要動向
- 北米
- 米国
- カナダ
- メキシコ
- 欧州
- ドイツ
- フランス
- ロシア
- 英国
- イタリア
- スペイン
- アジア太平洋
- 中国
- 日本
- 韓国
- インド
- オーストラリア
- 中東・アフリカ
- UAE
- サウジアラビア
- 南アフリカ
- ラテンアメリカ
- ブラジル
- アルゼンチン
第10章 企業プロファイル
- ABB
- AEG Power Solutions
- Briggs &Stratton
- Caterpillar
- Cummins
- Eaton
- Generac Power Systems
- General Electric
- Kohler
- Midwest Electric Products
- One Two Three Electric
- Schneider Electric
- Siemens
- Vertiv Group
- Victron Energy
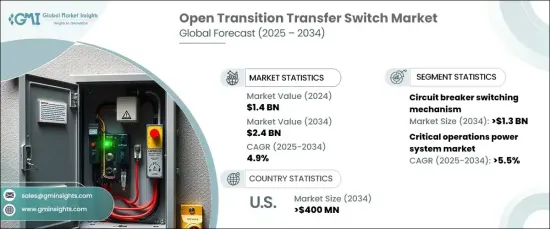
The Global Open Transition Transfer Switch Market, valued at USD 1.4 billion in 2024, is projected to grow at a CAGR of 4.9% between 2025 and 2034. This growth is fueled by the rising need for dependable power backup systems across residential, commercial, and industrial applications. The increasing emphasis on safety, efficiency, and adherence to regulatory standards continues to encourage innovation. Government initiatives promoting renewable energy integration further open new avenues for the industry. Advancements in automation and connectivity technologies have significantly improved the market's offerings, enabling seamless transitions and real-time remote monitoring.
The integration of smart technologies into these systems is transforming the industry by addressing modern energy challenges. Automated solutions designed to detect and respond to power fluctuations have gained traction, providing enhanced performance and reliability. Growing consumer expectations for customization and the need for compliance with stringent safety standards drive manufacturers to focus on creating robust, efficient designs tailored to evolving demands. These advancements align with the broader shift toward sustainable and resilient energy infrastructure, positioning open transition transfer switches as essential components in contemporary power systems.
| Market Scope | |
|---|---|
| Start Year | 2024 |
| Forecast Year | 2025-2034 |
| Start Value | $1.4 Billion |
| Forecast Value | $2.4 Billion |
| CAGR | 4.9% |
Circuit breaker-based switching mechanisms are expected to exceed USD 1.3 billion by 2034. Their ability to handle higher fault currents and deliver superior protection has made them a preferred choice in many applications. Additionally, the growing incorporation of automation and intelligent controls is enhancing the functionality of these systems, further driving their adoption. Manufacturers continue to compete by focusing on innovation, offering solutions that prioritize operational efficiency and reliability.
The United States is set to remain a key player in the market, with the country's open transition transfer switch sector forecasted to surpass USD 400 million by 2034. Heightened concerns about power reliability and increasing reliance on backup power systems across multiple industries are key drivers in the region. The rise in renewable energy adoption, particularly solar, is further accelerating demand as these systems can seamlessly integrate into hybrid energy setups. US-based manufacturers are concentrating on incorporating cutting-edge technologies such as remote diagnostics and monitoring capabilities to improve product functionality and cater to the growing need for smart energy solutions.
As the demand for reliable, efficient, and intelligent power transfer systems continues to rise, the global open transition transfer switch market is poised for sustained growth. The industry's focus on innovation, safety, and sustainability ensures its role as a critical player in modern energy management systems.
Table of Contents
Chapter 1 Methodology & Scope
- 1.1 Market definitions
- 1.2 Base estimates & calculations
- 1.3 Forecast calculation
- 1.4 Data sources
- 1.4.1 Primary
- 1.4.2 Secondary
- 1.4.2.1 Paid
- 1.4.2.2 Public
Chapter 2 Executive Summary
- 2.1 Industry synopsis, 2021 - 2034
Chapter 3 Industry Insights
- 3.1 Industry ecosystem analysis
- 3.2 Regulatory landscape
- 3.3 Industry impact forces
- 3.3.1 Growth drivers
- 3.3.2 Industry pitfalls & challenges
- 3.4 Growth potential analysis
- 3.5 Porter's analysis
- 3.5.1 Bargaining power of suppliers
- 3.5.2 Bargaining power of buyers
- 3.5.3 Threat of new entrants
- 3.5.4 Threat of substitutes
- 3.6 PESTEL analysis
Chapter 4 Competitive Landscape, 2024
- 4.1 Strategic dashboard
- 4.2 Innovation & sustainability landscape
Chapter 5 Market Size and Forecast, By Operations, 2021 – 2034 (‘000 Units, USD Million)
- 5.1 Key trends
- 5.2 Manual
- 5.3 Non-automatic
- 5.4 Automatic
- 5.5 By-pass isolation
Chapter 6 Market Size and Forecast, By Switching Mechanism, 2021 – 2034 (‘000 Units, USD Million)
- 6.1 Key trends
- 6.2 Contactor
- 6.3 Circuit Breaker
Chapter 7 Market Size and Forecast, By Ampere Rating, 2021 – 2034 (‘000 Units, USD Million)
- 7.1 Key trends
- 7.2 ≤ 400 Amp
- 7.3 401 Amp to 1600 Amp
- 7.4 > 1600 Amp
Chapter 8 Market Size and Forecast, Market, By Installation, 2021 – 2034 (‘000 Units, USD Million)
- 8.1 Key trends
- 8.2 Emergency systems
- 8.3 Legally required systems
- 8.4 Critical operations power systems
- 8.5 Optional standby systems
Chapter 9 Market Size and Forecast, By Region, 2021 – 2034 (‘000 Units, USD Million)
- 9.1 Key trends
- 9.2 North America
- 9.2.1 U.S.
- 9.2.2 Canada
- 9.2.3 Mexico
- 9.3 Europe
- 9.3.1 Germany
- 9.3.2 France
- 9.3.3 Russia
- 9.3.4 UK
- 9.3.5 Italy
- 9.3.6 Spain
- 9.4 Asia Pacific
- 9.4.1 China
- 9.4.2 Japan
- 9.4.3 South Korea
- 9.4.4 India
- 9.4.5 Australia
- 9.5 Middle East & Africa
- 9.5.1 UAE
- 9.5.2 Saudi Arabia
- 9.5.3 South Africa
- 9.6 Latin America
- 9.6.1 Brazil
- 9.6.2 Argentina
Chapter 10 Company Profiles
- 10.1 ABB
- 10.2 AEG Power Solutions
- 10.3 Briggs & Stratton
- 10.4 Caterpillar
- 10.5 Cummins
- 10.6 Eaton
- 10.7 Generac Power Systems
- 10.8 General Electric
- 10.9 Kohler
- 10.10 Midwest Electric Products
- 10.11 One Two Three Electric
- 10.12 Schneider Electric
- 10.13 Siemens
- 10.14 Vertiv Group
- 10.15 Victron Energy

