|
|
市場調査レポート
商品コード
1583969
ドッグフードの世界市場、2024~2028年Global Dog Food Market 2024-2028 |
||||||
|
|||||||
カスタマイズ可能
|
|||||||


| ドッグフードの世界市場、2024~2028年 |
|
出版日: 2024年08月15日
発行: TechNavio
ページ情報: 英文 164 Pages
納期: 即納可能
|

全表示
- 概要
- 図表
- 目次
ドッグフード市場は2023~2028年に161億米ドル、予測期間中のCAGRは4.39%で成長すると予測されます。
当レポートでは、ドッグフード市場の全体的な分析、市場規模・予測、動向、成長促進要因、課題、約25のベンダーを網羅したベンダー分析などを掲載しています。
現在の市場シナリオ、最新動向と促進要因、市場環境全体に関する最新分析を提供しています。市場は、ペットの健康に対する意識の高まり、ペットの健康とウェルネスへの関心の高まり、マーケティングキャンペーンやパッケージングの革新によって牽引されています。
| 市場範囲 | |
|---|---|
| 基準年 | 2024年 |
| 終了年 | 2028年 |
| 予測期間 | 2024~2028年 |
| 成長モメンタム | 加速 |
| 前年比[2024年] | 4.17% |
| CAGR | 4.39% |
| 増分額 | 161億米ドル |
本調査では、今後数年間におけるドッグフード市場の成長を促進する主要理由の1つとして、ペットの採用と人間化を挙げています。また、オーガニックドッグフードやオムニチャネル小売への需要の高まりも、市場の大きな需要につながると考えられます。
目次
第1章 エグゼクティブサマリー
- 市場概要
第2章 市場情勢
- 市場エコシステム
- 市場の特徴
- バリューチェーン分析
第3章 市場規模の評価
- 市場の定義
- 市場セグメント分析
- 市場規模 2023年
- 市場の展望 2023~2028年
第4章 市場規模実績
- ドッグフードの世界市場 2018~2022年
- 製品別セグメント分析 2018~2022年
- 流通チャネル別セグメント分析 2018~2022年
- 地域別セグメント分析 2018~2022年
- 国別セグメント分析 2018~2022年
第5章 ファイブフォース分析
- ファイブフォースの要約
- 買い手の交渉力
- 供給企業の交渉力
- 新規参入業者の脅威
- 代替品の脅威
- 競争の脅威
- 市況
第6章 製品別市場セグメンテーション
- 市場セグメンテーション
- 比較:製品別
- ドライドッグフード:市場規模と予測 2023~2028年
- 犬のおやつとスナック:市場規模と予測 2023~2028年
- ウェットドッグフード:市場規模と予測 2023~2028年
- 製品別の市場機会
第7章 流通チャネル別市場セグメンテーション
- 市場セグメンテーション
- 比較:流通チャネル別
- 小売:市場規模と予測 2023~2028年
- オンライン:市場規模と予測 2023~2028年
- 流通チャネル別の市場機会
第8章 顧客情勢
- 顧客情勢概要
第9章 地域別情勢
- 地域別セグメンテーション
- 比較:地域別
- 北米:市場規模と予測 2023~2028年
- 欧州:市場規模と予測 2023~2028年
- アジア太平洋:市場規模と予測 2023~2028年
- 中東・アフリカ:市場規模と予測 2023~2028年
- 南米:市場規模と予測 2023~2028年
- 米国:市場規模と予測 2023~2028年
- 中国:市場規模と予測 2023~2028年
- 日本:市場規模と予測 2023~2028年
- ブラジル:市場規模と予測 2023~2028年
- フランス:市場規模と予測 2023~2028年
- 地域情勢別の市場機会
第10章 促進要因・課題・機会・抑制要因
- 市場促進要因
- 市場課題
- 促進要因と課題の影響
- 市場機会・抑制要因
第11章 競合情勢
- 概要
- 競合情勢
- 混乱の状況
- 業界のリスク
第12章 競合分析
- 企業プロファイル
- 企業の市場ポジショニング
- Bravo LLC
- Canature Processing Ltd.
- Carnivore Meat Co. LLC
- Champion Petfoods Holding Inc.
- Fresh Is Best
- Grandma Lucys LLC
- Hills Pet Nutrition Inc.
- J RETTENMAIER and SOHNE GmbH and Co KG
- Mars Inc.
- Miracle Pet
- Natural Pet Food Group
- Natures Diet
- Nestle SA
- NRG Plus Ltd.
- Primal Pet Foods Inc.
第13章 付録
Exhibits:
- Exhibits1: Executive Summary - Chart on Market Overview
- Exhibits2: Executive Summary - Data Table on Market Overview
- Exhibits3: Executive Summary - Chart on Global Market Characteristics
- Exhibits4: Executive Summary - Chart on Market By Geographical Landscape
- Exhibits5: Executive Summary - Chart on Market Segmentation by Product
- Exhibits6: Executive Summary - Chart on Market Segmentation by Distribution Channel
- Exhibits7: Executive Summary - Chart on Incremental Growth
- Exhibits8: Executive Summary - Data Table on Incremental Growth
- Exhibits9: Executive Summary - Chart on Company Market Positioning
- Exhibits10: Parent Market
- Exhibits11: Data Table on - Parent Market
- Exhibits12: Market characteristics analysis
- Exhibits13: Value Chain Analysis
- Exhibits14: Offerings of companies included in the market definition
- Exhibits15: Market segments
- Exhibits16: Chart on Global - Market size and forecast 2023-2028 ($ billion)
- Exhibits17: Data Table on Global - Market size and forecast 2023-2028 ($ billion)
- Exhibits18: Chart on Global Market: Year-over-year growth 2023-2028 (%)
- Exhibits19: Data Table on Global Market: Year-over-year growth 2023-2028 (%)
- Exhibits20: Historic Market Size - Data Table on Global Dog Food Market 2018 - 2022 ($ billion)
- Exhibits21: Historic Market Size - Product Segment 2018 - 2022 ($ billion)
- Exhibits22: Historic Market Size - Distribution Channel Segment 2018 - 2022 ($ billion)
- Exhibits23: Historic Market Size - Geography Segment 2018 - 2022 ($ billion)
- Exhibits24: Historic Market Size - Country Segment 2018 - 2022 ($ billion)
- Exhibits25: Five forces analysis - Comparison between 2023 and 2028
- Exhibits26: Bargaining power of buyers - Impact of key factors 2023 and 2028
- Exhibits27: Bargaining power of suppliers - Impact of key factors in 2023 and 2028
- Exhibits28: Threat of new entrants - Impact of key factors in 2023 and 2028
- Exhibits29: Threat of substitutes - Impact of key factors in 2023 and 2028
- Exhibits30: Threat of rivalry - Impact of key factors in 2023 and 2028
- Exhibits31: Chart on Market condition - Five forces 2023 and 2028
- Exhibits32: Chart on Product - Market share 2023-2028 (%)
- Exhibits33: Data Table on Product - Market share 2023-2028 (%)
- Exhibits34: Chart on Comparison by Product
- Exhibits35: Data Table on Comparison by Product
- Exhibits36: Chart on Dry dog food - Market size and forecast 2023-2028 ($ billion)
- Exhibits37: Data Table on Dry dog food - Market size and forecast 2023-2028 ($ billion)
- Exhibits38: Chart on Dry dog food - Year-over-year growth 2023-2028 (%)
- Exhibits39: Data Table on Dry dog food - Year-over-year growth 2023-2028 (%)
- Exhibits40: Chart on Dog treats and snacks - Market size and forecast 2023-2028 ($ billion)
- Exhibits41: Data Table on Dog treats and snacks - Market size and forecast 2023-2028 ($ billion)
- Exhibits42: Chart on Dog treats and snacks - Year-over-year growth 2023-2028 (%)
- Exhibits43: Data Table on Dog treats and snacks - Year-over-year growth 2023-2028 (%)
- Exhibits44: Chart on Wet dog food - Market size and forecast 2023-2028 ($ billion)
- Exhibits45: Data Table on Wet dog food - Market size and forecast 2023-2028 ($ billion)
- Exhibits46: Chart on Wet dog food - Year-over-year growth 2023-2028 (%)
- Exhibits47: Data Table on Wet dog food - Year-over-year growth 2023-2028 (%)
- Exhibits48: Market opportunity by Product ($ billion)
- Exhibits49: Data Table on Market opportunity by Product ($ billion)
- Exhibits50: Chart on Distribution Channel - Market share 2023-2028 (%)
- Exhibits51: Data Table on Distribution Channel - Market share 2023-2028 (%)
- Exhibits52: Chart on Comparison by Distribution Channel
- Exhibits53: Data Table on Comparison by Distribution Channel
- Exhibits54: Chart on Retail - Market size and forecast 2023-2028 ($ billion)
- Exhibits55: Data Table on Retail - Market size and forecast 2023-2028 ($ billion)
- Exhibits56: Chart on Retail - Year-over-year growth 2023-2028 (%)
- Exhibits57: Data Table on Retail - Year-over-year growth 2023-2028 (%)
- Exhibits58: Chart on Online - Market size and forecast 2023-2028 ($ billion)
- Exhibits59: Data Table on Online - Market size and forecast 2023-2028 ($ billion)
- Exhibits60: Chart on Online - Year-over-year growth 2023-2028 (%)
- Exhibits61: Data Table on Online - Year-over-year growth 2023-2028 (%)
- Exhibits62: Market opportunity by Distribution Channel ($ billion)
- Exhibits63: Data Table on Market opportunity by Distribution Channel ($ billion)
- Exhibits64: Analysis of price sensitivity, lifecycle, customer purchase basket, adoption rates, and purchase criteria
- Exhibits65: Chart on Market share By Geographical Landscape 2023-2028 (%)
- Exhibits66: Data Table on Market share By Geographical Landscape 2023-2028 (%)
- Exhibits67: Chart on Geographic comparison
- Exhibits68: Data Table on Geographic comparison
- Exhibits69: Chart on North America - Market size and forecast 2023-2028 ($ billion)
- Exhibits70: Data Table on North America - Market size and forecast 2023-2028 ($ billion)
- Exhibits71: Chart on North America - Year-over-year growth 2023-2028 (%)
- Exhibits72: Data Table on North America - Year-over-year growth 2023-2028 (%)
- Exhibits73: Chart on Europe - Market size and forecast 2023-2028 ($ billion)
- Exhibits74: Data Table on Europe - Market size and forecast 2023-2028 ($ billion)
- Exhibits75: Chart on Europe - Year-over-year growth 2023-2028 (%)
- Exhibits76: Data Table on Europe - Year-over-year growth 2023-2028 (%)
- Exhibits77: Chart on APAC - Market size and forecast 2023-2028 ($ billion)
- Exhibits78: Data Table on APAC - Market size and forecast 2023-2028 ($ billion)
- Exhibits79: Chart on APAC - Year-over-year growth 2023-2028 (%)
- Exhibits80: Data Table on APAC - Year-over-year growth 2023-2028 (%)
- Exhibits81: Chart on Middle East and Africa - Market size and forecast 2023-2028 ($ billion)
- Exhibits82: Data Table on Middle East and Africa - Market size and forecast 2023-2028 ($ billion)
- Exhibits83: Chart on Middle East and Africa - Year-over-year growth 2023-2028 (%)
- Exhibits84: Data Table on Middle East and Africa - Year-over-year growth 2023-2028 (%)
- Exhibits85: Chart on South America - Market size and forecast 2023-2028 ($ billion)
- Exhibits86: Data Table on South America - Market size and forecast 2023-2028 ($ billion)
- Exhibits87: Chart on South America - Year-over-year growth 2023-2028 (%)
- Exhibits88: Data Table on South America - Year-over-year growth 2023-2028 (%)
- Exhibits89: Chart on US - Market size and forecast 2023-2028 ($ billion)
- Exhibits90: Data Table on US - Market size and forecast 2023-2028 ($ billion)
- Exhibits91: Chart on US - Year-over-year growth 2023-2028 (%)
- Exhibits92: Data Table on US - Year-over-year growth 2023-2028 (%)
- Exhibits93: Chart on China - Market size and forecast 2023-2028 ($ billion)
- Exhibits94: Data Table on China - Market size and forecast 2023-2028 ($ billion)
- Exhibits95: Chart on China - Year-over-year growth 2023-2028 (%)
- Exhibits96: Data Table on China - Year-over-year growth 2023-2028 (%)
- Exhibits97: Chart on Japan - Market size and forecast 2023-2028 ($ billion)
- Exhibits98: Data Table on Japan - Market size and forecast 2023-2028 ($ billion)
- Exhibits99: Chart on Japan - Year-over-year growth 2023-2028 (%)
- Exhibits100: Data Table on Japan - Year-over-year growth 2023-2028 (%)
- Exhibits101: Chart on Brazil - Market size and forecast 2023-2028 ($ billion)
- Exhibits102: Data Table on Brazil - Market size and forecast 2023-2028 ($ billion)
- Exhibits103: Chart on Brazil - Year-over-year growth 2023-2028 (%)
- Exhibits104: Data Table on Brazil - Year-over-year growth 2023-2028 (%)
- Exhibits105: Chart on France - Market size and forecast 2023-2028 ($ billion)
- Exhibits106: Data Table on France - Market size and forecast 2023-2028 ($ billion)
- Exhibits107: Chart on France - Year-over-year growth 2023-2028 (%)
- Exhibits108: Data Table on France - Year-over-year growth 2023-2028 (%)
- Exhibits109: Market opportunity By Geographical Landscape ($ billion)
- Exhibits110: Data Tables on Market opportunity By Geographical Landscape ($ billion)
- Exhibits111: Impact of drivers and challenges in 2023 and 2028
- Exhibits112: Overview on criticality of inputs and factors of differentiation
- Exhibits113: Overview on factors of disruption
- Exhibits114: Impact of key risks on business
- Exhibits115: Companies covered
- Exhibits116: Matrix on companies position and classification
- Exhibits117: Bravo LLC - Overview
- Exhibits118: Bravo LLC - Product / Service
- Exhibits119: Bravo LLC - Key offerings
- Exhibits120: Canature Processing Ltd. - Overview
- Exhibits121: Canature Processing Ltd. - Product / Service
- Exhibits122: Canature Processing Ltd. - Key offerings
- Exhibits123: Carnivore Meat Co. LLC - Overview
- Exhibits124: Carnivore Meat Co. LLC - Product / Service
- Exhibits125: Carnivore Meat Co. LLC - Key news
- Exhibits126: Carnivore Meat Co. LLC - Key offerings
- Exhibits127: Champion Petfoods Holding Inc. - Overview
- Exhibits128: Champion Petfoods Holding Inc. - Product / Service
- Exhibits129: Champion Petfoods Holding Inc. - Key offerings
- Exhibits130: Fresh Is Best - Overview
- Exhibits131: Fresh Is Best - Product / Service
- Exhibits132: Fresh Is Best - Key offerings
- Exhibits133: Grandma Lucys LLC - Overview
- Exhibits134: Grandma Lucys LLC - Product / Service
- Exhibits135: Grandma Lucys LLC - Key offerings
- Exhibits136: Hills Pet Nutrition Inc. - Overview
- Exhibits137: Hills Pet Nutrition Inc. - Product / Service
- Exhibits138: Hills Pet Nutrition Inc. - Key offerings
- Exhibits139: J RETTENMAIER and SOHNE GmbH and Co KG - Overview
- Exhibits140: J RETTENMAIER and SOHNE GmbH and Co KG - Product / Service
- Exhibits141: J RETTENMAIER and SOHNE GmbH and Co KG - Key offerings
- Exhibits142: Mars Inc. - Overview
- Exhibits143: Mars Inc. - Product / Service
- Exhibits144: Mars Inc. - Key news
- Exhibits145: Mars Inc. - Key offerings
- Exhibits146: Miracle Pet - Overview
- Exhibits147: Miracle Pet - Product / Service
- Exhibits148: Miracle Pet - Key offerings
- Exhibits149: Natural Pet Food Group - Overview
- Exhibits150: Natural Pet Food Group - Product / Service
- Exhibits151: Natural Pet Food Group - Key offerings
- Exhibits152: Natures Diet - Overview
- Exhibits153: Natures Diet - Product / Service
- Exhibits154: Natures Diet - Key offerings
- Exhibits155: Nestle SA - Overview
- Exhibits156: Nestle SA - Business segments
- Exhibits157: Nestle SA - Key news
- Exhibits158: Nestle SA - Key offerings
- Exhibits159: Nestle SA - Segment focus
- Exhibits160: NRG Plus Ltd. - Overview
- Exhibits161: NRG Plus Ltd. - Product / Service
- Exhibits162: NRG Plus Ltd. - Key offerings
- Exhibits163: Primal Pet Foods Inc. - Overview
- Exhibits164: Primal Pet Foods Inc. - Product / Service
- Exhibits165: Primal Pet Foods Inc. - Key offerings
- Exhibits166: Inclusions checklist
- Exhibits167: Exclusions checklist
- Exhibits168: Currency conversion rates for US$
- Exhibits169: Research methodology
- Exhibits170: Information sources
- Exhibits171: Data validation
- Exhibits172: Validation techniques employed for market sizing
- Exhibits173: Data synthesis
- Exhibits174: 360 degree market analysis
- Exhibits175: List of abbreviations
The dog food market is forecasted to grow by USD 16.1 bn during 2023-2028, accelerating at a CAGR of 4.39% during the forecast period. The report on the dog food market provides a holistic analysis, market size and forecast, trends, growth drivers, and challenges, as well as vendor analysis covering around 25 vendors.
The report offers an up-to-date analysis regarding the current market scenario, the latest trends and drivers, and the overall market environment. The market is driven by increasing pet health awareness, increasing focus on health and wellness of pets, and marketing campaigns and packaging innovations.
Technavio's dog food market is segmented as below:
| Market Scope | |
|---|---|
| Base Year | 2024 |
| End Year | 2028 |
| Series Year | 2024-2028 |
| Growth Momentum | Accelerate |
| YOY 2024 | 4.17% |
| CAGR | 4.39% |
| Incremental Value | $16.1 bn |
By Product
- Dry dog food
- Dog treats and snacks
- Wet dog food
By Distribution Channel
- Retail
- Online
By Geographical Landscape
- North America
- Europe
- APAC
- Middle East and Africa
- South America
This study identifies the pet adoption and humanization as one of the prime reasons driving the dog food market growth during the next few years. Also, increasing demand for organic dog food and omnichannel retailing will lead to sizable demand in the market.
The report on the dog food market covers the following areas:
- Dog food market sizing
- Dog food market forecast
- Dog food market industry analysis
The robust vendor analysis is designed to help clients improve their market position, and in line with this, this report provides a detailed analysis of several leading dog food market vendors that include Bravo LLC, Canature Processing Ltd., Carnivore Meat Co. LLC, Champion Petfoods Holding Inc., Fresh Is Best, Grandma Lucys LLC, Hills Pet Nutrition Inc., J RETTENMAIER and SOHNE GmbH and Co KG, Mars Inc., Miracle Pet, Natural Pet Food Group, Natures Diet, Nestle SA, NRG Plus Ltd., Primal Pet Foods Inc., SCHELL and KAMPETER Inc., Stella and Chewys LLC, Steves Real Food, The J.M Smucker Co., and Wellness Pet Co. Inc.. Also, the dog food market analysis report includes information on upcoming trends and challenges that will influence market growth. This is to help companies strategize and leverage all forthcoming growth opportunities.
The study was conducted using an objective combination of primary and secondary information including inputs from key participants in the industry. The report contains a comprehensive market and vendor landscape in addition to an analysis of the key vendors.
The publisher presents a detailed picture of the market by the way of study, synthesis, and summation of data from multiple sources by an analysis of key parameters such as profit, pricing, competition, and promotions. It presents various market facets by identifying the key industry influencers. The data presented is comprehensive, reliable, and a result of extensive research - both primary and secondary. The market research reports provide a complete competitive landscape and an in-depth vendor selection methodology and analysis using qualitative and quantitative research to forecast the accurate market growth.
Table of Contents
1 Executive Summary
- 1.1 Market overview
- Executive Summary - Chart on Market Overview
- Executive Summary - Data Table on Market Overview
- Executive Summary - Chart on Global Market Characteristics
- Executive Summary - Chart on Market By Geographical Landscape
- Executive Summary - Chart on Market Segmentation by Product
- Executive Summary - Chart on Market Segmentation by Distribution Channel
- Executive Summary - Chart on Incremental Growth
- Executive Summary - Data Table on Incremental Growth
- Executive Summary - Chart on Company Market Positioning
2 Market Landscape
- 2.1 Market ecosystem
- Parent Market
- Data Table on - Parent Market
- 2.2 Market characteristics
- Market characteristics analysis
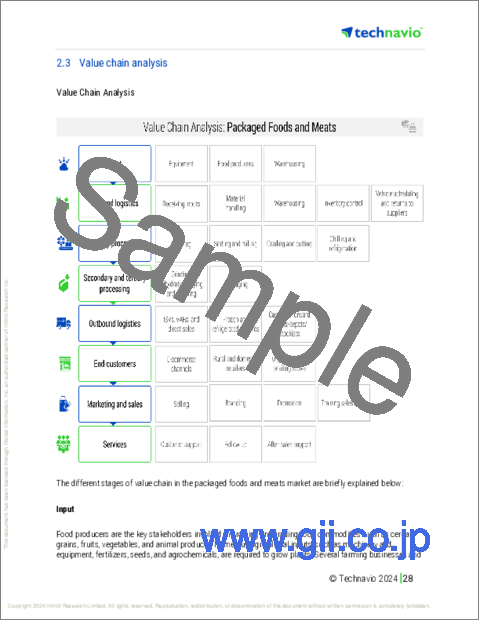
- 2.3 Value chain analysis
- Value Chain Analysis
3 Market Sizing
- 3.1 Market definition
- Offerings of companies included in the market definition
- 3.2 Market segment analysis
- Market segments
- 3.3 Market size 2023
- 3.4 Market outlook: Forecast for 2023-2028
- Chart on Global - Market size and forecast 2023-2028 ($ billion)
- Data Table on Global - Market size and forecast 2023-2028 ($ billion)
- Chart on Global Market: Year-over-year growth 2023-2028 (%)
- Data Table on Global Market: Year-over-year growth 2023-2028 (%)
4 Historic Market Size
- 4.1 Global Dog Food Market 2018 - 2022
- Historic Market Size - Data Table on Global Dog Food Market 2018 - 2022 ($ billion)
- 4.2 Product segment analysis 2018 - 2022
- Historic Market Size - Product Segment 2018 - 2022 ($ billion)
- 4.3 Distribution Channel segment analysis 2018 - 2022
- Historic Market Size - Distribution Channel Segment 2018 - 2022 ($ billion)
- 4.4 Geography segment analysis 2018 - 2022
- Historic Market Size - Geography Segment 2018 - 2022 ($ billion)
- 4.5 Country segment analysis 2018 - 2022
- Historic Market Size - Country Segment 2018 - 2022 ($ billion)
5 Five Forces Analysis
- 5.1 Five forces summary
- Five forces analysis - Comparison between 2023 and 2028
- 5.2 Bargaining power of buyers
- Bargaining power of buyers - Impact of key factors 2023 and 2028
- 5.3 Bargaining power of suppliers
- Bargaining power of suppliers - Impact of key factors in 2023 and 2028
- 5.4 Threat of new entrants
- Threat of new entrants - Impact of key factors in 2023 and 2028
- 5.5 Threat of substitutes
- Threat of substitutes - Impact of key factors in 2023 and 2028
- 5.6 Threat of rivalry
- Threat of rivalry - Impact of key factors in 2023 and 2028
- 5.7 Market condition
- Chart on Market condition - Five forces 2023 and 2028
6 Market Segmentation by Product
- 6.1 Market segments
- Chart on Product - Market share 2023-2028 (%)
- Data Table on Product - Market share 2023-2028 (%)
- 6.2 Comparison by Product
- Chart on Comparison by Product
- Data Table on Comparison by Product
- 6.3 Dry dog food - Market size and forecast 2023-2028
- Chart on Dry dog food - Market size and forecast 2023-2028 ($ billion)
- Data Table on Dry dog food - Market size and forecast 2023-2028 ($ billion)
- Chart on Dry dog food - Year-over-year growth 2023-2028 (%)
- Data Table on Dry dog food - Year-over-year growth 2023-2028 (%)
- 6.4 Dog treats and snacks - Market size and forecast 2023-2028
- Chart on Dog treats and snacks - Market size and forecast 2023-2028 ($ billion)
- Data Table on Dog treats and snacks - Market size and forecast 2023-2028 ($ billion)
- Chart on Dog treats and snacks - Year-over-year growth 2023-2028 (%)
- Data Table on Dog treats and snacks - Year-over-year growth 2023-2028 (%)
- 6.5 Wet dog food - Market size and forecast 2023-2028
- Chart on Wet dog food - Market size and forecast 2023-2028 ($ billion)
- Data Table on Wet dog food - Market size and forecast 2023-2028 ($ billion)
- Chart on Wet dog food - Year-over-year growth 2023-2028 (%)
- Data Table on Wet dog food - Year-over-year growth 2023-2028 (%)
- 6.6 Market opportunity by Product
- Market opportunity by Product ($ billion)
- Data Table on Market opportunity by Product ($ billion)
7 Market Segmentation by Distribution Channel
- 7.1 Market segments
- Chart on Distribution Channel - Market share 2023-2028 (%)
- Data Table on Distribution Channel - Market share 2023-2028 (%)
- 7.2 Comparison by Distribution Channel
- Chart on Comparison by Distribution Channel
- Data Table on Comparison by Distribution Channel
- 7.3 Retail - Market size and forecast 2023-2028
- Chart on Retail - Market size and forecast 2023-2028 ($ billion)
- Data Table on Retail - Market size and forecast 2023-2028 ($ billion)
- Chart on Retail - Year-over-year growth 2023-2028 (%)
- Data Table on Retail - Year-over-year growth 2023-2028 (%)
- 7.4 Online - Market size and forecast 2023-2028
- Chart on Online - Market size and forecast 2023-2028 ($ billion)
- Data Table on Online - Market size and forecast 2023-2028 ($ billion)
- Chart on Online - Year-over-year growth 2023-2028 (%)
- Data Table on Online - Year-over-year growth 2023-2028 (%)
- 7.5 Market opportunity by Distribution Channel
- Market opportunity by Distribution Channel ($ billion)
- Data Table on Market opportunity by Distribution Channel ($ billion)
8 Customer Landscape
- 8.1 Customer landscape overview
- Analysis of price sensitivity, lifecycle, customer purchase basket, adoption rates, and purchase criteria
9 Geographic Landscape
- 9.1 Geographic segmentation
- Chart on Market share By Geographical Landscape 2023-2028 (%)
- Data Table on Market share By Geographical Landscape 2023-2028 (%)
- 9.2 Geographic comparison
- Chart on Geographic comparison
- Data Table on Geographic comparison
- 9.3 North America - Market size and forecast 2023-2028
- Chart on North America - Market size and forecast 2023-2028 ($ billion)
- Data Table on North America - Market size and forecast 2023-2028 ($ billion)
- Chart on North America - Year-over-year growth 2023-2028 (%)
- Data Table on North America - Year-over-year growth 2023-2028 (%)
- 9.4 Europe - Market size and forecast 2023-2028
- Chart on Europe - Market size and forecast 2023-2028 ($ billion)
- Data Table on Europe - Market size and forecast 2023-2028 ($ billion)
- Chart on Europe - Year-over-year growth 2023-2028 (%)
- Data Table on Europe - Year-over-year growth 2023-2028 (%)
- 9.5 APAC - Market size and forecast 2023-2028
- Chart on APAC - Market size and forecast 2023-2028 ($ billion)
- Data Table on APAC - Market size and forecast 2023-2028 ($ billion)
- Chart on APAC - Year-over-year growth 2023-2028 (%)
- Data Table on APAC - Year-over-year growth 2023-2028 (%)
- 9.6 Middle East and Africa - Market size and forecast 2023-2028
- Chart on Middle East and Africa - Market size and forecast 2023-2028 ($ billion)
- Data Table on Middle East and Africa - Market size and forecast 2023-2028 ($ billion)
- Chart on Middle East and Africa - Year-over-year growth 2023-2028 (%)
- Data Table on Middle East and Africa - Year-over-year growth 2023-2028 (%)
- 9.7 South America - Market size and forecast 2023-2028
- Chart on South America - Market size and forecast 2023-2028 ($ billion)
- Data Table on South America - Market size and forecast 2023-2028 ($ billion)
- Chart on South America - Year-over-year growth 2023-2028 (%)
- Data Table on South America - Year-over-year growth 2023-2028 (%)
- 9.8 US - Market size and forecast 2023-2028
- Chart on US - Market size and forecast 2023-2028 ($ billion)
- Data Table on US - Market size and forecast 2023-2028 ($ billion)
- Chart on US - Year-over-year growth 2023-2028 (%)
- Data Table on US - Year-over-year growth 2023-2028 (%)
- 9.9 China - Market size and forecast 2023-2028
- Chart on China - Market size and forecast 2023-2028 ($ billion)
- Data Table on China - Market size and forecast 2023-2028 ($ billion)
- Chart on China - Year-over-year growth 2023-2028 (%)
- Data Table on China - Year-over-year growth 2023-2028 (%)
- 9.10 Japan - Market size and forecast 2023-2028
- Chart on Japan - Market size and forecast 2023-2028 ($ billion)
- Data Table on Japan - Market size and forecast 2023-2028 ($ billion)
- Chart on Japan - Year-over-year growth 2023-2028 (%)
- Data Table on Japan - Year-over-year growth 2023-2028 (%)
- 9.11 Brazil - Market size and forecast 2023-2028
- Chart on Brazil - Market size and forecast 2023-2028 ($ billion)
- Data Table on Brazil - Market size and forecast 2023-2028 ($ billion)
- Chart on Brazil - Year-over-year growth 2023-2028 (%)
- Data Table on Brazil - Year-over-year growth 2023-2028 (%)
- 9.12 France - Market size and forecast 2023-2028
- Chart on France - Market size and forecast 2023-2028 ($ billion)
- Data Table on France - Market size and forecast 2023-2028 ($ billion)
- Chart on France - Year-over-year growth 2023-2028 (%)
- Data Table on France - Year-over-year growth 2023-2028 (%)
- 9.13 Market opportunity By Geographical Landscape
- Market opportunity By Geographical Landscape ($ billion)
- Data Tables on Market opportunity By Geographical Landscape ($ billion)
10 Drivers, Challenges, and Opportunity/Restraints
- 10.1 Market drivers
- 10.2 Market challenges
- 10.3 Impact of drivers and challenges
- Impact of drivers and challenges in 2023 and 2028
- 10.4 Market opportunities/restraints
11 Competitive Landscape
- 11.1 Overview
- 11.2 Competitive Landscape
- Overview on criticality of inputs and factors of differentiation
- 11.3 Landscape disruption
- Overview on factors of disruption
- 11.4 Industry risks
- Impact of key risks on business
12 Competitive Analysis
- 12.1 Companies profiled
- Companies covered
- 12.2 Market positioning of companies
- Matrix on companies position and classification
- 12.3 Bravo LLC
- Bravo LLC - Overview
- Bravo LLC - Product / Service
- Bravo LLC - Key offerings
- 12.4 Canature Processing Ltd.
- Canature Processing Ltd. - Overview
- Canature Processing Ltd. - Product / Service
- Canature Processing Ltd. - Key offerings
- 12.5 Carnivore Meat Co. LLC
- Carnivore Meat Co. LLC - Overview
- Carnivore Meat Co. LLC - Product / Service
- Carnivore Meat Co. LLC - Key news
- Carnivore Meat Co. LLC - Key offerings
- 12.6 Champion Petfoods Holding Inc.
- Champion Petfoods Holding Inc. - Overview
- Champion Petfoods Holding Inc. - Product / Service
- Champion Petfoods Holding Inc. - Key offerings
- 12.7 Fresh Is Best
- Fresh Is Best - Overview
- Fresh Is Best - Product / Service
- Fresh Is Best - Key offerings
- 12.8 Grandma Lucys LLC
- Grandma Lucys LLC - Overview
- Grandma Lucys LLC - Product / Service
- Grandma Lucys LLC - Key offerings
- 12.9 Hills Pet Nutrition Inc.
- Hills Pet Nutrition Inc. - Overview
- Hills Pet Nutrition Inc. - Product / Service
- Hills Pet Nutrition Inc. - Key offerings
- 12.10 J RETTENMAIER and SOHNE GmbH and Co KG
- J RETTENMAIER and SOHNE GmbH and Co KG - Overview
- J RETTENMAIER and SOHNE GmbH and Co KG - Product / Service
- J RETTENMAIER and SOHNE GmbH and Co KG - Key offerings
- 12.11 Mars Inc.
- Mars Inc. - Overview
- Mars Inc. - Product / Service
- Mars Inc. - Key news
- Mars Inc. - Key offerings
- 12.12 Miracle Pet
- Miracle Pet - Overview
- Miracle Pet - Product / Service
- Miracle Pet - Key offerings
- 12.13 Natural Pet Food Group
- Natural Pet Food Group - Overview
- Natural Pet Food Group - Product / Service
- Natural Pet Food Group - Key offerings
- 12.14 Natures Diet
- Natures Diet - Overview
- Natures Diet - Product / Service
- Natures Diet - Key offerings
- 12.15 Nestle SA
- Nestle SA - Overview
- Nestle SA - Business segments
- Nestle SA - Key news
- Nestle SA - Key offerings
- Nestle SA - Segment focus
- 12.16 NRG Plus Ltd.
- NRG Plus Ltd. - Overview
- NRG Plus Ltd. - Product / Service
- NRG Plus Ltd. - Key offerings
- 12.17 Primal Pet Foods Inc.
- Primal Pet Foods Inc. - Overview
- Primal Pet Foods Inc. - Product / Service
- Primal Pet Foods Inc. - Key offerings
13 Appendix
- 13.1 Scope of the report
- 13.2 Inclusions and exclusions checklist
- Inclusions checklist
- Exclusions checklist
- 13.3 Currency conversion rates for US$
- Currency conversion rates for US$
- 13.4 Research methodology
- Research methodology
- 13.5 Data procurement
- Information sources
- 13.6 Data validation
- Data validation
- 13.7 Validation techniques employed for market sizing
- Validation techniques employed for market sizing
- 13.8 Data synthesis
- Data synthesis
- 13.9 360 degree market analysis
- 360 degree market analysis
- 13.10 List of abbreviations
- List of abbreviations

