
|
市場調査レポート
商品コード
1365733
ピープロテイン市場:用途別、タイプ別、形態別:世界の機会分析と産業予測、2023~2032年Pea Protein Market By Application, By Type, By Form : Global Opportunity Analysis and Industry Forecast, 2023-2032 |
||||||
|
|||||||

| ピープロテイン市場:用途別、タイプ別、形態別:世界の機会分析と産業予測、2023~2032年 |
|
出版日: 2023年08月01日
発行: Allied Market Research
ページ情報: 英文 300 Pages
納期: 2~3営業日
|

- 全表示
- 概要
- 図表
- 目次
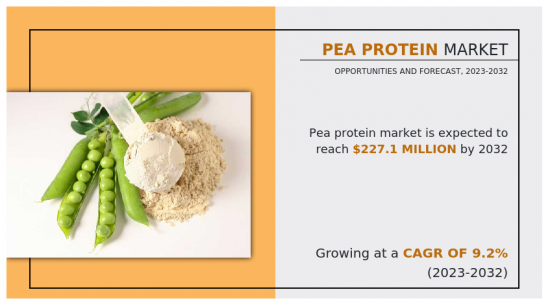
ピープロテインの市場規模は、2022年に9,460万米ドルとなり、2023年から2032年にかけてCAGR 9.2%で成長し、2032年には2億2,710万米ドルに達すると推定されます。
ピープロテインは、黄色いエンドウ豆から生産される乳糖植物性タンパク質です。ピープロテイン単離物、ピープロテイン濃縮物、テクスチャー加工ピープロテインが市場で入手可能なタンパク質の種類です。ピープロテインは、ベジタリアンや乳糖不耐症の人々にとって重要な代替タンパク源です。ピープロテインは、大豆、アーモンド、ピーナッツなど、一部の人にアレルギー反応を引き起こしやすい代替タンパク源の代わりに使用されています。ピープロテインは、高タンパク質濃度と必要なアミノ酸を提供し、その結果、カルシウムの循環と吸収の促進、筋肉の保護、代謝の増加、血糖値の管理など、多くの好ましい健康上の利点をもたらします。
健康に対する知識が深まるにつれ、人々の食習慣も変化しています。消費者は、消化に安全で、環境に優しく、健康的で、病気、水分の損失、ガス、けいれん、食欲不振、疲労、頭痛などの不調を軽減してくれる製品を求めており、ピープロテインは、副作用のない適切なタンパク質源であるため、彼らの要求に合っています。グルテンや乳製品に不耐症やアレルギーのある人も、ピープロテインは栄養源として適しています。さらに、大豆、卵、乳清、カゼインなどの他のプロテインパウダーとは異なり、吸収が良く、腹部膨満感を起こしません。ピープロテインは栄養価が高いため、高齢者、ベジタリアン、乳糖抜きダイエット、子供の栄養補給に理想的で、需要を押し上げています。結果として、これらすべての要因が市場の成長に寄与しています。
世界の消費者は、1日に必要なタンパク質を満たすために、肉、チーズ、乳製品、鶏肉などの動物由来のタンパク源に頼っています。動物由来のタンパク質は、植物由来のタンパク質よりも多くのタンパク質で構成されており、冠動脈疾患、過体重や肥満、糖尿病などの深刻な健康問題の原因となっています。ピープロテイン産業は、消費者の健康志向の高まり、ピープロテイン摂取による健康上の利点、植物性タンパク質の代替品に対する需要の高まりにより、過去10年間で拡大してきました。国際食品情報評議会(IFIC)の調査/研究によると、2022年には米国社会の28%が植物性タンパク質の栄養学的関連性を認識し、69%が植物性タンパク質は栄養学的利益を助けると考えていました。
さらに、他の種類のタンパク質と比較して、植物から作られたタンパク質は手頃な価格であることや、様々な健康上の利点があることから、近年顧客からの需要が増加しており、市場の成長を後押ししています。高タンパク食への今後の動向、健康意識の高まり、経済成長、都市化、菜食主義者の人口増加などはすべて、食品における植物性タンパク質の利用の増加を示しています。顧客の嗜好の変化に対応するため、食品業界は、ホエイタンパク、カゼイン、ゼラチン、オバルブミン、グルテンベースのタンパク質など、動物由来のタンパク質に代わる、より低コストで健康的なタンパク質成分の探求を続けています。ピープロテインは、そのニュートラルな風味と通常のアミノ酸構成により、食品業界では実現可能な選択肢です。さらに、ピープロテインの顕著な乳化特性は、水と脂肪の両方を結合して安定した乳化を実現するため、食肉製品の食感改良成分として使用されています。近年、食品メーカーは栄養価を高めるためにピープロテインを食品に使用しています。朝食用シリアル、栄養補助食品、焼いたセイボリー、プロテインパウダー、すぐに飲めるミール代替飲料、植物由来の肉などが、ピープロテイン分離物が使用される食品のタイプです。F&B産業の拡大、先進市場におけるタンパク質ベースのソリューションの革新のイントロダクションが、世界市場の需要を促進しています。
目次
第1章 イントロダクション
第2章 エグゼクティブサマリー
第3章 市場概要
- 市場の定義と範囲
- 主な調査結果
- 影響要因
- 主な投資機会
- ポーターのファイブフォース分析
- 市場力学
- 促進要因
- ピープロテインの高い栄養プロファイル
- 菜食主義者からの植物性タンパク質に対する高い需要
- 飲食品業界の安定した成長
- 抑制要因
- 他のタンパク質の市場浸透率の増加
- ピープロテイン製品における製剤上の課題
- ピープロテインベースの製品に対する消費者の認知度の低さ
- 機会
- ピープロテインをベースとしたスポーツ栄養および体重管理製品に対する需要の急増
- ペットフードの代替タンパク源としてのピープロテイン
- 促進要因
- COVID-19市場への影響分析
第4章 ピープロテイン市場:用途別
- 概要
- 栄養補助食品
- ベーカリー・菓子類
- 肉製品および代替品
- 飲料
- その他
第5章 ピープロテイン市場:タイプ別
- 概要
- 分離ピープロテイン
- 濃縮ピープロテイン
- テクスチャー加工ピープロテイン
第6章 ピープロテイン市場:形態別
- 概要
- 乾燥乾燥
- 液体
第7章 ピープロテイン市場:地域別
- 概要
- 北米
- 米国
- カナダ
- メキシコ
- 欧州
- ドイツ
- 英国
- フランス
- イタリア
- スペイン
- スイス
- その他
- アジア太平洋
- 中国
- インド
- 日本
- 韓国
- オーストラリア
- その他
- ラテンアメリカ・中東・アフリカ
- ブラジル
- 南アフリカ
- アラブ首長国連邦
- その他
第8章 競争情勢
- イントロダクション
- 主要成功戦略
- 主要10社の製品マッピング
- 競合ダッシュボード
- 競合ヒートマップ
- 主要企業のポジショニング、2022年
第9章 企業プロファイル
- A&B Ingredients, Inc.
- Roquette Freres S.A.
- Burcon Nutrascience Corporation.
- Cosucra
- Glanbia PLC
- The Green Labs, LLC.
- GEMEF Industries
- Axiom Foods, Inc.
- Puris
- Yantai Shuangta Food Co., Ltd.
LIST OF TABLES
- TABLE 01. GLOBAL PEA PROTEIN MARKET, BY APPLICATION, 2022-2032 ($MILLION)
- TABLE 02. PEA PROTEIN MARKET FOR DIETARY SUPPLEMENT, BY REGION, 2022-2032 ($MILLION)
- TABLE 03. PEA PROTEIN MARKET FOR BAKERY AND CONFECTIONERY GOOD, BY REGION, 2022-2032 ($MILLION)
- TABLE 04. PEA PROTEIN MARKET FOR MEAT PRODUCTS AND ALTERNATIVE, BY REGION, 2022-2032 ($MILLION)
- TABLE 05. PEA PROTEIN MARKET FOR BEVERAGE, BY REGION, 2022-2032 ($MILLION)
- TABLE 06. PEA PROTEIN MARKET FOR OTHERS, BY REGION, 2022-2032 ($MILLION)
- TABLE 07. GLOBAL PEA PROTEIN MARKET, BY TYPE, 2022-2032 ($MILLION)
- TABLE 08. PEA PROTEIN MARKET FOR PEA PROTEIN ISOLATE, BY REGION, 2022-2032 ($MILLION)
- TABLE 09. PEA PROTEIN MARKET FOR PEA PROTEIN CONCENTRATE, BY REGION, 2022-2032 ($MILLION)
- TABLE 10. PEA PROTEIN MARKET FOR TEXTURED PEA PROTEIN, BY REGION, 2022-2032 ($MILLION)
- TABLE 11. GLOBAL PEA PROTEIN MARKET, BY FORM, 2022-2032 ($MILLION)
- TABLE 12. PEA PROTEIN MARKET FOR DRY, BY REGION, 2022-2032 ($MILLION)
- TABLE 13. PEA PROTEIN MARKET FOR LIQUID, BY REGION, 2022-2032 ($MILLION)
- TABLE 14. PEA PROTEIN MARKET, BY REGION, 2022-2032 ($MILLION)
- TABLE 15. NORTH AMERICA PEA PROTEIN MARKET, BY APPLICATION, 2022-2032 ($MILLION)
- TABLE 16. NORTH AMERICA PEA PROTEIN MARKET, BY TYPE, 2022-2032 ($MILLION)
- TABLE 17. NORTH AMERICA PEA PROTEIN MARKET, BY FORM, 2022-2032 ($MILLION)
- TABLE 18. NORTH AMERICA PEA PROTEIN MARKET, BY COUNTRY, 2022-2032 ($MILLION)
- TABLE 19. U.S. PEA PROTEIN MARKET, BY APPLICATION, 2022-2032 ($MILLION)
- TABLE 20. U.S. PEA PROTEIN MARKET, BY TYPE, 2022-2032 ($MILLION)
- TABLE 21. U.S. PEA PROTEIN MARKET, BY FORM, 2022-2032 ($MILLION)
- TABLE 22. CANADA PEA PROTEIN MARKET, BY APPLICATION, 2022-2032 ($MILLION)
- TABLE 23. CANADA PEA PROTEIN MARKET, BY TYPE, 2022-2032 ($MILLION)
- TABLE 24. CANADA PEA PROTEIN MARKET, BY FORM, 2022-2032 ($MILLION)
- TABLE 25. MEXICO PEA PROTEIN MARKET, BY APPLICATION, 2022-2032 ($MILLION)
- TABLE 26. MEXICO PEA PROTEIN MARKET, BY TYPE, 2022-2032 ($MILLION)
- TABLE 27. MEXICO PEA PROTEIN MARKET, BY FORM, 2022-2032 ($MILLION)
- TABLE 28. EUROPE PEA PROTEIN MARKET, BY APPLICATION, 2022-2032 ($MILLION)
- TABLE 29. EUROPE PEA PROTEIN MARKET, BY TYPE, 2022-2032 ($MILLION)
- TABLE 30. EUROPE PEA PROTEIN MARKET, BY FORM, 2022-2032 ($MILLION)
- TABLE 31. EUROPE PEA PROTEIN MARKET, BY COUNTRY, 2022-2032 ($MILLION)
- TABLE 32. GERMANY PEA PROTEIN MARKET, BY APPLICATION, 2022-2032 ($MILLION)
- TABLE 33. GERMANY PEA PROTEIN MARKET, BY TYPE, 2022-2032 ($MILLION)
- TABLE 34. GERMANY PEA PROTEIN MARKET, BY FORM, 2022-2032 ($MILLION)
- TABLE 35. UK PEA PROTEIN MARKET, BY APPLICATION, 2022-2032 ($MILLION)
- TABLE 36. UK PEA PROTEIN MARKET, BY TYPE, 2022-2032 ($MILLION)
- TABLE 37. UK PEA PROTEIN MARKET, BY FORM, 2022-2032 ($MILLION)
- TABLE 38. FRANCE PEA PROTEIN MARKET, BY APPLICATION, 2022-2032 ($MILLION)
- TABLE 39. FRANCE PEA PROTEIN MARKET, BY TYPE, 2022-2032 ($MILLION)
- TABLE 40. FRANCE PEA PROTEIN MARKET, BY FORM, 2022-2032 ($MILLION)
- TABLE 41. ITALY PEA PROTEIN MARKET, BY APPLICATION, 2022-2032 ($MILLION)
- TABLE 42. ITALY PEA PROTEIN MARKET, BY TYPE, 2022-2032 ($MILLION)
- TABLE 43. ITALY PEA PROTEIN MARKET, BY FORM, 2022-2032 ($MILLION)
- TABLE 44. SPAIN PEA PROTEIN MARKET, BY APPLICATION, 2022-2032 ($MILLION)
- TABLE 45. SPAIN PEA PROTEIN MARKET, BY TYPE, 2022-2032 ($MILLION)
- TABLE 46. SPAIN PEA PROTEIN MARKET, BY FORM, 2022-2032 ($MILLION)
- TABLE 47. SWITZERLAND PEA PROTEIN MARKET, BY APPLICATION, 2022-2032 ($MILLION)
- TABLE 48. SWITZERLAND PEA PROTEIN MARKET, BY TYPE, 2022-2032 ($MILLION)
- TABLE 49. SWITZERLAND PEA PROTEIN MARKET, BY FORM, 2022-2032 ($MILLION)
- TABLE 50. REST OF EUROPE PEA PROTEIN MARKET, BY APPLICATION, 2022-2032 ($MILLION)
- TABLE 51. REST OF EUROPE PEA PROTEIN MARKET, BY TYPE, 2022-2032 ($MILLION)
- TABLE 52. REST OF EUROPE PEA PROTEIN MARKET, BY FORM, 2022-2032 ($MILLION)
- TABLE 53. ASIA-PACIFIC PEA PROTEIN MARKET, BY APPLICATION, 2022-2032 ($MILLION)
- TABLE 54. ASIA-PACIFIC PEA PROTEIN MARKET, BY TYPE, 2022-2032 ($MILLION)
- TABLE 55. ASIA-PACIFIC PEA PROTEIN MARKET, BY FORM, 2022-2032 ($MILLION)
- TABLE 56. ASIA-PACIFIC PEA PROTEIN MARKET, BY COUNTRY, 2022-2032 ($MILLION)
- TABLE 57. CHINA PEA PROTEIN MARKET, BY APPLICATION, 2022-2032 ($MILLION)
- TABLE 58. CHINA PEA PROTEIN MARKET, BY TYPE, 2022-2032 ($MILLION)
- TABLE 59. CHINA PEA PROTEIN MARKET, BY FORM, 2022-2032 ($MILLION)
- TABLE 60. INDIA PEA PROTEIN MARKET, BY APPLICATION, 2022-2032 ($MILLION)
- TABLE 61. INDIA PEA PROTEIN MARKET, BY TYPE, 2022-2032 ($MILLION)
- TABLE 62. INDIA PEA PROTEIN MARKET, BY FORM, 2022-2032 ($MILLION)
- TABLE 63. JAPAN PEA PROTEIN MARKET, BY APPLICATION, 2022-2032 ($MILLION)
- TABLE 64. JAPAN PEA PROTEIN MARKET, BY TYPE, 2022-2032 ($MILLION)
- TABLE 65. JAPAN PEA PROTEIN MARKET, BY FORM, 2022-2032 ($MILLION)
- TABLE 66. SOUTH KOREA PEA PROTEIN MARKET, BY APPLICATION, 2022-2032 ($MILLION)
- TABLE 67. SOUTH KOREA PEA PROTEIN MARKET, BY TYPE, 2022-2032 ($MILLION)
- TABLE 68. SOUTH KOREA PEA PROTEIN MARKET, BY FORM, 2022-2032 ($MILLION)
- TABLE 69. AUSTRALIA PEA PROTEIN MARKET, BY APPLICATION, 2022-2032 ($MILLION)
- TABLE 70. AUSTRALIA PEA PROTEIN MARKET, BY TYPE, 2022-2032 ($MILLION)
- TABLE 71. AUSTRALIA PEA PROTEIN MARKET, BY FORM, 2022-2032 ($MILLION)
- TABLE 72. REST OF ASIA-PACIFIC PEA PROTEIN MARKET, BY APPLICATION, 2022-2032 ($MILLION)
- TABLE 73. REST OF ASIA-PACIFIC PEA PROTEIN MARKET, BY TYPE, 2022-2032 ($MILLION)
- TABLE 74. REST OF ASIA-PACIFIC PEA PROTEIN MARKET, BY FORM, 2022-2032 ($MILLION)
- TABLE 75. LAMEA PEA PROTEIN MARKET, BY APPLICATION, 2022-2032 ($MILLION)
- TABLE 76. LAMEA PEA PROTEIN MARKET, BY TYPE, 2022-2032 ($MILLION)
- TABLE 77. LAMEA PEA PROTEIN MARKET, BY FORM, 2022-2032 ($MILLION)
- TABLE 78. LAMEA PEA PROTEIN MARKET, BY COUNTRY, 2022-2032 ($MILLION)
- TABLE 79. BRAZIL PEA PROTEIN MARKET, BY APPLICATION, 2022-2032 ($MILLION)
- TABLE 80. BRAZIL PEA PROTEIN MARKET, BY TYPE, 2022-2032 ($MILLION)
- TABLE 81. BRAZIL PEA PROTEIN MARKET, BY FORM, 2022-2032 ($MILLION)
- TABLE 82. SOUTH AFRICA PEA PROTEIN MARKET, BY APPLICATION, 2022-2032 ($MILLION)
- TABLE 83. SOUTH AFRICA PEA PROTEIN MARKET, BY TYPE, 2022-2032 ($MILLION)
- TABLE 84. SOUTH AFRICA PEA PROTEIN MARKET, BY FORM, 2022-2032 ($MILLION)
- TABLE 85. UAE PEA PROTEIN MARKET, BY APPLICATION, 2022-2032 ($MILLION)
- TABLE 86. UAE PEA PROTEIN MARKET, BY TYPE, 2022-2032 ($MILLION)
- TABLE 87. UAE PEA PROTEIN MARKET, BY FORM, 2022-2032 ($MILLION)
- TABLE 88. REST OF LAMEA PEA PROTEIN MARKET, BY APPLICATION, 2022-2032 ($MILLION)
- TABLE 89. REST OF LAMEA PEA PROTEIN MARKET, BY TYPE, 2022-2032 ($MILLION)
- TABLE 90. REST OF LAMEA PEA PROTEIN MARKET, BY FORM, 2022-2032 ($MILLION)
- TABLE 91. A&B INGREDIENTS, INC.: KEY EXECUTIVES
- TABLE 92. A&B INGREDIENTS, INC.: COMPANY SNAPSHOT
- TABLE 93. A&B INGREDIENTS, INC.: PRODUCT SEGMENTS
- TABLE 94. A&B INGREDIENTS, INC.: PRODUCT PORTFOLIO
- TABLE 95. ROQUETTE FRERES S.A.: KEY EXECUTIVES
- TABLE 96. ROQUETTE FRERES S.A.: COMPANY SNAPSHOT
- TABLE 97. ROQUETTE FRERES S.A.: PRODUCT SEGMENTS
- TABLE 98. ROQUETTE FRERES S.A.: PRODUCT PORTFOLIO
- TABLE 99. BURCON NUTRASCIENCE CORPORATION.: KEY EXECUTIVES
- TABLE 100. BURCON NUTRASCIENCE CORPORATION.: COMPANY SNAPSHOT
- TABLE 101. BURCON NUTRASCIENCE CORPORATION.: PRODUCT SEGMENTS
- TABLE 102. BURCON NUTRASCIENCE CORPORATION.: PRODUCT PORTFOLIO
- TABLE 103. COSUCRA: KEY EXECUTIVES
- TABLE 104. COSUCRA: COMPANY SNAPSHOT
- TABLE 105. COSUCRA: PRODUCT SEGMENTS
- TABLE 106. COSUCRA: PRODUCT PORTFOLIO
- TABLE 107. GLANBIA PLC: KEY EXECUTIVES
- TABLE 108. GLANBIA PLC: COMPANY SNAPSHOT
- TABLE 109. GLANBIA PLC: PRODUCT SEGMENTS
- TABLE 110. GLANBIA PLC: PRODUCT PORTFOLIO
- TABLE 111. THE GREEN LABS, LLC.: KEY EXECUTIVES
- TABLE 112. THE GREEN LABS, LLC.: COMPANY SNAPSHOT
- TABLE 113. THE GREEN LABS, LLC.: PRODUCT SEGMENTS
- TABLE 114. THE GREEN LABS, LLC.: PRODUCT PORTFOLIO
- TABLE 115. GEMEF INDUSTRIES: KEY EXECUTIVES
- TABLE 116. GEMEF INDUSTRIES: COMPANY SNAPSHOT
- TABLE 117. GEMEF INDUSTRIES: PRODUCT SEGMENTS
- TABLE 118. GEMEF INDUSTRIES: PRODUCT PORTFOLIO
- TABLE 119. AXIOM FOODS, INC.: KEY EXECUTIVES
- TABLE 120. AXIOM FOODS, INC.: COMPANY SNAPSHOT
- TABLE 121. AXIOM FOODS, INC.: PRODUCT SEGMENTS
- TABLE 122. AXIOM FOODS, INC.: PRODUCT PORTFOLIO
- TABLE 123. PURIS: KEY EXECUTIVES
- TABLE 124. PURIS: COMPANY SNAPSHOT
- TABLE 125. PURIS: PRODUCT SEGMENTS
- TABLE 126. PURIS: PRODUCT PORTFOLIO
- TABLE 127. YANTAI SHUANGTA FOOD CO., LTD.: KEY EXECUTIVES
- TABLE 128. YANTAI SHUANGTA FOOD CO., LTD.: COMPANY SNAPSHOT
- TABLE 129. YANTAI SHUANGTA FOOD CO., LTD.: PRODUCT SEGMENTS
- TABLE 130. YANTAI SHUANGTA FOOD CO., LTD.: PRODUCT PORTFOLIO
LIST OF FIGURES
- FIGURE 01. PEA PROTEIN MARKET, 2022-2032
- FIGURE 02. SEGMENTATION OF PEA PROTEIN MARKET,2022-2032
- FIGURE 03. TOP INVESTMENT POCKETS IN PEA PROTEIN MARKET (2023-2032)
- FIGURE 04. MODERATE BARGAINING POWER OF SUPPLIERS
- FIGURE 05. MODERATE THREAT OF NEW ENTRANTS
- FIGURE 06. HIGH THREAT OF SUBSTITUTES
- FIGURE 07. MODERATE INTENSITY OF RIVALRY
- FIGURE 08. MODERATE BARGAINING POWER OF BUYERS
- FIGURE 09. GLOBAL PEA PROTEIN MARKET:DRIVERS, RESTRAINTS AND OPPORTUNITIES
- FIGURE 10. PEA PROTEIN MARKET, BY APPLICATION, 2022(%)
- FIGURE 11. COMPARATIVE SHARE ANALYSIS OF PEA PROTEIN MARKET FOR DIETARY SUPPLEMENT, BY COUNTRY 2022 AND 2032(%)
- FIGURE 12. COMPARATIVE SHARE ANALYSIS OF PEA PROTEIN MARKET FOR BAKERY AND CONFECTIONERY GOOD, BY COUNTRY 2022 AND 2032(%)
- FIGURE 13. COMPARATIVE SHARE ANALYSIS OF PEA PROTEIN MARKET FOR MEAT PRODUCTS AND ALTERNATIVE, BY COUNTRY 2022 AND 2032(%)
- FIGURE 14. COMPARATIVE SHARE ANALYSIS OF PEA PROTEIN MARKET FOR BEVERAGE, BY COUNTRY 2022 AND 2032(%)
- FIGURE 15. COMPARATIVE SHARE ANALYSIS OF PEA PROTEIN MARKET FOR OTHERS, BY COUNTRY 2022 AND 2032(%)
- FIGURE 16. PEA PROTEIN MARKET, BY TYPE, 2022(%)
- FIGURE 17. COMPARATIVE SHARE ANALYSIS OF PEA PROTEIN MARKET FOR PEA PROTEIN ISOLATE, BY COUNTRY 2022 AND 2032(%)
- FIGURE 18. COMPARATIVE SHARE ANALYSIS OF PEA PROTEIN MARKET FOR PEA PROTEIN CONCENTRATE, BY COUNTRY 2022 AND 2032(%)
- FIGURE 19. COMPARATIVE SHARE ANALYSIS OF PEA PROTEIN MARKET FOR TEXTURED PEA PROTEIN, BY COUNTRY 2022 AND 2032(%)
- FIGURE 20. PEA PROTEIN MARKET, BY FORM, 2022(%)
- FIGURE 21. COMPARATIVE SHARE ANALYSIS OF PEA PROTEIN MARKET FOR DRY, BY COUNTRY 2022 AND 2032(%)
- FIGURE 22. COMPARATIVE SHARE ANALYSIS OF PEA PROTEIN MARKET FOR LIQUID, BY COUNTRY 2022 AND 2032(%)
- FIGURE 23. PEA PROTEIN MARKET BY REGION, 2022(%)
- FIGURE 24. U.S. PEA PROTEIN MARKET, 2022-2032 ($MILLION)
- FIGURE 25. CANADA PEA PROTEIN MARKET, 2022-2032 ($MILLION)
- FIGURE 26. MEXICO PEA PROTEIN MARKET, 2022-2032 ($MILLION)
- FIGURE 27. GERMANY PEA PROTEIN MARKET, 2022-2032 ($MILLION)
- FIGURE 28. UK PEA PROTEIN MARKET, 2022-2032 ($MILLION)
- FIGURE 29. FRANCE PEA PROTEIN MARKET, 2022-2032 ($MILLION)
- FIGURE 30. ITALY PEA PROTEIN MARKET, 2022-2032 ($MILLION)
- FIGURE 31. SPAIN PEA PROTEIN MARKET, 2022-2032 ($MILLION)
- FIGURE 32. SWITZERLAND PEA PROTEIN MARKET, 2022-2032 ($MILLION)
- FIGURE 33. REST OF EUROPE PEA PROTEIN MARKET, 2022-2032 ($MILLION)
- FIGURE 34. CHINA PEA PROTEIN MARKET, 2022-2032 ($MILLION)
- FIGURE 35. INDIA PEA PROTEIN MARKET, 2022-2032 ($MILLION)
- FIGURE 36. JAPAN PEA PROTEIN MARKET, 2022-2032 ($MILLION)
- FIGURE 37. SOUTH KOREA PEA PROTEIN MARKET, 2022-2032 ($MILLION)
- FIGURE 38. AUSTRALIA PEA PROTEIN MARKET, 2022-2032 ($MILLION)
- FIGURE 39. REST OF ASIA-PACIFIC PEA PROTEIN MARKET, 2022-2032 ($MILLION)
- FIGURE 40. BRAZIL PEA PROTEIN MARKET, 2022-2032 ($MILLION)
- FIGURE 41. SOUTH AFRICA PEA PROTEIN MARKET, 2022-2032 ($MILLION)
- FIGURE 42. UAE PEA PROTEIN MARKET, 2022-2032 ($MILLION)
- FIGURE 43. REST OF LAMEA PEA PROTEIN MARKET, 2022-2032 ($MILLION)
- FIGURE 44. TOP WINNING STRATEGIES, BY YEAR
- FIGURE 45. TOP WINNING STRATEGIES, BY DEVELOPMENT
- FIGURE 46. TOP WINNING STRATEGIES, BY COMPANY
- FIGURE 47. PRODUCT MAPPING OF TOP 10 PLAYERS
- FIGURE 48. COMPETITIVE DASHBOARD
- FIGURE 49. COMPETITIVE HEATMAP: PEA PROTEIN MARKET
- FIGURE 50. TOP PLAYER POSITIONING, 2022
- FIGURE 51. BURCON NUTRASCIENCE CORPORATION: NET REVENUE, 2019-2021 ($MILLION)
- FIGURE 52. GLANBIA PLC: NET REVENUE, 2020-2022 ($MILLION)
- FIGURE 53. GLANBIA PLC: RESEARCH & DEVELOPMENT EXPENDITURE, 2020-2022 ($MILLION)
- FIGURE 54. GLANBIA PLC: REVENUE SHARE BY SEGMENT, 2022 (%)
- FIGURE 55. GLANBIA PLC: REVENUE SHARE BY REGION, 2022 (%)
According to a new report published by Allied Market Research, titled, "Pea Protein Market," The pea protein market was valued at $94.60 million in 2022, and is estimated to reach $227.1 million by 2032, growing at a CAGR of 9.2% from 2023 to 2032.
Pea protein is a lactose- plant protein produced from yellow field peas. Pea protein isolate, pea protein concentrate, and textured pea protein are the types of protein available in the market. Pea protein is a crucial alternative protein source for both vegetarians and lactose intolerant people.. Pea protein products are used in place of alternative sources of protein such as soy, almonds, and peanuts, that are prone to cause allergic reactions in a selected group of audience. Pea protein offers a high protein concentration and necessary amino acids, resulting in a number of favourable health benefits, including enhanced circulation and absorption of calcium, muscle conservation, increased metabolism, and managing blood sugar levels.
People's eating habits have shifted as their health knowledge has increased. Consumers are looking for products that are safe for digestion, eco-friendly, and healthy and help to reduce ailments such as sickness, water loss, gas, cramps, a lack of appetite, exhaustion, and headache, and pea protein suits their requirements as it is the suitable source of protein without any side effects. People who are intolerant or too allergic to gluten or dairy finds pea protein as a suitable source of nutrition. Furthermore, unlike other protein powders such as soy, eggs, whey, or casein, it is easily absorbed and does not cause bloating. Pea protein's strong nutritional composition makes it ideal for senior, vegetarian, and without lactose diets, and child nutrition, driving up demand. As a consequence, all of these factors contribute to market growth.
The global consumers majorly relies on animal-derived protein sources such as flesh, cheese, dairy products, and poultry to fulfill their daily protein requirements. Animal-derived proteins consists of more protein than plant-based proteins and contribute to serious health problems such as coronary artery disease, overweight or obese people, diabetes, and others. The pea protein industry has expanded over the past decade as a growing consumer health consciousness, health advantages attributed to pea intake of protein, and a growing demand for plant-based protein alternatives. According to an International Food Information Council (IFIC) study/survey, in 2022, 28% of the US community recognized the nutritive relevance of plant proteins, and 69% thought plant proteins aided their nutritious gains.
Furthermore, the affordable nature of proteins made from plants in compared to other types of protein, as well as their various health benefits, have increased the demand from customers in recent years, boosting market growth. Future trends towards a high-protein diet, increased health awareness, growth in the economy, urbanisation, and a sizeable vegan population all indicate to an increase in the utilisation of plant-based proteins in food products. To accommodate changing customer tastes, the food industry is continuously exploring for less costly and healthier protein components to replace those derived from animals, such as whey protein, casein, gelatin, which is and ovalbumin- and gluten-based proteins. Pea protein is a feasible food industry choice due to its neutral flavour and usual amino acid makeup Furthermore, the remarkable emulsification qualities of pea protein, which combine both water and fat for a stable emulsion, it is used as a texturizing component in meat products. In recent years, food manufacturers are using pea protein in food items to increase its nutritional content, breakfast cereals, nutritional supplements, baked savories, protein powder, ready-to-drink meal replacement beverages, and plant-based meat are the types of food products where pea protein isolates are used. The growing expansion of the F&B industry, and introduction of innovations in protein-based solutions in developed marketplaces, have propelled demand of the market globally.
The pea protein market is segmented on the basis of type, form, application, and region. By type, it is classified into pea protein isolate, pea protein concentrate, and textured pea protein. Depending on form, it is categorized as dry and liquid. By application, it is segmented into dietary supplement, bakery & confectionery goods, meat products & alternative, beverages, and others. By region, it is analyzed across North America, Europe, Asia-Pacific and LAMEA.
Some of the Major players analyzed in this report are: A&B Ingredients, Roquette Freres Le Romarin, Burcon Nutrascience Corporation, Cosucra Groupe Warcoing SA, Glanbia, Plc., Green Labs, LLC, GEMEF Industries, Axiom Foods, Inc., Puris, and Yantai Shuangta Food Co., Ltd.
Key Benefits For Stakeholders
- This report provides a quantitative analysis of the market segments, current trends, estimations, and dynamics of the pea protein market analysis from 2022 to 2032 to identify the prevailing pea protein market opportunities.
- The market research is offered along with information related to key drivers, restraints, and opportunities.
- Porter's five forces analysis highlights the potency of buyers and suppliers to enable stakeholders make profit-oriented business decisions and strengthen their supplier-buyer network.
- In-depth analysis of the pea protein market segmentation assists to determine the prevailing market opportunities.
- Major countries in each region are mapped according to their revenue contribution to the global market.
- Market player positioning facilitates benchmarking and provides a clear understanding of the present position of the market players.
- The report includes the analysis of the regional as well as global pea protein market trends, key players, market segments, application areas, and market growth strategies.
Additional benefits you will get with this purchase are:
- Quarterly Update and* (only available with a corporate license, on listed price)
- 5 additional Company Profile of client Choice pre- or Post-purchase, as a free update.
- Free Upcoming Version on the Purchase of Five and Enterprise User License.
- 16 analyst hours of support* (post-purchase, if you find additional data requirements upon review of the report, you may receive support amounting to 16 analyst hours to solve questions, and post-sale queries)
- 15% Free Customization* (in case the scope or segment of the report does not match your requirements, 20% is equivalent to 3 working days of free work, applicable once)
- Free data Pack on the Five and Enterprise User License. (Excel version of the report)
- Free Updated report if the report is 6-12 months old or older.
- 24-hour priority response*
- Free Industry updates and white papers.
Possible Customization with this report (with additional cost and timeline talk to the sales executive to know more)
- Manufacturing Capacity
- Consumer Buying Behavior Analysis
- End user preferences and pain points
- Investment Opportunities
- Average Consumer Expenditure
- Pain Point Analysis
Key Market Segments
By Application
- Dietary supplement
- Bakery and confectionery good
- Meat products and alternative
- Beverage
- Others
By Type
- Pea protein isolate
- Pea protein concentrate
- Textured pea protein
By Form
- Dry
- Liquid
By Region
- North America
- U.S.
- Canada
- Mexico
- Europe
- Germany
- UK
- France
- Italy
- Spain
- Switzerland
- Rest of Europe
- Asia-Pacific
- China
- India
- Japan
- South Korea
- Australia
- Rest of Asia-Pacific
- LAMEA
- Brazil
- South Africa
- UAE
- Rest of LAMEA
Key Market Players:
- Burcon Nutrascience Corporation.
- Puris
- Yantai Shuangta Food Co., Ltd.
- Cosucra
- Roquette Freres S.A.
- Glanbia PLC
- Axiom Foods, Inc.
- The Green Labs, LLC.
- GEMEF Industries
- A&B Ingredients, Inc.
TABLE OF CONTENTS
CHAPTER 1: INTRODUCTION
- 1.1. Report description
- 1.2. Key market segments
- 1.3. Key benefits to the stakeholders
- 1.4. Research Methodology
- 1.4.1. Primary research
- 1.4.2. Secondary research
- 1.4.3. Analyst tools and models
CHAPTER 2: EXECUTIVE SUMMARY
- 2.1. CXO Perspective
CHAPTER 3: MARKET OVERVIEW
- 3.1. Market definition and scope
- 3.2. Key findings
- 3.2.1. Top impacting factors
- 3.2.2. Top investment pockets
- 3.3. Porter's five forces analysis
- 3.3.1. Moderate bargaining power of suppliers
- 3.3.2. Moderate threat of new entrants
- 3.3.3. High threat of substitutes
- 3.3.4. Moderate intensity of rivalry
- 3.3.5. Moderate bargaining power of buyers
- 3.4. Market dynamics
- 3.4.1. Drivers
- 3.4.1.1. High nutritional profile of pea proteins
- 3.4.1.2. High demand for plant-based proteins from vegan population
- 3.4.1.3. Consistent growth of the food & beverages industry
- 3.4.1. Drivers
- 3.4.2. Restraints
- 3.4.2.1. Increase in market penetration of other proteins
- 3.4.2.2. Formulation challenges in pea protein products
- 3.4.2.3. Low consumer awareness about pea protein-based products
- 3.4.3. Opportunities
- 3.4.3.1. Surge in demand for pea protein-based sports nutrition & weight management products
- 3.4.3.2. Pea proteins as alternative protein source for pet foods
- 3.5. COVID-19 Impact Analysis on the market
CHAPTER 4: PEA PROTEIN MARKET, BY APPLICATION
- 4.1. Overview
- 4.1.1. Market size and forecast
- 4.2. Dietary supplement
- 4.2.1. Key market trends, growth factors and opportunities
- 4.2.2. Market size and forecast, by region
- 4.2.3. Market share analysis by country
- 4.3. Bakery and confectionery good
- 4.3.1. Key market trends, growth factors and opportunities
- 4.3.2. Market size and forecast, by region
- 4.3.3. Market share analysis by country
- 4.4. Meat products and alternative
- 4.4.1. Key market trends, growth factors and opportunities
- 4.4.2. Market size and forecast, by region
- 4.4.3. Market share analysis by country
- 4.5. Beverage
- 4.5.1. Key market trends, growth factors and opportunities
- 4.5.2. Market size and forecast, by region
- 4.5.3. Market share analysis by country
- 4.6. Others
- 4.6.1. Key market trends, growth factors and opportunities
- 4.6.2. Market size and forecast, by region
- 4.6.3. Market share analysis by country
CHAPTER 5: PEA PROTEIN MARKET, BY TYPE
- 5.1. Overview
- 5.1.1. Market size and forecast
- 5.2. Pea protein isolate
- 5.2.1. Key market trends, growth factors and opportunities
- 5.2.2. Market size and forecast, by region
- 5.2.3. Market share analysis by country
- 5.3. Pea protein concentrate
- 5.3.1. Key market trends, growth factors and opportunities
- 5.3.2. Market size and forecast, by region
- 5.3.3. Market share analysis by country
- 5.4. Textured pea protein
- 5.4.1. Key market trends, growth factors and opportunities
- 5.4.2. Market size and forecast, by region
- 5.4.3. Market share analysis by country
CHAPTER 6: PEA PROTEIN MARKET, BY FORM
- 6.1. Overview
- 6.1.1. Market size and forecast
- 6.2. Dry
- 6.2.1. Key market trends, growth factors and opportunities
- 6.2.2. Market size and forecast, by region
- 6.2.3. Market share analysis by country
- 6.3. Liquid
- 6.3.1. Key market trends, growth factors and opportunities
- 6.3.2. Market size and forecast, by region
- 6.3.3. Market share analysis by country
CHAPTER 7: PEA PROTEIN MARKET, BY REGION
- 7.1. Overview
- 7.1.1. Market size and forecast By Region
- 7.2. North America
- 7.2.1. Key trends and opportunities
- 7.2.2. Market size and forecast, by Application
- 7.2.3. Market size and forecast, by Type
- 7.2.4. Market size and forecast, by Form
- 7.2.5. Market size and forecast, by country
- 7.2.5.1. U.S.
- 7.2.5.1.1. Key market trends, growth factors and opportunities
- 7.2.5.1.2. Market size and forecast, by Application
- 7.2.5.1.3. Market size and forecast, by Type
- 7.2.5.1.4. Market size and forecast, by Form
- 7.2.5.2. Canada
- 7.2.5.2.1. Key market trends, growth factors and opportunities
- 7.2.5.2.2. Market size and forecast, by Application
- 7.2.5.2.3. Market size and forecast, by Type
- 7.2.5.2.4. Market size and forecast, by Form
- 7.2.5.3. Mexico
- 7.2.5.3.1. Key market trends, growth factors and opportunities
- 7.2.5.3.2. Market size and forecast, by Application
- 7.2.5.3.3. Market size and forecast, by Type
- 7.2.5.3.4. Market size and forecast, by Form
- 7.3. Europe
- 7.3.1. Key trends and opportunities
- 7.3.2. Market size and forecast, by Application
- 7.3.3. Market size and forecast, by Type
- 7.3.4. Market size and forecast, by Form
- 7.3.5. Market size and forecast, by country
- 7.3.5.1. Germany
- 7.3.5.1.1. Key market trends, growth factors and opportunities
- 7.3.5.1.2. Market size and forecast, by Application
- 7.3.5.1.3. Market size and forecast, by Type
- 7.3.5.1.4. Market size and forecast, by Form
- 7.3.5.2. UK
- 7.3.5.2.1. Key market trends, growth factors and opportunities
- 7.3.5.2.2. Market size and forecast, by Application
- 7.3.5.2.3. Market size and forecast, by Type
- 7.3.5.2.4. Market size and forecast, by Form
- 7.3.5.3. France
- 7.3.5.3.1. Key market trends, growth factors and opportunities
- 7.3.5.3.2. Market size and forecast, by Application
- 7.3.5.3.3. Market size and forecast, by Type
- 7.3.5.3.4. Market size and forecast, by Form
- 7.3.5.4. Italy
- 7.3.5.4.1. Key market trends, growth factors and opportunities
- 7.3.5.4.2. Market size and forecast, by Application
- 7.3.5.4.3. Market size and forecast, by Type
- 7.3.5.4.4. Market size and forecast, by Form
- 7.3.5.5. Spain
- 7.3.5.5.1. Key market trends, growth factors and opportunities
- 7.3.5.5.2. Market size and forecast, by Application
- 7.3.5.5.3. Market size and forecast, by Type
- 7.3.5.5.4. Market size and forecast, by Form
- 7.3.5.6. Switzerland
- 7.3.5.6.1. Key market trends, growth factors and opportunities
- 7.3.5.6.2. Market size and forecast, by Application
- 7.3.5.6.3. Market size and forecast, by Type
- 7.3.5.6.4. Market size and forecast, by Form
- 7.3.5.7. Rest of Europe
- 7.3.5.7.1. Key market trends, growth factors and opportunities
- 7.3.5.7.2. Market size and forecast, by Application
- 7.3.5.7.3. Market size and forecast, by Type
- 7.3.5.7.4. Market size and forecast, by Form
- 7.4. Asia-Pacific
- 7.4.1. Key trends and opportunities
- 7.4.2. Market size and forecast, by Application
- 7.4.3. Market size and forecast, by Type
- 7.4.4. Market size and forecast, by Form
- 7.4.5. Market size and forecast, by country
- 7.4.5.1. China
- 7.4.5.1.1. Key market trends, growth factors and opportunities
- 7.4.5.1.2. Market size and forecast, by Application
- 7.4.5.1.3. Market size and forecast, by Type
- 7.4.5.1.4. Market size and forecast, by Form
- 7.4.5.2. India
- 7.4.5.2.1. Key market trends, growth factors and opportunities
- 7.4.5.2.2. Market size and forecast, by Application
- 7.4.5.2.3. Market size and forecast, by Type
- 7.4.5.2.4. Market size and forecast, by Form
- 7.4.5.3. Japan
- 7.4.5.3.1. Key market trends, growth factors and opportunities
- 7.4.5.3.2. Market size and forecast, by Application
- 7.4.5.3.3. Market size and forecast, by Type
- 7.4.5.3.4. Market size and forecast, by Form
- 7.4.5.4. South Korea
- 7.4.5.4.1. Key market trends, growth factors and opportunities
- 7.4.5.4.2. Market size and forecast, by Application
- 7.4.5.4.3. Market size and forecast, by Type
- 7.4.5.4.4. Market size and forecast, by Form
- 7.4.5.5. Australia
- 7.4.5.5.1. Key market trends, growth factors and opportunities
- 7.4.5.5.2. Market size and forecast, by Application
- 7.4.5.5.3. Market size and forecast, by Type
- 7.4.5.5.4. Market size and forecast, by Form
- 7.4.5.6. Rest of Asia-Pacific
- 7.4.5.6.1. Key market trends, growth factors and opportunities
- 7.4.5.6.2. Market size and forecast, by Application
- 7.4.5.6.3. Market size and forecast, by Type
- 7.4.5.6.4. Market size and forecast, by Form
- 7.5. LAMEA
- 7.5.1. Key trends and opportunities
- 7.5.2. Market size and forecast, by Application
- 7.5.3. Market size and forecast, by Type
- 7.5.4. Market size and forecast, by Form
- 7.5.5. Market size and forecast, by country
- 7.5.5.1. Brazil
- 7.5.5.1.1. Key market trends, growth factors and opportunities
- 7.5.5.1.2. Market size and forecast, by Application
- 7.5.5.1.3. Market size and forecast, by Type
- 7.5.5.1.4. Market size and forecast, by Form
- 7.5.5.2. South Africa
- 7.5.5.2.1. Key market trends, growth factors and opportunities
- 7.5.5.2.2. Market size and forecast, by Application
- 7.5.5.2.3. Market size and forecast, by Type
- 7.5.5.2.4. Market size and forecast, by Form
- 7.5.5.3. UAE
- 7.5.5.3.1. Key market trends, growth factors and opportunities
- 7.5.5.3.2. Market size and forecast, by Application
- 7.5.5.3.3. Market size and forecast, by Type
- 7.5.5.3.4. Market size and forecast, by Form
- 7.5.5.4. Rest of LAMEA
- 7.5.5.4.1. Key market trends, growth factors and opportunities
- 7.5.5.4.2. Market size and forecast, by Application
- 7.5.5.4.3. Market size and forecast, by Type
- 7.5.5.4.4. Market size and forecast, by Form
CHAPTER 8: COMPETITIVE LANDSCAPE
- 8.1. Introduction
- 8.2. Top winning strategies
- 8.3. Product Mapping of Top 10 Player
- 8.4. Competitive Dashboard
- 8.5. Competitive Heatmap
- 8.6. Top player positioning, 2022
CHAPTER 9: COMPANY PROFILES
- 9.1. A&B Ingredients, Inc.
- 9.1.1. Company overview
- 9.1.2. Key Executives
- 9.1.3. Company snapshot
- 9.1.4. Operating business segments
- 9.1.5. Product portfolio
- 9.2. Roquette Freres S.A.
- 9.2.1. Company overview
- 9.2.2. Key Executives
- 9.2.3. Company snapshot
- 9.2.4. Operating business segments
- 9.2.5. Product portfolio
- 9.3. Burcon Nutrascience Corporation.
- 9.3.1. Company overview
- 9.3.2. Key Executives
- 9.3.3. Company snapshot
- 9.3.4. Operating business segments
- 9.3.5. Product portfolio
- 9.3.6. Business performance
- 9.4. Cosucra
- 9.4.1. Company overview
- 9.4.2. Key Executives
- 9.4.3. Company snapshot
- 9.4.4. Operating business segments
- 9.4.5. Product portfolio
- 9.5. Glanbia PLC
- 9.5.1. Company overview
- 9.5.2. Key Executives
- 9.5.3. Company snapshot
- 9.5.4. Operating business segments
- 9.5.5. Product portfolio
- 9.5.6. Business performance
- 9.6. The Green Labs, LLC.
- 9.6.1. Company overview
- 9.6.2. Key Executives
- 9.6.3. Company snapshot
- 9.6.4. Operating business segments
- 9.6.5. Product portfolio
- 9.7. GEMEF Industries
- 9.7.1. Company overview
- 9.7.2. Key Executives
- 9.7.3. Company snapshot
- 9.7.4. Operating business segments
- 9.7.5. Product portfolio
- 9.8. Axiom Foods, Inc.
- 9.8.1. Company overview
- 9.8.2. Key Executives
- 9.8.3. Company snapshot
- 9.8.4. Operating business segments
- 9.8.5. Product portfolio
- 9.9. Puris
- 9.9.1. Company overview
- 9.9.2. Key Executives
- 9.9.3. Company snapshot
- 9.9.4. Operating business segments
- 9.9.5. Product portfolio
- 9.10. Yantai Shuangta Food Co., Ltd.
- 9.10.1. Company overview
- 9.10.2. Key Executives
- 9.10.3. Company snapshot
- 9.10.4. Operating business segments
- 9.10.5. Product portfolio
