
|
市場調査レポート
商品コード
1683508
エンドウ豆たんぱく質原料:市場シェア分析、産業動向・統計、成長予測(2025年~2030年)Pea Protein Ingredients - Market Share Analysis, Industry Trends & Statistics, Growth Forecasts (2025 - 2030) |
||||||
カスタマイズ可能
適宜更新あり
|
|||||||
| エンドウ豆たんぱく質原料:市場シェア分析、産業動向・統計、成長予測(2025年~2030年) |
|
出版日: 2025年03月18日
発行: Mordor Intelligence
ページ情報: 英文 402 Pages
納期: 2~3営業日
|

全表示
- 概要
- 目次
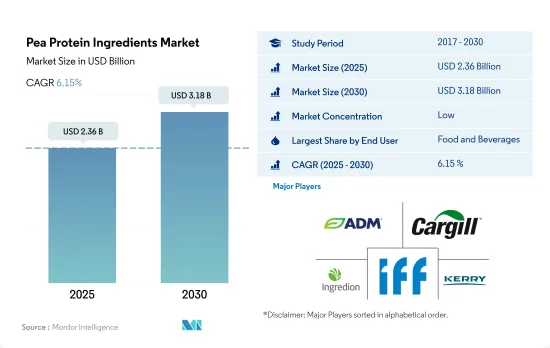
エンドウ豆たんぱく質原料の市場規模は2025年に23億6,000万米ドルと推定され、2030年には31億8,000万米ドルに達すると予測され、予測期間中(2025-2030年)のCAGRは6.15%で成長する見込みです。
ヴィーガン文化の増加に伴い、エンドウ豆たんぱく質原料の需要が地域全体で高まっています。
- 機能性の拡大により、エンドウタンパク入り製品は世界的に高い需要があります。2022年には、飲食品分野が市場の消費量の88.48%を占め、主導権を握りました。低アレルギー性で知られるエンドウタンパクは、風味、食感、全体的な栄養価を高めるために他の成分とブレンドされることが多いです。
- サプリメント分野では、スポーツ/パフォーマンス栄養サブセグメントが主な牽引役となっており、予測期間中のCAGRは6.85%となる見込みです。プロテイン飲料市場は現在、乳製品と大豆製品が支配的です。しかし、顕著な変化が起きており、米国の消費者の30%が植物由来のプロテイン飲料を選ぶようになっています。英国では、10%の消費者がアレルギーや不耐症のために大豆を避けており、さらに10%の消費者が健康志向の一環として大豆を避けています。エンドウ豆プロテインの魅力は、「グルテンフリー」や「遺伝子組み換え食品不使用」といったラベルの人気が高まっていることによって、さらに高まっています。エンドウ豆プロテインは、その優れたアミノ酸プロファイルのため、スポーツ栄養業界では特に適しています。動物飼料分野は、飲食品業界に次いで世界第2位の消費者です。2022年には、エンドウタンパク単離物が41.97%の数量シェアを獲得し、動物飼料用途で主導権を握りました。消化性が高く、抗トリプシン活性がもともと低いことから、エンドウタンパクは特に子豚をはじめとする幼若動物の栄養として好まれています。多くの研究が、エンドウ豆たんぱく質を豊富に含む飼料の嗜好性と成長の利点を強調しています。
エンドウ豆たんぱく質は卵たんぱく質の代用品として人気が高まっており、この地域全体に広がる菜食主義に支えられています。
- アジア太平洋は、2022年に数量ベースで市場シェアの95%を占めたF&Bセグメントが牽引し、世界のエンドウタンパク市場を独占しています。さらに、エンドウ豆たんぱく質は十分な粘性とクリーミーさを提供するため、現地のメーカーはマヨネーズなどの製品に卵の代用品としてエンドウ豆たんぱく質を使用しています。エンドウ豆プロテインはラベルに優しく、グルテンフリー、大豆フリーの代替品として注目されています。アジア太平洋地域は最大のシェアを占めるとともに大きく成長しており、予測期間中のCAGRは6.53%を記録すると予想されています。
- アジア太平洋に続くのは欧州で、主にF&Bセグメントが牽引しており、2022年に同地域で使用されたエンドウ豆たんぱく質の約93%を占めています。同地域の先進諸国ではヴィーガン食が普及しているため、代替たんぱく質源としてのエンドウ豆たんぱく質の需要が伸びています。ドイツは、菜食主義の高まりと消費者の代替肉製品への依存の高まりにより、調査期間中、エンドウ豆たんぱく質の最大消費国であり続けた。
- 中東は、消費者の健康志向の高まりにより天然で持続可能な原料への需要が急速に高まっているため、最も急成長している地域セグメントと予測されます。予測期間中、同地域の数量ベースのCAGRは12.21%を記録すると予想されます。サウジアラビアが主に中東のエンドウタンパク市場を牽引しているが、これはエンドウタンパクの利用に対する意識が高まり、同国の国民が食生活にエンドウタンパクを取り入れるようになったためです。しかし、これらのたんぱく質はF&Bセグメントにも応用されており、2022年の数量シェアは37%で、主に肉および肉代替製品サブセグメントが牽引しています。
世界のエンドウ豆たんぱく質の動向
植物性たんぱく質をベースとした食事が健康にもたらすいくつかの利点により、顧客はヴィーガン向けの製品に移行しています。
- 世界的に、消費者の食生活の嗜好は変化しています。特に欧州と北米の消費者の間で、乳製品と肉の代替品への嗜好が高まっています。2022年には、植物由来の牛乳が植物由来の食品売上全体の38%を占め、欧州がリードし、植物由来の肉が僅差でこれに続きます。この進化する動向は、フレキシタリアンやヴィーガンの消費者の数を押し上げ、メーカーが植物性たんぱく質分野でイノベーションを起こすための扉を開いています。
- 植物性たんぱく質代替食品の人気は、その栄養価によるもので、環境への影響、倫理、健康に対する懸念の高まりに起因します。炭水化物に比べて消化が遅いことで知られるたんぱく質は、少ないカロリーで満腹感を長時間持続させることで、体重管理に重要な役割を果たしています。新たな研究によると、2022年から2023年にかけて、世界で10億人以上が肥満とともに暮らしていることが明らかになりました。
- さらに、若年層のスポーツやフィットネス活動への関与の高まりと、健康上の利点を付加するために機能性成分で飲食品を強化する傾向の高まりが、植物性たんぱく質の需要を促進しています。2023年には、6歳以上の米国人(人口の約80%)が少なくとも1つのスポーツやフィットネス活動に参加し、過去最高の2億4,200万人に達し、2022年から2.2%増加しました。このアクティブなライフスタイルの変化が、植物性たんぱく質食品の需要を牽引しています。さらに、野菜と果物、全粒穀物、植物性蛋白質という3つの主要カテゴリーを強調し、食品ガイドを刷新したカナダ保健省のような政府の取り組みが、消費者の代替蛋白質に対する認識と需要を促進しています。
北米が世界の乾燥エンドウ豆生産を独占、カナダが牽引
- 乾燥エンドウ豆はエンドウ豆たんぱく質を抽出する一次情報源であり、カナダが生産をリードし、米国が僅差でこれに続きます。カナダでは、サスカチュワン州、アルバータ州、マニトバ州などが乾燥エンドウ豆の生産をリードしています。特筆すべきは、北米のエンドウ豆生産量が2015年から2020年にかけて32%急増したことです。2020年までに、この地域の焦点は乾燥エンドウ豆に大きくシフトし、エンドウ豆生産全体の95%を占める圧倒的なシェアを占める。逆に米国は、主にノースダコタ州での播種量の減少、収量の減少、放棄率の上昇などの生産課題に直面しました。米国農務省は2020~2021年の予測で、米国の乾燥エンドウ豆生産量は17%減少し、80万トンをわずかに上回る程度にとどまると予測しています。
- アジア太平洋では、中国がエンドウ豆生産をリードし、インドが僅差で続いています。中国には、北部と南部の乾燥エンドウ豆生産地域という2つの重要な乾燥エンドウ豆生産拠点があります。寧夏、甘粛、クラウド南、青海などの省は、合わせて中国の乾燥エンドウ豆生産量の70%以上を占めています。インドに目を移すと、同国の乾燥エンドウ豆生産量は2022年に100,440.2トンに達し、2019年の81万1,810トンから23.72%増と顕著な伸びを示します。
- 支配的なプレーヤーの他に、ロシア、フランス、ウクライナ、オーストラリアなどの国も世界のドライエンドウ生産で重要な位置を占めています。特筆すべきは、特にオーストラリア東部でイエローエンドウがかなり栽培されていることです。歴史的には、ビクトリア州と南オーストラリア州がオーストラリアのエンドウ豆生産をリードしてきたが、西オーストラリア州では、品種と生産技術の両方の進歩に起因して、生産が著しく急増しています。
エンドウ豆たんぱく質原料産業の概要
エンドウ豆たんぱく質原料市場は細分化されており、上位5社で21.95%を占めています。この市場の主要企業は以下の通りです。 Archer Daniels Midland Company, Cargill Incorporated, Ingredion Incorporated, International Flavors & Fragrances, Inc. and Kerry Group(sorted alphabetically).
その他の特典
- エクセル形式の市場予測(ME)シート
- 3ヶ月のアナリストサポート
目次
第1章 エグゼクティブサマリーと主な調査結果
第2章 イントロダクション
- 調査の前提条件と市場定義
- 調査範囲
- 調査手法
第3章 主要産業動向
- エンドユーザー市場規模
- ベビーフードおよび乳児用調製乳
- ベーカリー
- 飲料
- 朝食用シリアル
- 調味料/ソース
- 菓子類
- 乳製品および乳製品代替製品
- 高齢者栄養・医療栄養
- 肉・鶏肉・魚介類および肉代替製品
- RTE/RTC食品
- スナック
- スポーツ/パフォーマンス栄養
- 動物飼料
- パーソナルケアと化粧品
- たんぱく質消費動向
- 植物
- 生産動向
- 植物
- 規制の枠組み
- 中国
- ドイツ
- インド
- 日本
- 米国
- バリューチェーンと流通チャネル分析
第4章 市場セグメンテーション
- 形態
- 濃縮物
- 単離液
- テクスチャード/加水分解物
- エンドユーザー
- 飼料
- 飲食品
- サブエンドユーザー別
- ベーカリー
- 飲料
- 朝食用シリアル
- 調味料/ソース
- 菓子類
- 乳製品・乳製品代替品
- 肉・鶏肉・魚介類および肉代替製品
- RTE/RTC食品
- スナック
- パーソナルケアと化粧品
- サプリメント
- サブエンドユーザー別
- ベビーフードおよび乳児用調製乳
- 高齢者栄養と医療栄養
- スポーツ/パフォーマンス栄養
- 地域別
- アフリカ
- 形態別
- エンドユーザー別
- 国別
- ナイジェリア
- 南アフリカ
- その他のアフリカ
- アジア太平洋
- 形態別
- エンドユーザー別
- 国別
- オーストラリア
- 中国
- インド
- インドネシア
- 日本
- マレーシア
- ニュージーランド
- 韓国
- タイ
- ベトナム
- その他アジア太平洋地域
- 欧州
- 形態別
- エンドユーザー別
- 国別
- ベルギー
- フランス
- ドイツ
- イタリア
- オランダ
- ロシア
- スペイン
- トルコ
- 英国
- その他欧州
- 中東
- 形態別
- エンドユーザー別
- 国別
- イラン
- サウジアラビア
- アラブ首長国連邦
- その他中東
- 北米
- 形態別
- エンドユーザー別
- 国別
- カナダ
- メキシコ
- 米国
- その他北米
- 南米
- 形態別
- エンドユーザー別
- 国別
- アルゼンチン
- ブラジル
- その他南米地域
- アフリカ
第5章 競合情勢
- 主要な戦略動向
- 市場シェア分析
- 企業情勢
- 企業プロファイル(世界レベルの概要、市場レベルの概要、主要事業セグメント、財務、従業員数、主要情報、市場ランク、市場シェア、製品・サービス、最近の動向分析を含む)
- Archer Daniels Midland Company
- Cargill Incorporated
- Cosucra Groupe Warcoing SA
- Emsland Group
- Ingredion Incorporated
- International Flavors & Fragrances, Inc.
- Kerry Group
- Roquette Frere
- Yantai Shuangta Food Co. Ltd
第6章 CEOへの主な戦略的質問
第7章 付録
- 世界概要
- 概要
- ファイブフォース分析フレームワーク
- 世界のバリューチェーン分析
- 市場力学(DROs)
- 情報源と参考文献
- 図表一覧
- 主要洞察
- データパック
- 用語集
The Pea Protein Ingredients Market size is estimated at 2.36 billion USD in 2025, and is expected to reach 3.18 billion USD by 2030, growing at a CAGR of 6.15% during the forecast period (2025-2030).
With the increasing vegan culture, the demand for pea protein ingredients has risen throughout the region
- Due to their expanding functionalities, pea protein-infused products are in high global demand. In 2022, the food and beverage segment led the charge, accounting for 88.48% of the market's volume consumption. Recognized for its hypoallergenic properties, pea protein is often blended with other ingredients to enhance flavor, texture, and overall nutritional value.
- Within the supplements segment, the sports/performance nutrition sub-segment is the primary driver, poised for a 6.85% CAGR during the forecast period. The protein beverage market is currently dominated by dairy and soy products. However, a noticeable shift is occurring, with 30% of US consumers now opting for plant-based protein beverages. In the United Kingdom, 10% of consumers avoid soy due to allergies or intolerances, while another 10% steer clear of it as part of a broader health-conscious choice. Pea protein's allure is further bolstered by the rising popularity of labels like 'gluten-free' and 'GMO-free.' Pea protein is particularly well-placed in the sports nutrition industry due to its impressive amino acid profile. The animal feed segment is the second-largest consumer of pea protein globally, following closely behind the food and beverage industry. In 2022, pea protein isolates, capturing a substantial 41.97% volume share, led the charge in animal feed applications. Its digestibility and naturally low antitrypsin activity make pea protein a preferred choice, especially in young animal nutrition, notably in piglets. Numerous studies underscore the palatability and growth benefits of a diet rich in pea protein.
Pea protein is gaining popularity as a substitute for egg protein, supported by widespread veganism across the region
- Asia-Pacific dominates the global pea protein market, driven by the F&B segment, which accounted for 95% of the market share by volume in 2022. In addition, pea protein provides enough viscosity and creaminess, so local manufacturers use pea protein as a substitute for eggs in products like mayonnaise. Pea protein has been touted as a label-friendly, gluten-free, and soy-free alternative. Along with holding the largest share, Asia-Pacific is growing significantly and is expected to record a CAGR of 6.53% during the forecast period.
- Asia-Pacific is followed by Europe, primarily led by the F&B segment, which accounted for about 93% of pea proteins used in the region in 2022. The demand for pea protein as an alternative source of protein has been growing as vegan diets are becoming more popular in the region's developed countries. Germany remained the largest consumer of pea protein during the study period due to rising veganism and consumers' growing reliance on alternative meat products.
- The Middle East is projected to be the fastest-growing regional segment, as the demand for natural and sustainable ingredients is rapidly growing due to the rise in health consciousness among consumers. Over the forecast period, the region is expected to record a CAGR of 12.21% by volume. Saudi Arabia primarily drives the Middle Eastern pea protein market due to increasing awareness of pea protein use, causing the country's population to adopt it in their diets. However, these proteins have applications in the F&B segment, which was majorly driven by the meat and meat alternative products sub-segment, with a 37% share by volume in 2022.
Global Pea Protein Ingredients Market Trends
Due to several health benefits of plant protein-based diets, customers are moving toward vegan offerings
- Globally, consumers are shifting their dietary preferences. Notably, there is a growing preference for dairy and meat alternatives, especially among consumers in Europe and North America. In 2022, Europe led the way with plant-based milk accounting for 38% of total plant-based food sales, followed closely by plant-based meat. This evolving trend is boosting the number of flexitarian and vegan consumers and opening doors for manufacturers to innovate within the plant protein sector.
- The popularity of plant-based protein alternatives is due to their nutritional value and stems from growing concerns over environmental impact, ethics, and health. Proteins, known for their slower digestion compared to carbohydrates, play a crucial role in weight management by promoting a longer-lasting feeling of fullness with fewer calories. A new study reveals that over one billion people globally were living with obesity between 2022 and 2023.
- Moreover, the rising engagement of the younger population in sports and fitness activities, coupled with a growing trend of fortifying food and beverages with functional ingredients for added health benefits, is fueling the demand for plant-based proteins. In 2023, a record-high 242 million Americans aged 6 and older (nearly 80% of the population) participated in at least one sport or fitness activity, a 2.2% increase from 2022. This active lifestyle shift is driving the demand for plant-based protein food products. Furthermore, government initiatives, such as Canada's Health Ministry, which revamped its food guide, emphasizing three key categories: vegetables and fruits, whole grains, and plant-based proteins, are driving awareness and demand for alternative proteins among consumers.
North America dominates the global dry pea production, driven by Canada
- Dry peas are the primary source for extracting pea protein, with Canada leading the production, closely followed by the United States. In Canada, provinces like Saskatchewan, Alberta, and Manitoba lead dry pea production. Notably, North American pea production surged 32% from 2015 to 2020. By 2020, the region's focus had shifted significantly toward dried peas, claiming a dominant 95% share of the total pea production. Conversely, the United States faced production challenges, primarily from reduced seeding in North Dakota, diminished yields, and higher abandonment rates. In its 2020-2021 forecast, the USDA anticipated a 17% drop in US dry pea production, settling just above 0.8 million metric tons.
- In Asia-Pacific, China leads the pea production, closely trailed by India. China boasts two key dried pea production hubs: the Northern and Southern Dried Pea-producing Areas. Provinces like Ningxia, Gansu, Yunnan, and Qinghai collectively contribute over 70% to China's dried pea output. Shifting to India, the country's dry pea production hit 100,440.2 tons in 2022, marking a notable 23.72% increase from the 2019 figure of 811,810 tons.
- Aside from the dominant players, countries like Russia, France, Ukraine, and Australia also hold significant global dry pea production positions. Notably, yellow peas are in substantial cultivation, especially in eastern Australia. While historically, Victoria and South Australia led Australian pea production, Western Australia has seen a remarkable surge in production, attributed to advancements in both varieties and production techniques.
Pea Protein Ingredients Industry Overview
The Pea Protein Ingredients Market is fragmented, with the top five companies occupying 21.95%. The major players in this market are Archer Daniels Midland Company, Cargill Incorporated, Ingredion Incorporated, International Flavors & Fragrances, Inc. and Kerry Group (sorted alphabetically).
Additional Benefits:
- The market estimate (ME) sheet in Excel format
- 3 months of analyst support
TABLE OF CONTENTS
1 EXECUTIVE SUMMARY & KEY FINDINGS
2 INTRODUCTION
- 2.1 Study Assumptions & Market Definition
- 2.2 Scope of the Study
- 2.3 Research Methodology
3 KEY INDUSTRY TRENDS
- 3.1 End User Market Volume
- 3.1.1 Baby Food and Infant Formula
- 3.1.2 Bakery
- 3.1.3 Beverages
- 3.1.4 Breakfast Cereals
- 3.1.5 Condiments/Sauces
- 3.1.6 Confectionery
- 3.1.7 Dairy and Dairy Alternative Products
- 3.1.8 Elderly Nutrition and Medical Nutrition
- 3.1.9 Meat/Poultry/Seafood and Meat Alternative Products
- 3.1.10 RTE/RTC Food Products
- 3.1.11 Snacks
- 3.1.12 Sport/Performance Nutrition
- 3.1.13 Animal Feed
- 3.1.14 Personal Care and Cosmetics
- 3.2 Protein Consumption Trends
- 3.2.1 Plant
- 3.3 Production Trends
- 3.3.1 Plant
- 3.4 Regulatory Framework
- 3.4.1 China
- 3.4.2 Germany
- 3.4.3 India
- 3.4.4 Japan
- 3.4.5 United States
- 3.5 Value Chain & Distribution Channel Analysis
4 MARKET SEGMENTATION (includes market size in Value in USD and Volume, Forecasts up to 2030 and analysis of growth prospects)
- 4.1 Form
- 4.1.1 Concentrates
- 4.1.2 Isolates
- 4.1.3 Textured/Hydrolyzed
- 4.2 End User
- 4.2.1 Animal Feed
- 4.2.2 Food and Beverages
- 4.2.2.1 By Sub End User
- 4.2.2.1.1 Bakery
- 4.2.2.1.2 Beverages
- 4.2.2.1.3 Breakfast Cereals
- 4.2.2.1.4 Condiments/Sauces
- 4.2.2.1.5 Confectionery
- 4.2.2.1.6 Dairy and Dairy Alternative Products
- 4.2.2.1.7 Meat/Poultry/Seafood and Meat Alternative Products
- 4.2.2.1.8 RTE/RTC Food Products
- 4.2.2.1.9 Snacks
- 4.2.3 Personal Care and Cosmetics
- 4.2.4 Supplements
- 4.2.4.1 By Sub End User
- 4.2.4.1.1 Baby Food and Infant Formula
- 4.2.4.1.2 Elderly Nutrition and Medical Nutrition
- 4.2.4.1.3 Sport/Performance Nutrition
- 4.3 Region
- 4.3.1 Africa
- 4.3.1.1 By Form
- 4.3.1.2 By End User
- 4.3.1.3 By Country
- 4.3.1.3.1 Nigeria
- 4.3.1.3.2 South Africa
- 4.3.1.3.3 Rest of Africa
- 4.3.2 Asia-Pacific
- 4.3.2.1 By Form
- 4.3.2.2 By End User
- 4.3.2.3 By Country
- 4.3.2.3.1 Australia
- 4.3.2.3.2 China
- 4.3.2.3.3 India
- 4.3.2.3.4 Indonesia
- 4.3.2.3.5 Japan
- 4.3.2.3.6 Malaysia
- 4.3.2.3.7 New Zealand
- 4.3.2.3.8 South Korea
- 4.3.2.3.9 Thailand
- 4.3.2.3.10 Vietnam
- 4.3.2.3.11 Rest of Asia-Pacific
- 4.3.3 Europe
- 4.3.3.1 By Form
- 4.3.3.2 By End User
- 4.3.3.3 By Country
- 4.3.3.3.1 Belgium
- 4.3.3.3.2 France
- 4.3.3.3.3 Germany
- 4.3.3.3.4 Italy
- 4.3.3.3.5 Netherlands
- 4.3.3.3.6 Russia
- 4.3.3.3.7 Spain
- 4.3.3.3.8 Turkey
- 4.3.3.3.9 United Kingdom
- 4.3.3.3.10 Rest of Europe
- 4.3.4 Middle East
- 4.3.4.1 By Form
- 4.3.4.2 By End User
- 4.3.4.3 By Country
- 4.3.4.3.1 Iran
- 4.3.4.3.2 Saudi Arabia
- 4.3.4.3.3 United Arab Emirates
- 4.3.4.3.4 Rest of Middle East
- 4.3.5 North America
- 4.3.5.1 By Form
- 4.3.5.2 By End User
- 4.3.5.3 By Country
- 4.3.5.3.1 Canada
- 4.3.5.3.2 Mexico
- 4.3.5.3.3 United States
- 4.3.5.3.4 Rest of North America
- 4.3.6 South America
- 4.3.6.1 By Form
- 4.3.6.2 By End User
- 4.3.6.3 By Country
- 4.3.6.3.1 Argentina
- 4.3.6.3.2 Brazil
- 4.3.6.3.3 Rest of South America
- 4.3.1 Africa
5 COMPETITIVE LANDSCAPE
- 5.1 Key Strategic Moves
- 5.2 Market Share Analysis
- 5.3 Company Landscape
- 5.4 Company Profiles (includes Global Level Overview, Market Level Overview, Core Business Segments, Financials, Headcount, Key Information, Market Rank, Market Share, Products and Services, and Analysis of Recent Developments).
- 5.4.1 Archer Daniels Midland Company
- 5.4.2 Cargill Incorporated
- 5.4.3 Cosucra Groupe Warcoing SA
- 5.4.4 Emsland Group
- 5.4.5 Ingredion Incorporated
- 5.4.6 International Flavors & Fragrances, Inc.
- 5.4.7 Kerry Group
- 5.4.8 Roquette Frere
- 5.4.9 Yantai Shuangta Food Co. Ltd
6 KEY STRATEGIC QUESTIONS FOR PROTEIN INGREDIENTS INDUSTRY CEOS
7 APPENDIX
- 7.1 Global Overview
- 7.1.1 Overview
- 7.1.2 Porter's Five Forces Framework
- 7.1.3 Global Value Chain Analysis
- 7.1.4 Market Dynamics (DROs)
- 7.2 Sources & References
- 7.3 List of Tables & Figures
- 7.4 Primary Insights
- 7.5 Data Pack
- 7.6 Glossary of Terms
