
|
市場調査レポート
商品コード
1690971
米国のエンドウ豆たんぱく質:市場シェア分析、産業動向・統計、成長予測(2025年~2030年)United States Pea Protein - Market Share Analysis, Industry Trends & Statistics, Growth Forecasts (2025 - 2030) |
||||||
カスタマイズ可能
適宜更新あり
|
|||||||
| 米国のエンドウ豆たんぱく質:市場シェア分析、産業動向・統計、成長予測(2025年~2030年) |
|
出版日: 2025年03月18日
発行: Mordor Intelligence
ページ情報: 英文 219 Pages
納期: 2~3営業日
|

全表示
- 概要
- 目次
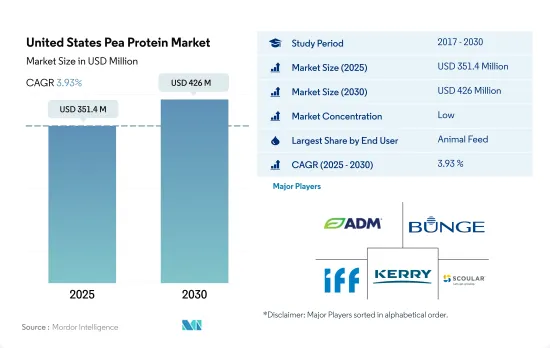
米国のエンドウ豆たんぱく質の市場規模は、2025年には3億5,140万米ドルと推定され、2030年には4億2,600万米ドルに達すると予測され、予測期間中(2025-2030年)のCAGRは3.93%で成長する見込みです。
さまざまな産業でエンドウ豆たんぱく質の構造的機能性を活用するメーカー
- 動物飼料に次いで、F&Bは依然として第2位のセグメントであり、主に食肉代替産業が牽引しています。2022年にF&Bセクターで消費されたエンドウ豆たんぱく質の量の38.3%以上を占めるのはこの業界だけです。これは、肉と同様のアミノ酸プロファイルや、大豆のような主流ソースとは一線を画す低アレルギー性品質など、エンドウ豆たんぱく質が提供する特性に起因しています。ライトライフ・フーズ(Lightlife Foods)やビヨンド・ミート(Beyond Meat)のような主要な製剤メーカーは、エンドウ豆たんぱく質を主原料とする、植物由来の代替肉をますます開発しつつあります。
- 数多くの機能性に加えて、エンドウ豆たんぱく質は高温下でも構造的機能性を失わないです。また、このセグメントは最も急速に成長しており、2023年から2029年までの予測数量CAGRは8.56%です。エンドウ豆たんぱく質の利用は米国のスナック菓子市場で大きな成長が見込まれます。高タンパク、低脂肪、低炭水化物は、スナック企業が製品特性に加えようとする新しい動向キーワードです。ピー・プロテインを原材料とするスナックを提供する主要ブランドには、Siren Snacks、Larabar、Simply Proteinなどがあります。
- エンドウ豆たんぱく質のもう一つの急成長サブセグメントは、スポーツ・パフォーマンス栄養製品カテゴリーであり、2023年から2029年にかけてCAGR 8.12%を記録すると予測されています。一部のフィットネス支持者は、菜食主義者やベジタリアンのたんぱく質消費量を増やすためにエンドウ豆たんぱく質を推奨しています。エンドウ豆たんぱく質に含まれるアミノ酸は、動物性たんぱく質に含まれるアミノ酸とほぼ同様に利用できます。乳製品や大豆に比べ、エンドウ豆はアレルギーを引き起こしにくく、乳糖不耐症を悪化させないです。
米国のエンドウ豆たんぱく質市場動向
植物性たんぱく質消費の成長は、原料市場の主要企業に機会を提供します。
- 米国では、投資と技術革新に支えられて、一人当たりの植物性たんぱく質消費量がかなりの割合で増加しており、その結果、消費量は一日当たり40.28グラムに達しています。米国では、動物が虐待される工場畜産が常態化しているからです。多くのアメリカ人は肉や動物性食品の摂取量を減らしているが、完全に排除しているわけではないです。また、ビーガンやベジタリアンよりもフレキシタリアンである傾向が強いです。米国では12%近くの消費者が植物性の食事を好み、7%の消費者がフレキシタリアンです。米国ではあらゆる世代の消費者が植物ベースの食事に関心を持っているが、20代と30代が最も植物ベースの食事に熱心です。
- 肉、鶏肉、ベーカリー製品など、さまざまな食品に幅広く利用されているため、一人当たりの豆タンパク消費量は常に増加しています。約41%の消費者がエンドウタンパク由来の植物性食品に関心を持っています。エンドウ豆たんぱく質は主にスポーツ栄養や肉の代替食品に使用されています。エンドウ豆たんぱく質パウダーの典型的な1食分は30グラムで、25グラムのたんぱく質が含まれています。アスリートは通常1日1食を使用するが、1日3食摂取することもあります。
- 大豆プロテインと乳清プロテインは、主に飲食品、サプリメント、スポーツ栄養産業で使用されています。2021年には、約36%の消費者が大豆たんぱく質を知っており、摂取したことがあるのに対し、米国では31%の人がホエイプロテインを摂取していました。同様に、大豆ベースの飲食品消費は2014年から2019年にかけて12.9%増加し、予測期間中も一貫して増加し続けると思われます。
米国は世界の主要エンドウ豆生産国のひとつ
- 乾燥エンドウ豆はエンドウ豆たんぱく質抽出の主要原料源と考えられており、上記の生産データは乾燥エンドウ豆のみのものです。ほとんどの農家が輪作を助けるためにエンドウ豆を植えているため、同国ではエンドウ豆の生産が盛んです。ビヨンド・ミート社やインポッシブル・バーガーを筆頭に、多くのメーカーが主要原材料のひとつとしてエンドウ豆たんぱく質を使用しています。その結果、米国におけるエンドウ豆の生産量は2017年から2020年にかけて約42%増加しました。エンドウ豆たんぱく質は、スナックやシリアルの安定剤としてグルテンの代わりにもなります。グルテンは場合によっては腸の炎症を引き起こすと考えられているため、広範な調査の結果、エンドウ豆たんぱく質はグルテンフリー市場にも参入しています。
- データによると、米国の生産者は、例年より20%ほど多くソラマメを播種する見込みです。米国の農家はまた、トウモロコシ、大豆、小麦などの主要作物の栽培面積を約3%削減しました。2019年、モンタナ州のドライエンドウ栽培面積は198,300haと推定され、前年より44%増加しました。ノースダコタ州の乾燥エンドウ豆栽培面積は163,900haと推定され、前年より8%増加しました。中米北部では、エンドウ豆の作付けはイエロー(70%)とグリーン(30%)のカテゴリーに分類され、イエローエンドウはエンドウ豆たんぱく質を生産するための原料として最も使用されています。
- USA Dry Pea and Lentil Councilによると、米国では、ひよこ豆にシフトしていた生産者の一部が、乾燥苗エンドウを代わりに使用するようになりました。エンドウ豆たんぱく質市場のメーカーも、消費者の変化するニーズや需要を満たすため、先進技術を駆使した新しく革新的な製品の開発に力を入れています。エンドウ豆に含まれる特定のアミノ酸のレベルが高いため、技術革新によってもたらされる可能性を利用する機会を各社に提供しています。
米国のエンドウ豆たんぱく質産業概要
米国のエンドウ豆たんぱく質市場は断片化されており、上位5社で25.91%を占めています。この市場の主要企業は以下の通りです。 Archer Daniels Midland Company, Bunge Limited, International Flavors & Fragrances, Inc., Kerry Group PLC and The Scoular Company(sorted alphabetically).
その他の特典
- エクセル形式の市場予測(ME)シート
- 3ヶ月のアナリストサポート
目次
第1章 エグゼクティブサマリーと主な調査結果
第2章 イントロダクション
- 調査の前提条件と市場定義
- 調査範囲
- 調査手法
第3章 主要産業動向
- エンドユーザー市場規模
- ベビーフードおよび乳児用調製粉乳
- ベーカリー
- 飲料
- 朝食用シリアル
- 調味料/ソース
- 菓子類
- 乳製品および乳製品代替製品
- 高齢者栄養・医療栄養
- 肉・鶏肉・魚介類および肉代替製品
- RTE/RTC食品
- スナック
- スポーツ/パフォーマンス栄養
- 動物飼料
- パーソナルケアと化粧品
- たんぱく質消費動向
- 植物
- 生産動向
- 植物
- 規制の枠組み
- 米国
- バリューチェーンと流通チャネル分析
第4章 市場セグメンテーション
- 形態
- 濃縮物
- アイソレート
- テクスチャー/加水分解
- エンドユーザー
- 飼料
- 飲食品
- サブエンドユーザー別
- ベーカリー
- 飲料
- 朝食用シリアル
- 調味料/ソース
- 菓子類
- 乳製品・乳製品代替品
- 肉・鶏肉・魚介類および肉代替製品
- RTE/RTC食品
- スナック
- パーソナルケアと化粧品
- サプリメント
- サブエンドユーザー別
- ベビーフードおよび乳児用調製乳
- 高齢者栄養と医療栄養
- スポーツ/パフォーマンス栄養
第5章 競合情勢
- 主要な戦略動向
- 市場シェア分析
- 企業情勢
- 企業プロファイル.
- AGT Food and Ingredients Inc.
- Anchor Ingredients Co. LLC
- Archer Daniels Midland Company
- Axiom Foods Inc.
- Bunge Limited
- Cargill Incorporated
- Farbest-Tallman Foods Corporation
- Glanbia PLC
- Ingredion Incorporated
- International Flavors & Fragrances, Inc.
- Kerry Group PLC
- Roquette Freres
- The Scoular Company
第6章 CEOへの主な戦略的質問
第7章 付録
- 世界概要
- 概要
- ファイブフォース分析フレームワーク
- 世界のバリューチェーン分析
- 市場力学(DROs)
- 情報源と参考文献
- 図表一覧
- 主要洞察
- データパック
- 用語集
The United States Pea Protein Market size is estimated at 351.4 million USD in 2025, and is expected to reach 426 million USD by 2030, growing at a CAGR of 3.93% during the forecast period (2025-2030).
Manufacturers taking advantage of pea protein's structural functionality in various industries
- After animal feed, F&B remains the second-largest segment, majorly led by the meat alternative industry. The industry alone accounted for over 38.3% of pea protein volume consumed by the F&B sector in 2022. This can be attributed to properties offered by pea protein, including a similar amino acid profile as meat and its hypoallergenic quality that sets it apart and above mainstream sources such as soy. Key formulators like Lightlife Foods and Beyond Meat are increasingly coming up with plant-based meat alternatives, with pea protein being a major ingredient.
- Apart from its numerous functionalities, pea protein does not lose structural functionality under high temperatures, which is the primary factor driving its demand in the F&B segment. The segment also remained the fastest growing, with a projected volume CAGR of 8.56% between 2023 and 2029. The utilization of pea protein is expected to see significant growth in the US snacks market. High-protein, low-fat, and low-carb are the new trending keywords that snack companies look to add to their product characteristics. Some major brands offering snacks with pea protein as an ingredient are Siren Snacks, Larabar, and Simply Protein.
- Another fast-growing sub-segment for pea proteins is the sports and performance nutrition products category, which is projected to register a CAGR of 8.12% from 2023-2029. Some fitness proponents recommend pea protein to increase vegans' and vegetarians' protein consumption. The amino acids in pea proteins can be utilized almost as well as those found in animal proteins. Compared to dairy and soy, peas are less likely to cause allergies, do not worsen lactose intolerance, and, unlike soy, are usually not made from GMO plants.
United States Pea Protein Market Trends
Growth in plant protein consumption provides opportunities for key players in the ingredients market
- The per capita consumption rate of plant proteins is increasing at a considerable rate in the United States, supported by investments and innovations, resulting in a consumption rate of 40.28 grams per day, primarily due to a rising number of consumers turning vegan to promote animal welfare. This is because factory farming, where animals are maltreated, is a norm in the United States. Most Americans eat less meat and animal products, but they do not eliminate their consumption entirely. They also tend to be more flexitarian than vegan or vegetarian. Nearly 12% of consumers in the country prefer a plant-based diet, whereas 7% of consumers follow a flexitarian diet. Although consumers of all generations in the United States are interested in plant-based meals, individuals in their 20s and 30s are the keenest to adopt plant-based diets.
- There is a constant rise in the per capita consumption of pea protein due to its wide applications in different food products, like meat, poultry, and bakery products. Around 41% of consumers are interested in plant-based food derived from pea protein. Pea protein is mainly used in sports nutrition and meat alternatives. A typical serving of pea protein powder is 30 grams, with 25 grams of protein. Athletes usually use one serving per day but may take as many as three servings per day.
- Soy and whey proteins are used primarily in the food and beverage, supplement, and sports nutrition industries. In 2021, around 36% of consumers were familiar with soy protein and had consumed the same, whereas 31% of individuals consumed whey protein in the US. Similarly, the consumption of soy-based food and beverages favorably increased by 12.9% during 2014-2019, and it is likely to remain consistent throughout the forecast period.
The United States is one of the major pea producers globally
- Dry peas are considered the major raw material source for pea protein extraction, and the production data mentioned above is for dry peas only. As most farmers are planting peas to help crop rotation, pea production is flourishing in the country. Many manufacturers have been using pea protein as one of the major ingredients, especially Beyond Meat Inc. and Impossible Burgers. As a result, the production of peas in the United States increased by around 42% from 2017 to 2020. Pea protein can also substitute gluten as a stabilizer in snacks and cereals. After extensive research, pea protein is also entering the gluten-free market, as gluten is believed to cause intestine inflammation in some cases.
- Data shows that growers in the United States are expected to seed about 20% more field peas than in previous years. US farmers also cut acres of principal crops, including corn, soy, and wheat, by about 3%. In 2019, Montana's cultivated dry pea area was estimated at 198,300 ha, up by 44% from the previous year. The cultivated dry pea area in North Dakota was estimated at 163,900 ha, up by 8% from the previous year. In northern Central America, pea crops fall under the yellow (70%) and green (30%) categories, where yellow peas are the most used raw material to produce pea protein.
- According to the USA Dry Pea and Lentil Council, in the United States, some of the growers who had shifted to chickpeas ended up using dry seedling peas instead. Manufacturers in the pea protein market are also more focused on developing new and innovative offerings to fulfill consumers' changing needs and demands by using advanced technologies. As there is a higher level of certain amino acids in peas, it provides an opportunity for the players to tap into the potential posed by innovation.
United States Pea Protein Industry Overview
The United States Pea Protein Market is fragmented, with the top five companies occupying 25.91%. The major players in this market are Archer Daniels Midland Company, Bunge Limited, International Flavors & Fragrances, Inc., Kerry Group PLC and The Scoular Company (sorted alphabetically).
Additional Benefits:
- The market estimate (ME) sheet in Excel format
- 3 months of analyst support
TABLE OF CONTENTS
1 EXECUTIVE SUMMARY & KEY FINDINGS
2 INTRODUCTION
- 2.1 Study Assumptions & Market Definition
- 2.2 Scope of the Study
- 2.3 Research Methodology
3 KEY INDUSTRY TRENDS
- 3.1 End User Market Volume
- 3.1.1 Baby Food and Infant Formula
- 3.1.2 Bakery
- 3.1.3 Beverages
- 3.1.4 Breakfast Cereals
- 3.1.5 Condiments/Sauces
- 3.1.6 Confectionery
- 3.1.7 Dairy and Dairy Alternative Products
- 3.1.8 Elderly Nutrition and Medical Nutrition
- 3.1.9 Meat/Poultry/Seafood and Meat Alternative Products
- 3.1.10 RTE/RTC Food Products
- 3.1.11 Snacks
- 3.1.12 Sport/Performance Nutrition
- 3.1.13 Animal Feed
- 3.1.14 Personal Care and Cosmetics
- 3.2 Protein Consumption Trends
- 3.2.1 Plant
- 3.3 Production Trends
- 3.3.1 Plant
- 3.4 Regulatory Framework
- 3.4.1 United States
- 3.5 Value Chain & Distribution Channel Analysis
4 MARKET SEGMENTATION (includes market size in Value in USD and Volume, Forecasts up to 2030 and analysis of growth prospects)
- 4.1 Form
- 4.1.1 Concentrates
- 4.1.2 Isolates
- 4.1.3 Textured/Hydrolyzed
- 4.2 End User
- 4.2.1 Animal Feed
- 4.2.2 Food and Beverages
- 4.2.2.1 By Sub End User
- 4.2.2.1.1 Bakery
- 4.2.2.1.2 Beverages
- 4.2.2.1.3 Breakfast Cereals
- 4.2.2.1.4 Condiments/Sauces
- 4.2.2.1.5 Confectionery
- 4.2.2.1.6 Dairy and Dairy Alternative Products
- 4.2.2.1.7 Meat/Poultry/Seafood and Meat Alternative Products
- 4.2.2.1.8 RTE/RTC Food Products
- 4.2.2.1.9 Snacks
- 4.2.3 Personal Care and Cosmetics
- 4.2.4 Supplements
- 4.2.4.1 By Sub End User
- 4.2.4.1.1 Baby Food and Infant Formula
- 4.2.4.1.2 Elderly Nutrition and Medical Nutrition
- 4.2.4.1.3 Sport/Performance Nutrition
5 COMPETITIVE LANDSCAPE
- 5.1 Key Strategic Moves
- 5.2 Market Share Analysis
- 5.3 Company Landscape
- 5.4 Company Profiles (includes Global Level Overview, Market Level Overview, Core Business Segments, Financials, Headcount, Key Information, Market Rank, Market Share, Products and Services, and Analysis of Recent Developments).
- 5.4.1 AGT Food and Ingredients Inc.
- 5.4.2 Anchor Ingredients Co. LLC
- 5.4.3 Archer Daniels Midland Company
- 5.4.4 Axiom Foods Inc.
- 5.4.5 Bunge Limited
- 5.4.6 Cargill Incorporated
- 5.4.7 Farbest-Tallman Foods Corporation
- 5.4.8 Glanbia PLC
- 5.4.9 Ingredion Incorporated
- 5.4.10 International Flavors & Fragrances, Inc.
- 5.4.11 Kerry Group PLC
- 5.4.12 Roquette Freres
- 5.4.13 The Scoular Company
6 KEY STRATEGIC QUESTIONS FOR PROTEIN INGREDIENTS INDUSTRY CEOS
7 APPENDIX
- 7.1 Global Overview
- 7.1.1 Overview
- 7.1.2 Porter's Five Forces Framework
- 7.1.3 Global Value Chain Analysis
- 7.1.4 Market Dynamics (DROs)
- 7.2 Sources & References
- 7.3 List of Tables & Figures
- 7.4 Primary Insights
- 7.5 Data Pack
- 7.6 Glossary of Terms

