
|
市場調査レポート
商品コード
1693697
アジア太平洋のエンドウ豆タンパク質の市場シェア分析、産業動向、成長予測(2025年~2030年)Asia-Pacific Pea Protein - Market Share Analysis, Industry Trends & Statistics, Growth Forecasts (2025 - 2030) |
||||||
カスタマイズ可能
適宜更新あり
|
|||||||
| アジア太平洋のエンドウ豆タンパク質の市場シェア分析、産業動向、成長予測(2025年~2030年) |
|
出版日: 2025年03月18日
発行: Mordor Intelligence
ページ情報: 英文 243 Pages
納期: 2~3営業日
|

全表示
- 概要
- 目次
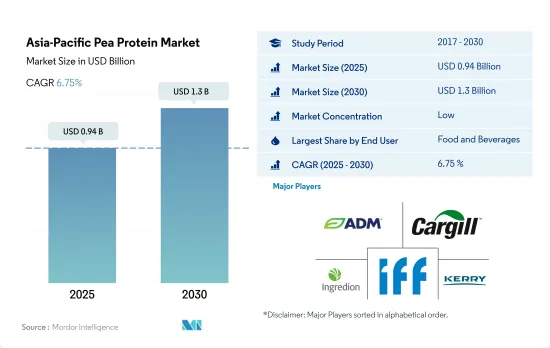
アジア太平洋のエンドウ豆タンパク質市場規模は2025年に9億4,000万米ドルと推定され、2030年には13億米ドルに達すると予測され、予測期間(2025~2030年)のCAGRは6.75%で成長すると予測されます。
F&Bセグメントは、食肉代替製品の旺盛な需要により2022年に大きなシェアを占め、同セグメントは2023~2024年にかけて前年比成長率5.38%を記録すると予想されます。
- エンドウ豆タンパク質の需要は飲食品セグメントに大きく支配されており、予測期間中に数量ベースでCAGR 6.77%を記録すると予想されます。主に食肉代替製品による成長が見られ、2023年の数量シェアは70.34%でした。これらは予測期間中に数量ベースでCAGR 7.07%を記録すると予想されます。この増加は、低アレルギー性の品質と肉と同様のアミノ酸プロファイルによるものです。
- エンドウ豆のタンパク質は、筋力を向上させ、除脂肪体重を増やし、回復を最適化することで、運動能力を高めることが証明されています。エンドウ豆から得られるタンパク質成分には50%~85%のタンパク質が含まれ、特に必須分岐鎖アミノ酸(BCAA;ロイシン、イソロイシン、バリン)が豊富で、筋タンパク質の合成に重要な役割を果たすことが知られています。その結果、2023年のサプリメントセグメントでは、スポーツ・栄養サブセグメントが74.15%の市場数量シェアで首位を占めました。健康志向の消費者がエンドウ豆タンパク質のような植物由来原料を使用したクリーンラベルのサプリメントにシフトしているため、体力をサポートするためのアクティブなライフスタイルの採用が増加しており、有利な市場機会が創出されると推定されます。
- 動物飼料セグメントにおけるエンドウ豆タンパク質の売上は、予測期間中に金額で8.77%の最速CAGRで推移すると推定されます。エンドウ豆タンパク質は、非遺伝子組み換え、穀物不使用、低アレルギー性、持続可能であるため、プレミアムペットフードの高品質植物性タンパク質源とみなすことができます。Nestle Purina PetCareのような大手ペットフード企業による投資は、この地域の動物飼料セグメントに潜在的な成長機会を提供すると推定されます。2022年4月、同社はオーストラリアのBlayneyにある製造工場をアップグレードするために6,000万米ドル以上の投資を発表しました。
人口の間で植物性食品の動向が高まっているため、2022年には中国とインドが合計で主要シェアを占める
- 中国はアジア太平洋のエンドウ豆タンパク質原料市場の支配的な国であり続けた。また、予測期間中、数量ベースで最も速いCAGR 9.36%を記録すると予想されています。これは、同国の植物由来市場の成長と、大豆や小麦タンパク質などの主流原料に関連するアレルゲンの課題によるものです。ヴィーガン食品産業を支援する規制状況の進展は、中国におけるエンドウ豆タンパク質原料の需要を促進すると推定されます。2023年、中国ヴィーガン協会は中国初のプログラムである中国ヴィーガン食品認証(CVFC)を導入し、製品によるヴィーガンの主張を標準化して消費者の信頼を高めることを目的としています。
- インドでは、F&Bセグメントからの高い需要が市場を牽引しました。予測期間中のCAGRは金額ベースで6.68%を記録すると予想されます。ベーカリーとスナックは、エンドウ豆タンパク質のようなクリーンな原料を使ったベーカリー製品の需要急増に支えられ、最速の成長が予測されます。ベーカリーセグメントにおけるエンドウ豆タンパク質材料の売上は、予測期間中にCAGR 10.95%を記録し、2029年には350万米ドルに達すると予測されます。
- オーストラリアはエンドウ豆タンパク質市場で2番目に急成長している国であり、予測期間中に金額ベースで7.71%のCAGRで推移すると予測されています。菜食主義の消費者の食事要件を満たすために、植物性タンパク質原料へのシフトが増加していることが、オーストラリアのエンドウ豆タンパク質市場の主要な市場の促進要因として特定されています。ドライエンドウ豆を含む穀物や豆類を栽培するためのサステイナブル農法は、エンドウ豆タンパク質成分の生産に利用可能な高品質の原料を実証しています。
アジア太平洋のエンドウ豆タンパク質の市場動向
植物性タンパク質の消費拡大が植物性タンパク質原料セグメントの主要企業に機会を与える
- アジア太平洋では、植物性タンパク質の有用性に対する認識と証明が高まっており、植物性タンパク質はアジア太平洋市場で関心を集めています。すべての植物性タンパク質の中で、大豆タンパク質は、様々な食品における原料の受容性の向上とその生産量の増加により、市場シェアを占めています。2020~2021年の中国の大豆粕消費量は72.68百万MTで、2018年より約9%増加しました。研究への高額の投資、急速な技術進歩、先進的イノベーション技術が、大豆タンパク質を含む開発されたタンパク質原料の使用をもたらしている主要因の一部です。
- 大豆、エンドウ豆、麻、ジャガイモなどのアレルゲンフリー植物性タンパク質の主要促進要因は、ベジタリアンライフスタイルの採用の増加、ラクトースフリーとグルテンフリー製品に対する需要の増加、健康に関連する問題に対する懸念の高まりです。2021年には、インドの消費者の約81%が肉食を控えています。動物性タンパク質に対する植物性タンパク質原料の主要利点には、高い栄養価、数種類のビタミンとミネラルの優れた供給源であること、様々な食品産業における技術の進歩、天然と有機代替物に対する需要の増加などがあり、これらは消費者の嗜好を変化させると予想されます。
- 同地域における植物性タンパク質の消費の増加と消費者の受容は、メーカーがこれらの成分を強化した製品を革新する原動力となっています。日本で消費される主要穀物は大豆、米、小麦で、トウモロコシやエンドウ豆など他タイプもあります。植物性タンパク質の増加は、今後数年間も食品メーカーに機会を提供し続けると予想されます。
中国はアジア太平洋最大の乾燥エンドウ豆生産国
- 乾燥エンドウ豆は、エンドウ豆タンパク質抽出の主要原料源と考えられており、上記の生産データは乾燥エンドウ豆のみのものです。上のグラフは、中国、インド、日本、オーストラリア、ニュージーランド、韓国を含む国々における乾燥エンドウ豆の総生産量を表しています。中国はアジア太平洋で最大の乾燥エンドウ豆生産国です。中国には2つの主要な乾燥エンドウ豆生産地域があります。北部乾燥エンドウ豆生産地域と南部乾燥エンドウ豆生産地域です。寧夏、甘粛、クラウド南、青海省は中国の主要な乾燥エンドウ豆生産地で、乾燥エンドウ豆総生産量の70%以上を占めています。
- インドは中国に次いでアジア太平洋で第2位のエンドウ豆生産国であり、世界最大のひよこ豆生産国でもあります。インドで栽培されているエンドウ豆は、イエロー、グリーン、ダム、カスパの4種類です。2022年の乾燥エンドウ豆生産量は100万4,402トンで、2019年の81万1,810トンから約23.72%増加しました。ウッタル・プラデシュ州、マディヤ・プラデシュ州、パンジャブ州が主要エンドウ豆生産州で、2022年の国内エンドウ豆総生産量の約70%を占めます。
- オーストラリアでは、dun pea、yellow pea、maple peaなど数種類のエンドウ豆が栽培されています。ビクトリア州と南オーストラリア州は歴史的にオーストラリア最大のソラマメ生産地であったが、より優れた品種と生産技術の向上により、最近では西オーストラリア州で生産量が大幅に拡大しています。
- 日本の農業における豆類の生産量は少ないが、日本の伝統的食文化においてその存在は大きいです。グリーンピースの生産量も非常に少ないです。乾燥エンドウ豆の生産量は非常に少なく、主に北海道で限られています。
アジア太平洋のエンドウ豆タンパク質産業概要
アジア太平洋のエンドウ豆タンパク質市場はセグメント化されており、上位5社で11.55%を占めています。この市場の主要企業は、Archer Daniels Midland Company、Cargill、Incorporated、Ingredion Incorporated、International Flavors & Fragrances Inc.、Kerry Group PLCなどです。
その他の特典
- エクセル形式の市場予測(ME)シート
- 3ヶ月間のアナリストサポート
目次
第1章 エグゼクティブサマリーと主要調査結果
第2章 イントロダクション
- 調査の前提条件と市場定義
- 調査範囲
- 調査手法
第3章 主要産業動向
- エンドユーザー市場規模
- ベビーフードと乳児用調製粉乳
- ベーカリー
- 飲料
- 朝食用シリアル
- 調味料/ソース
- 菓子類
- 乳製品と乳製品代替製品
- 高齢者栄養・医療栄養
- 肉・鶏肉・魚介類と肉代替製品
- RTE/RTC食品
- スナック
- スポーツ/パフォーマンス栄養
- 動物飼料
- パーソナルケアと化粧品
- タンパク質消費動向
- 植物
- 生産動向
- 植物
- 規制の枠組み
- 中国
- インド
- 日本
- バリューチェーンと流通チャネル分析
第4章 市場セグメンテーション
- 形態
- 濃縮物
- 単離液
- テクスチャー/加水分解
- エンドユーザー
- 飼料
- 飲食品
- サブエンドユーザー別
- ベーカリー
- 飲料
- 朝食用シリアル
- 調味料/ソース
- 菓子類
- 乳製品・乳製品代替品
- 肉・鶏肉・魚介類と肉代替製品
- RTE/RTC食品
- スナック
- パーソナルケアと化粧品
- サプリメント
- サブエンドユーザー別
- ベビーフードと乳児用調製粉乳
- 高齢者栄養と医療栄養
- スポーツ/パフォーマンス栄養
- 国別
- オーストラリア
- 中国
- インド
- インドネシア
- 日本
- マレーシア
- ニュージーランド
- 韓国
- タイ
- ベトナム
- その他のアジア太平洋
第5章 競合情勢
- 主要な戦略動向
- 市場シェア分析
- 企業情勢
- 企業プロファイル
- Archer Daniels Midland Company
- Cargill, Incorporated
- Foodchem International Corporation
- Ingredion Incorporated
- International Flavors & Fragrances Inc.
- Kerry Group PLC
- Roquette Freres
- Shandong Jianyuan Bioengineering Co. Ltd
- Yantai Shuangta Food Co. Ltd
第6章 CEOへの主要戦略的質問
第7章 付録
- 世界概要
- 概要
- ファイブフォース分析フレームワーク
- 世界のバリューチェーン分析
- 市場力学(DROs)
- 情報源と参考文献
- 図表一覧
- 主要な洞察
- データパック
- 用語集
The Asia-Pacific Pea Protein Market size is estimated at 0.94 billion USD in 2025, and is expected to reach 1.3 billion USD by 2030, growing at a CAGR of 6.75% during the forecast period (2025-2030).
F&B segment accounted for a major share in 2022 due to strong demand for meat alternative products; the segment is expected to register Y-o-Y growth of 5.38% from 2023 to 2024
- Pea protein demand is highly dominated by the food and beverage segment, which is anticipated to record a CAGR of 6.77% by volume during the forecast period. Growth is mainly observed from meat alternative products, which held a share of 70.34% by volume in 2023. They are anticipated to record a CAGR of 7.07% by volume during the forecast period. This increase can be due to its hypoallergenic quality and similar amino acid profile to that of meat.
- Pea protein is proven to fuel athletic performance by improving strength, increasing lean muscle mass, and optimizing recovery. Protein ingredients obtained from peas contain 50% to 85% of proteins and are particularly rich in essential branched-chain amino acids (BCAA; leucine, isoleucine, and valine), known to play an important role in muscle protein synthesis. As a result, the sports and nutrition sub-segment accounted for a leading market volume share of 74.15% in the supplements segment in 2023. Increasing adoption of active lifestyles to support physical fitness is estimated to create lucrative market opportunities as health-conscious consumers are shifting toward clean-label supplements made with plant-based ingredients like pea protein.
- The sales of pea protein in the animal feed segment are estimated to register the fastest CAGR of 8.77% in value during the forecast period. Pea protein can be considered a high-quality vegetable protein source in premium pet food because it is non-GMO, grain-free, hypoallergenic, and sustainable. Investment by major pet food companies like Nestle Purina PetCare is estimated to offer potential growth opportunities in the region's animal feed segment. In April 2022, the company announced over USD 60 million in investment to upgrade its manufacturing plant in Blayney, Australia.
China and India collectively accounted for a major share in 2022, owing to the rising trend of plant-based food products among the population
- China remained the dominant country in the Asia-Pacific pea protein ingredients market. It is also expected to register the fastest CAGR of 9.36% by volume during the forecast period. This can be attributed to the country's growing plant-based market and allergen challenges associated with mainstream ingredients, such as soy and wheat proteins. The evolving regulatory landscape to support the vegan food industry is estimated to promote the demand for pea protein ingredients in China. In 2023, the China Vegan Society introduced the China Vegan Food Certification (CVFC), the first program of its kind in China, with the aim of standardizing the vegan claims made by products and increasing consumer trust.
- In India, the market was driven by high demand from the F&B segment. It is expected to record a CAGR of 6.68% by value during the forecast period. Bakery and snacks are projected to obtain the fastest growth, supported by the surging demand for bakery products with clean ingredients like pea protein. The sales of pea protein ingredients in the bakery segment are estimated to register a CAGR of 10.95% during the forecast period, reaching USD 3.5 million in 2029.
- Australia is the second-fastest growing country in the pea protein market, as it is projected to register a CAGR of 7.71% by value during the forecast period. The increasing shift toward plant-protein ingredients to meet the dietary requirements of vegan consumers is identified as the key market driving factor in the Australian pea protein market. The sustainable farming practices to cultivate grains and pulses, including dry peas, demonstrate the availability of quality raw materials for the production of pea protein ingredients.
Asia-Pacific Pea Protein Market Trends
The consumption growth of plant protein fuels opportunities for key players in the plant protein ingredients segment
- Plant proteins are gaining interest in the Asia-Pacific market as awareness and proof of their benefits are rising in the region. Among all plant proteins, soy proteins occupy the market share with the increased acceptability of the ingredients in different foods and their increased production. The volume of soybean meal consumption in China in 2020-21 was 72.68 MMT, which was around 9% more than in 2018. High investments in research, rapid technological advancements, and advanced innovation techniques are some of the major factors resulting in the use of developed protein ingredients, including soy proteins.
- Major drivers of allergen-free plant proteins such as soy, pea, hemp, and potato are the rising adoption of a vegetarian lifestyle, increasing demand for lactose-free and gluten-free products, and growing concerns about health-related problems. Around 81% of Indian consumers restrained meat from their diet in 2021. Major benefits of plant protein ingredients over animal proteins include high nutritional value, being a good source of several vitamins and minerals, technological advancements in various food industries, and increasing demand for natural and organic substitutes, which are expected to change consumer preferences.
- The increasing consumption of plant proteins and consumer acceptance in the region are driving manufacturers to innovate products fortified with these ingredients. Major grains consumed in Japan are soybeans, rice, and wheat, along with some other types like corn and peas. The rise in plant-based protein is expected to continue to provide opportunities for food manufacturers in the coming years.
China is the largest producer of dry peas in Asia-Pacific
- Dry peas are considered the major raw material source for pea protein extraction, and the production data mentioned above is for dry peas only. The above graph represents the total production of dry peas in countries including China, India, Japan, Australia, New Zealand, and South Korea. China is the largest producer of dry peas in Asia-Pacific. There are two major dried pea-producing areas in China: the Northern Dried Pea Producing Area and the Southern Dried Pea Producing Area. Ningxia, Gansu, Yunnan, and Qinghai provinces are China's major dried pea-producing areas, accounting for over 70% of total dried pea production.
- India is the second-largest producer of peas in Asia-Pacific, after China, and the largest producer of chickpeas in the world. Yellow, green, Dum, and Kaspa are the four types of peas grown in the country. The production of dry peas in the country amounted to 1,004,402 tons in 2022, an increase of around 23.72% from 811,810 tons in 2019. Uttar Pradesh, Madhya Pradesh, and Punjab are the major pea-producing states and accounted for about 70% of the country's total pea production in 2022.
- In Australia, several types of field pea are grown, including dun pea, yellow pea, and maple pea. Victoria and South Australia have historically been the largest Australian field pea producers, but production has recently expanded considerably in Western Australia as a result of better varieties and improved production technology.
- The volume of legumes produced by Japanese agriculture is small, but their presence is significant in Japanese traditional food culture. The production of green peas is also very low in the region. Dried pea production is very low and limited, mainly in Hokkaido.
Asia-Pacific Pea Protein Industry Overview
The Asia-Pacific Pea Protein Market is fragmented, with the top five companies occupying 11.55%. The major players in this market are Archer Daniels Midland Company, Cargill, Incorporated, Ingredion Incorporated, International Flavors & Fragrances Inc. and Kerry Group PLC (sorted alphabetically).
Additional Benefits:
- The market estimate (ME) sheet in Excel format
- 3 months of analyst support
TABLE OF CONTENTS
1 EXECUTIVE SUMMARY & KEY FINDINGS
2 INTRODUCTION
- 2.1 Study Assumptions & Market Definition
- 2.2 Scope of the Study
- 2.3 Research Methodology
3 KEY INDUSTRY TRENDS
- 3.1 End User Market Volume
- 3.1.1 Baby Food and Infant Formula
- 3.1.2 Bakery
- 3.1.3 Beverages
- 3.1.4 Breakfast Cereals
- 3.1.5 Condiments/Sauces
- 3.1.6 Confectionery
- 3.1.7 Dairy and Dairy Alternative Products
- 3.1.8 Elderly Nutrition and Medical Nutrition
- 3.1.9 Meat/Poultry/Seafood and Meat Alternative Products
- 3.1.10 RTE/RTC Food Products
- 3.1.11 Snacks
- 3.1.12 Sport/Performance Nutrition
- 3.1.13 Animal Feed
- 3.1.14 Personal Care and Cosmetics
- 3.2 Protein Consumption Trends
- 3.2.1 Plant
- 3.3 Production Trends
- 3.3.1 Plant
- 3.4 Regulatory Framework
- 3.4.1 China
- 3.4.2 India
- 3.4.3 Japan
- 3.5 Value Chain & Distribution Channel Analysis
4 MARKET SEGMENTATION (includes market size in Value in USD and Volume, Forecasts up to 2030 and analysis of growth prospects)
- 4.1 Form
- 4.1.1 Concentrates
- 4.1.2 Isolates
- 4.1.3 Textured/Hydrolyzed
- 4.2 End User
- 4.2.1 Animal Feed
- 4.2.2 Food and Beverages
- 4.2.2.1 By Sub End User
- 4.2.2.1.1 Bakery
- 4.2.2.1.2 Beverages
- 4.2.2.1.3 Breakfast Cereals
- 4.2.2.1.4 Condiments/Sauces
- 4.2.2.1.5 Confectionery
- 4.2.2.1.6 Dairy and Dairy Alternative Products
- 4.2.2.1.7 Meat/Poultry/Seafood and Meat Alternative Products
- 4.2.2.1.8 RTE/RTC Food Products
- 4.2.2.1.9 Snacks
- 4.2.3 Personal Care and Cosmetics
- 4.2.4 Supplements
- 4.2.4.1 By Sub End User
- 4.2.4.1.1 Baby Food and Infant Formula
- 4.2.4.1.2 Elderly Nutrition and Medical Nutrition
- 4.2.4.1.3 Sport/Performance Nutrition
- 4.3 Country
- 4.3.1 Australia
- 4.3.2 China
- 4.3.3 India
- 4.3.4 Indonesia
- 4.3.5 Japan
- 4.3.6 Malaysia
- 4.3.7 New Zealand
- 4.3.8 South Korea
- 4.3.9 Thailand
- 4.3.10 Vietnam
- 4.3.11 Rest of Asia-Pacific
5 COMPETITIVE LANDSCAPE
- 5.1 Key Strategic Moves
- 5.2 Market Share Analysis
- 5.3 Company Landscape
- 5.4 Company Profiles (includes Global Level Overview, Market Level Overview, Core Business Segments, Financials, Headcount, Key Information, Market Rank, Market Share, Products and Services, and Analysis of Recent Developments).
- 5.4.1 Archer Daniels Midland Company
- 5.4.2 Cargill, Incorporated
- 5.4.3 Foodchem International Corporation
- 5.4.4 Ingredion Incorporated
- 5.4.5 International Flavors & Fragrances Inc.
- 5.4.6 Kerry Group PLC
- 5.4.7 Roquette Freres
- 5.4.8 Shandong Jianyuan Bioengineering Co. Ltd
- 5.4.9 Yantai Shuangta Food Co. Ltd
6 KEY STRATEGIC QUESTIONS FOR PROTEIN INGREDIENTS INDUSTRY CEOS
7 APPENDIX
- 7.1 Global Overview
- 7.1.1 Overview
- 7.1.2 Porter's Five Forces Framework
- 7.1.3 Global Value Chain Analysis
- 7.1.4 Market Dynamics (DROs)
- 7.2 Sources & References
- 7.3 List of Tables & Figures
- 7.4 Primary Insights
- 7.5 Data Pack
- 7.6 Glossary of Terms

