
Eスポーツ市場 (~2035年):ストリーミングタイプ・ゲームジャンル・デバイスタイプ・ストリーミングプラットフォーム・収益ストリーム・地域別の産業動向と世界の予測
ESports Market, Till 2035: Distribution by Type of Streaming, Type of Gaming Genre, Type of Device, Distribution by Type of Streaming Platform, Distribution by Type of Revenue Stream and Geographical Regions : Industry Trends and Global Forecasts- 発行日
- ページ情報
- 英文 174 Pages
- 納期
- 7~10営業日
- 商品コード
- 1721392
- カスタマイズ可能 お客様のご希望に応じて、既存データの加工や未掲載情報(例:国別セグメント)の追加などの対応が可能です。詳細はお問い合わせください。
- 翻訳ツール提供対象 PDF対応AI翻訳ツールの無料貸し出しサービスのご利用が可能です
- 医薬品関連専門 医薬品関連専門を専門とする市場調査会社です。
概要
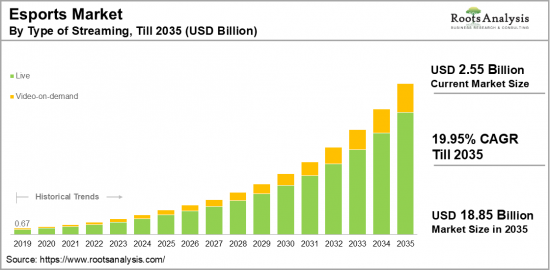
世界のEスポーツの市場規模は、現在の25億5,000万米ドルから、予測期間中はCAGR 19.95%で推移し、2035年には188億5,000万米ドルに成長すると予測されています。
Eスポーツの市場機会:セグメント別
展開モード別
- ライブ
- ビデオオンデマンド
技術別
- 格闘ゲーム
- ファーストパーソンシューティングゲーム
- 多人数同時参加型オンラインロールプレイングゲーム
- 多人数同時参加型オンラインバトルアリーナゲーム
- リアルタイム戦略ゲーム
- その他
デバイス別
- デスクトップ・ノートパソコン・タブレット
- ゲーム機
- スマートフォン
- スマートテレビ
ストリーミングプラットフォーム別
- Twitch
- YouTube
- その他
収入ストリーム別
- ゲームパブリッシャー料
- 放映権
- スポンサーおよび広告
- チケット販売およびグッズ販売
- その他
地域別
- 北米
- 米国
- カナダ
- メキシコ
- その他の北米諸国
- 欧州
- オーストリア
- ベルギー
- デンマーク
- フランス
- ドイツ
- アイルランド
- イタリア
- オランダ
- ノルウェー
- ロシア
- スペイン
- スウェーデン
- スイス
- 英国
- その他の欧州諸国
- アジア
- 中国
- インド
- 日本
- シンガポール
- 韓国
- その他のアジア諸国
- ラテンアメリカ
- ブラジル
- チリ
- コロンビア
- ベネズエラ
- その他のラテンアメリカ諸国
- 中東・北アフリカ
- エジプト
- イラン
- イラク
- イスラエル
- クウェート
- サウジアラビア
- UAE
- その他の中東・北アフリカ諸国
- 世界のその他の地域
- オーストラリア
- ニュージーランド
- その他の国
Eスポーツ市場:成長と動向
Eスポーツは、エンターテインメント業界の中でも急成長を遂げている分野であり、MOBA (マルチプレイヤーオンラインバトルアリーナ) やFPS (ファーストパーソンシューティング) など、さまざまなジャンルにおける組織的な競技型ゲームを含んでいます。この分野の拡大は、技術の進歩、オンライン配信プラットフォームの人気、ゲームが正当な競技活動として認知されるようになったことによって支えられています。Eスポーツには多くの利点があり、チームワークや戦略的思考といったスキルの育成、プレイヤー間の社会的交流やコミュニティ形成の促進などが挙げられます。さらに、ゲームデザインやイベント運営といった関連分野でのキャリア機会を生み出しており、若年層を中心に高い関心を集めていることは、エンターテインメントのデジタル化が進んでいる潮流を示しています。特に注目すべきは、2023年にはEスポーツのスポンサーシップによって約8億9,500万ドルの収益が創出された点です。
加えて、現在、Eスポーツ業界はプロフェッショナル化の進展によって大きな変革期を迎えています。Eスポーツ専用インフラの整備が進み、世界中の主要都市が専用アリーナへの投資を進めることで、観光誘致や経済成長を図る動きが加速しています。仮設会場から最先端の常設施設への移行は、Eスポーツ業界のプロ化とエンターテインメントとしての正当性の高まりを象徴しています。また、バーチャルリアリティ (VR) や拡張現実 (AR) といった技術の進歩は、プレイヤー体験や観客の没入感をさらに向上させるなど、インフラ面にも大きな影響を与えています。
当レポートでは、世界のEスポーツの市場を調査し、 市場概要、背景、市場影響因子の分析、市場規模の推移・予測、各種区分・地域別の詳細分析、競合情勢、主要企業のプロファイルなどをまとめています。
目次
第1章 序文
第2章 調査手法
第3章 経済およびその他のプロジェクト特有の考慮事項
第4章 マクロ経済指標
第5章 エグゼクティブサマリー
第6章 イントロダクション
第7章 競合情勢
第8章 企業プロファイル
- Activision Blizzard
- Electronic Arts
- FACEIT
- Gameloft SE
- Gfinity
- Intel
- Microsoft
- Modern Times
- Nintendo
- NVIDIA
- Riot Games
- Valve
第9章 バリューチェーン分析
第10章 SWOT分析
第11章 世界のEスポーツ市場
第12章 ストリーミングタイプ別の市場機会
第13章 ゲームジャンル別の市場機会
第14章 デバイスタイプ別の市場機会
第15章 ストリーミングプラットフォーム別の市場機会
第16章 収益ストリーム別の市場機会
第17章 北米におけるEスポーツの市場機会
第18章 欧州におけるEスポーツの市場機会
第19章 アジアにおけるEスポーツの市場機会
第20章 中東・北アフリカにおけるEスポーツの市場機会
第21章 ラテンアメリカにおけるEスポーツの市場機会
第22章 世界のその他の地域におけるEスポーツの市場機会
第23章 表形式データ
第24章 企業・団体一覧
第25章 カスタマイズの機会
第26章 ROOTSのサブスクリプションサービス
第27章 著者詳細
目次
Esports Market Overview
As per Roots Analysis, the global esports market size is estimated to grow from USD 2.55 billion in the current year to USD 18.85 billion by 2035, at a CAGR of 19.95% during the forecast period, till 2035.
The opportunity for esports market has been distributed across the following segments:
Type of Deployment Mode
- Live
- Video-on-demand
Type of Technology
- Fighting Games
- First Person Shooter Games
- Mass Multiplayer Online Role-playing Games
- Multiplayer Online Battle Arena Games
- Real-time Strategy Games
- Others
Type of Device
- Desktop -laptop-tablets
- Gaming console
- Smart phone
- Smart TV
Type of Streaming Platform
- Twitch
- YouTube
- Others
Type of Revenue Stream
- Game Publisher Fees
- Media Rights
- Sponsorship and Advertisement
- Ticket & Merchandise
- Others
Geographical Regions
- North America
- US
- Canada
- Mexico
- Other North American countries
- Europe
- Austria
- Belgium
- Denmark
- France
- Germany
- Ireland
- Italy
- Netherlands
- Norway
- Russia
- Spain
- Sweden
- Switzerland
- UK
- Other European countries
- Asia
- China
- India
- Japan
- Singapore
- South Korea
- Other Asian countries
- Latin America
- Brazil
- Chile
- Colombia
- Venezuela
- Other Latin American countries
- Middle East and North Africa
- Egypt
- Iran
- Iraq
- Israel
- Kuwait
- Saudi Arabia
- UAE
- Other MENA countries
- Rest of the World
- Australia
- New Zealand
- Other countries
ESPORTS MARKET: GROWTH AND TRENDS
Esports, also known as electronic sports, is a fast-growing sector within the entertainment industry that encompasses organized competitive gaming across various genres, including MOBAs and FPS games. The expansion of this field is fueled by advancements in technology, the popularity of online streaming platforms, and the rising recognition of gaming as a valid competitive activity. Esports present many benefits, such as fostering skills like teamwork and strategic thinking, along with encouraging social interaction and community development among players. Moreover, it creates career opportunities in fields like game design and event management, making it especially attractive to younger individuals and indicative of a larger trend towards digital engagement in entertainment. Notably, in 2023, esports sponsorships generated nearly USD 895 million in revenue.
In addition, the industry is experiencing a transformative phase, propelled by the professionalization of the sector. The development of esports infrastructure is significantly altering the competitive gaming scene, as major cities around the globe are investing in specially designed esports arenas, acknowledging their potential to draw tourism and boost economic growth. This transition from temporary venues to cutting-edge facilities demonstrates the industry's professional evolution and the growing legitimacy of esports as a form of entertainment. Advances in technology, especially in virtual and augmented reality, are also impacting infrastructure, improving both player experiences and audience involvement.
ESPORTS MARKET: KEY SEGMENTS
Market Share by Type of Deployment Mode
Based on the type of deployment mode, the global esports market is segmented into live and video-on-demand. According to our estimates, currently, live streaming captures the majority share of the market. This growth can be attributed to several factors, including a heightened consumer demand for real-time content, live events, and interactive experiences.
Market Share by Type of Gaming Genre
Based on the type of gaming genre, the esports market is segmented into fighting games, first person shooter games, mass multiplayer online role-playing games, multiplayer online battle arena games, real time strategy games and others. According to our estimates, currently, multiplayer online battle arena games (MOBA) captures the majority share of the market. This can be attributed to strong growth trends fueled by cross-platform play and the increasing popularity of mobile MOBA games, along with the incorporation of cutting-edge technologies such as AI and virtual reality.
Market Share by Type of Device
Based on the type of device, the esports market is segmented into desktop / laptop / tablets, gaming console, smart phone and smart TV. According to our estimates, currently, smartphones segment captures the majority share of the market. This can be attributed to the rising adoption of smartphones, especially in developing nations, which has made gaming more accessible, as these devices provide economical alternatives with substantial features.
Market Share by Type of Streaming Platform
Based on the type of streaming platform, the esports market is segmented into Twitch, YouTube and others. According to our estimates, currently, Twitch captures the majority share of the market. This can be attributed to its subscription model and extensive audience.
Market Share by Type of Revenue Stream
Based on the type of revenue stream, the esports market is segmented into game publisher fees, media rights, sponsorship and advertisement, ticket & merchandise and others. According to our estimates, currently, sponsorship and advertising captures the majority share of the market. This can be attributed to increasing viewership, heightened brand investments, and chances for direct interaction with fans.
Market Share by Geographical Regions
Based on the geographical regions, the esports market is segmented into North America, Europe, Asia, Latin America, Middle East and North Africa, and Rest of the World. According to our estimates, currently, North America captures the majority share of the market. However, market in Asia is anticipated to grow at a higher CAGR during the forecast period. The rapid growth in this region can be attributed to the presence of youths and the increasing engagement with digital platforms in countries such as China, Japan, and India.
Example Players in Esports Market
- Activision Blizzard
- Electronic Arts
- FACEIT
- Gameloft SE
- Gfinity
- Intel
- Microsoft
- Modern Times
- Nintendo
- NVIDIA
- Riot Games
- Valve
ESPORTS MARKET: RESEARCH COVERAGE
The report on the esports market features insights on various sections, including:
- Market Sizing and Opportunity Analysis: An in-depth analysis of the esports market, focusing on key market segments, including [A] type of deployment mode, [B] type of technology, [C] type of device, [D] type of streaming platform and [E] type of revenue stream and [F] geographical regions.
- Competitive Landscape: A comprehensive analysis of the companies engaged in the Esports market, based on several relevant parameters, such as [A] year of establishment, [B] company size, [C] location of headquarters, [D] ownership structure.
- Company Profiles: Elaborate profiles of prominent players engaged in the Esports market, providing details on [A] location of headquarters, [B]company size, [C] company mission, [D] company footprint, [E] management team, [F] contact details, [G] financial information, [H] operating business segments, [I] esports portfolio, [J] moat analysis, [K] recent developments, and an informed future outlook.
- SWOT Analysis: An insightful SWOT framework, highlighting the strengths, weaknesses, opportunities and threats in the domain. Additionally, it provides Harvey ball analysis, highlighting the relative impact of each SWOT parameter.
KEY QUESTIONS ANSWERED IN THIS REPORT
- How many companies are currently engaged in esports market?
- Which are the leading companies in this market?
- What factors are likely to influence the evolution of this market?
- What is the current and future market size?
- What is the CAGR of this market?
- How is the current and future market opportunity likely to be distributed across key market segments?
REASONS TO BUY THIS REPORT
- The report provides a comprehensive market analysis, offering detailed revenue projections of the overall market and its specific sub-segments. This information is valuable to both established market leaders and emerging entrants.
- Stakeholders can leverage the report to gain a deeper understanding of the competitive dynamics within the market. By analyzing the competitive landscape, businesses can make informed decisions to optimize their market positioning and develop effective go-to-market strategies.
- The report offers stakeholders a comprehensive overview of the market, including key drivers, barriers, opportunities, and challenges. This information empowers stakeholders to stay abreast of market trends and make data-driven decisions to capitalize on growth prospects.
ADDITIONAL BENEFITS
- Complimentary Excel Data Packs for all Analytical Modules in the Report
- 10% Free Content Customization
- Detailed Report Walkthrough Session with Research Team
- Free Updated report if the report is 6-12 months old or older
TABLE OF CONTENTS
1. PREFACE
- 1.1. Introduction
- 1.2. Market Share Insights
- 1.3. Key Market Insights
- 1.4. Report Coverage
- 1.5. Key Questions Answered
- 1.6. Chapter Outlines
2. RESEARCH METHODOLOGY
- 2.1. Chapter Overview
- 2.2. Research Assumptions
- 2.3. Database Building
- 2.3.1. Data Collection
- 2.3.2. Data Validation
- 2.3.3. Data Analysis
- 2.4. Project Methodology
- 2.4.1. Secondary Research
- 2.4.1.1. Annual Reports
- 2.4.1.2. Academic Research Papers
- 2.4.1.3. Company Websites
- 2.4.1.4. Investor Presentations
- 2.4.1.5. Regulatory Filings
- 2.4.1.6. White Papers
- 2.4.1.7. Industry Publications
- 2.4.1.8. Conferences and Seminars
- 2.4.1.9. Government Portals
- 2.4.1.10. Media and Press Releases
- 2.4.1.11. Newsletters
- 2.4.1.12. Industry Databases
- 2.4.1.13. Roots Proprietary Databases
- 2.4.1.14. Paid Databases and Sources
- 2.4.1.15. Social Media Portals
- 2.4.1.16. Other Secondary Sources
- 2.4.2. Primary Research
- 2.4.2.1. Introduction
- 2.4.2.2. Types
- 2.4.2.2.1. Qualitative
- 2.4.2.2.2. Quantitative
- 2.4.2.3. Advantages
- 2.4.2.4. Techniques
- 2.4.2.4.1. Interviews
- 2.4.2.4.2. Surveys
- 2.4.2.4.3. Focus Groups
- 2.4.2.4.4. Observational Research
- 2.4.2.4.5. Social Media Interactions
- 2.4.2.5. Stakeholders
- 2.4.2.5.1. Company Executives (CXOs)
- 2.4.2.5.2. Board of Directors
- 2.4.2.5.3. Company Presidents and Vice Presidents
- 2.4.2.5.4. Key Opinion Leaders
- 2.4.2.5.5. Research and Development Heads
- 2.4.2.5.6. Technical Experts
- 2.4.2.5.7. Subject Matter Experts
- 2.4.2.5.8. Scientists
- 2.4.2.5.9. Doctors and Other Healthcare Providers
- 2.4.2.6. Ethics and Integrity
- 2.4.2.6.1. Research Ethics
- 2.4.2.6.2. Data Integrity
- 2.4.3. Analytical Tools and Databases
- 2.4.1. Secondary Research
3. ECONOMIC AND OTHER PROJECT SPECIFIC CONSIDERATIONS
- 3.1. Forecast Methodology
- 3.1.1. Top-Down Approach
- 3.1.2. Bottom-Up Approach
- 3.1.3. Hybrid Approach
- 3.2. Market Assessment Framework
- 3.2.1. Total Addressable Market (TAM)
- 3.2.2. Serviceable Addressable Market (SAM)
- 3.2.3. Serviceable Obtainable Market (SOM)
- 3.2.4. Currently Acquired Market (CAM)
- 3.3. Forecasting Tools and Techniques
- 3.3.1. Qualitative Forecasting
- 3.3.2. Correlation
- 3.3.3. Regression
- 3.3.4. Time Series Analysis
- 3.3.5. Extrapolation
- 3.3.6. Convergence
- 3.3.7. Forecast Error Analysis
- 3.3.8. Data Visualization
- 3.3.9. Scenario Planning
- 3.3.10. Sensitivity Analysis
- 3.4. Key Considerations
- 3.4.1. Demographics
- 3.4.2. Market Access
- 3.4.3. Reimbursement Scenarios
- 3.4.4. Industry Consolidation
- 3.5. Robust Quality Control
- 3.6. Key Market Segmentations
- 3.7. Limitations
4. MACRO-ECONOMIC INDICATORS
- 4.1. Chapter Overview
- 4.2. Market Dynamics
- 4.2.1. Time Period
- 4.2.1.1. Historical Trends
- 4.2.1.2. Current and Forecasted Estimates
- 4.2.2. Currency Coverage
- 4.2.2.1. Overview of Major Currencies Affecting the Market
- 4.2.2.2. Impact of Currency Fluctuations on the Industry
- 4.2.3. Foreign Exchange Impact
- 4.2.3.1. Evaluation of Foreign Exchange Rates and Their Impact on Market
- 4.2.3.2. Strategies for Mitigating Foreign Exchange Risk
- 4.2.4. Recession
- 4.2.4.1. Historical Analysis of Past Recessions and Lessons Learnt
- 4.2.4.2. Assessment of Current Economic Conditions and Potential Impact on the Market
- 4.2.5. Inflation
- 4.2.5.1. Measurement and Analysis of Inflationary Pressures in the Economy
- 4.2.5.2. Potential Impact of Inflation on the Market Evolution
- 4.2.6. Interest Rates
- 4.2.6.1. Overview of Interest Rates and Their Impact on the Market
- 4.2.6.2. Strategies for Managing Interest Rate Risk
- 4.2.7. Commodity Flow Analysis
- 4.2.7.1. Type of Commodity
- 4.2.7.2. Origins and Destinations
- 4.2.7.3. Values and Weights
- 4.2.7.4. Modes of Transportation
- 4.2.8. Global Trade Dynamics
- 4.2.8.1. Import Scenario
- 4.2.8.2. Export Scenario
- 4.2.9. War Impact Analysis
- 4.2.9.1. Russian-Ukraine War
- 4.2.9.2. Israel-Hamas War
- 4.2.10. COVID Impact / Related Factors
- 4.2.10.1. Global Economic Impact
- 4.2.10.2. Industry-specific Impact
- 4.2.10.3. Government Response and Stimulus Measures
- 4.2.10.4. Future Outlook and Adaptation Strategies
- 4.2.11. Other Indicators
- 4.2.11.1. Fiscal Policy
- 4.2.11.2. Consumer Spending
- 4.2.11.3. Gross Domestic Product (GDP)
- 4.2.11.4. Employment
- 4.2.11.5. Taxes
- 4.2.11.6. R&D Innovation
- 4.2.11.7. Stock Market Performance
- 4.2.11.8. Supply Chain
- 4.2.11.9. Cross-Border Dynamics
- 4.2.1. Time Period
5. EXECUTIVE SUMMARY
6. INTRODUCTION
- 6.1. Chapter Overview
- 6.2. Overview of Esports
- 6.2.1. Type of Streaming
- 6.2.2. Type of Gaming Genre
- 6.2.3. Type of Device
- 6.2.4. Type of Streaming Platform
- 6.2.5. Type of Revenue Stream
- 6.3. Future Perspective
7. COMPETITIVE LANDSCAPE
- 7.1. Chapter Overview
- 7.2. Esports: Overall Market Landscape
- 7.2.1. Analysis by Year of Establishment
- 7.2.2. Analysis by Company Size
- 7.2.3. Analysis by Location of Headquarters
- 7.2.4. Analysis by Ownership Structure
8. COMPANY PROFILES
- 8.1. Chapter Overview
- 8.1.1. Activision Blizzard *
- 8.1.2. Company Overview
- 8.1.3. Company Mission
- 8.1.4. Company Footprint
- 8.1.5. Management Team
- 8.1.6. Contact Details
- 8.1.7. Financial Performance
- 8.1.8. Operating Business Segments
- 8.1.9. Service / Product Portfolio (project specific)
- 8.1.10. MOAT Analysis
- 8.1.11. Recent Developments and Future Outlook
- 8.2. Electronic Arts
- 8.3. FACEIT
- 8.4. Gameloft SE
- 8.5. Gfinity
- 8.6. Intel
- 8.7. Microsoft
- 8.8. Modern Times
- 8.9. Nintendo
- 8.10. NVIDIA
- 8.11. Riot Games
- 8.12. Valve
9. VALUE CHAIN ANALYSIS
10. SWOT ANALYSIS
11. GLOBAL ESPORTS MARKET
- 11.1. Chapter Overview
- 11.2. Key Assumptions and Methodology
- 11.3. Trends Disruption Impacting Market
- 11.4. Global Esports Market, Historical Trends (Since 2019) and Forecasted Estimates (Till 2035)
- 11.5. Multivariate Scenario Analysis
- 11.5.1. Conservative Scenario
- 11.5.2. Optimistic Scenario
- 11.6. Key Market Segmentations
12. MARKET OPPORTUNITIES BASED ON TYPE OF STREAMING
- 12.1. Chapter Overview
- 12.2. Key Assumptions and Methodology
- 12.3. Revenue Shift Analysis
- 12.4. Market Movement Analysis
- 12.5. Penetration-Growth (P-G) Matrix
- 12.6. Esports Market for Live: Historical Trends (Since 2019) and Forecasted Estimates (Till 2035)
- 12.7. Esports Market for Video on demand: Historical Trends (Since 2019) and Forecasted Estimates (Till 2035)
- 12.8. Data Triangulation and Validation
13. MARKET OPPORTUNITIES BASED ON TYPE OF GAMING GENRE
- 13.1. Chapter Overview
- 13.2. Key Assumptions and Methodology
- 13.3. Revenue Shift Analysis
- 13.4. Market Movement Analysis
- 13.5. Penetration-Growth (P-G) Matrix
- 13.6. Esports Market for Fighting Games: Historical Trends (Since 2019) and Forecasted Estimates (Till 2035)
- 13.7. Esports Market for First Person Shooter Games: Historical Trends (Since 2019) and Forecasted Estimates (Till 2035)
- 13.8. Esports Market for Mass Multiplayer Online Role-playing Games: Historical Trends (Since 2019) and Forecasted Estimates (Till 2035)
- 13.9. Esports Market for Multiplayer Online Battle Arena Games: Historical Trends (Since 2019) and Forecasted Estimates (Till 2035)
- 13.10. Esports Market for Real-time Strategy Games: Historical Trends (Since 2019) and Forecasted Estimates (Till 2035)
- 13.11. Esports Market for Others: Historical Trends (Since 2019) and Forecasted Estimates (Till 2035)
- 13.12. Data Triangulation and Validation
14. MARKET OPPORTUNITIES BASED ON TYPE OF DEVICE
- 14.1. Chapter Overview
- 14.2. Key Assumptions and Methodology
- 14.3. Revenue Shift Analysis
- 14.4. Market Movement Analysis
- 14.5. Penetration-Growth (P-G) Matrix
- 14.6. Esports Market for Desktop / laptop / tablets: Historical Trends (Since 2019) and Forecasted Estimates (Till 2035)
- 14.7. Esports Market for Gaming Console: Historical Trends (Since 2019) and Forecasted Estimates (Till 2035)
- 14.8. Esports Market for Smart Phone: Historical Trends (Since 2019) and Forecasted Estimates (Till 2035)
- 14.9. Esports Market for Smart TV: Historical Trends (Since 2019) and Forecasted Estimates (Till 2035)
- 14.10. Data Triangulation and Validation
15. MARKET OPPORTUNITIES BASED ON TYPE OF STREAMING PLATFORM
- 15.1. Chapter Overview
- 15.2. Key Assumptions and Methodology
- 15.3. Revenue Shift Analysis
- 15.4. Market Movement Analysis
- 15.5. Penetration-Growth (P-G) Matrix
- 15.6. Esports Market for Twitch: Historical Trends (Since 2019) and Forecasted Estimates (Till 2035)
- 15.7. Esports Market for YouTube: Historical Trends (Since 2019) and Forecasted Estimates (Till 2035)
- 15.8. Esports Market for Others: Historical Trends (Since 2019) and Forecasted Estimates (Till 2035)
- 15.9. Data Triangulation and Validation
16. MARKET OPPORTUNITIES BASED ON TYPE OF REVENUE STREAM
- 16.1. Chapter Overview
- 16.2. Key Assumptions and Methodology
- 16.3. Revenue Shift Analysis
- 16.4. Market Movement Analysis
- 16.5. Penetration-Growth (P-G) Matrix
- 16.6. Esports Market for Advertisement: Historical Trends (Since 2019) and Forecasted Estimates (Till 2035)
- 16.7. Esports Market for Game Publisher Fees: Historical Trends (Since 2019) and Forecasted Estimates (Till 2035)
- 16.8. Esports Market for Media Rights: Historical Trends (Since 2019) and Forecasted Estimates (Till 2035)
- 16.9. Esports Market for Sponsorship: Historical Trends (Since 2019) and Forecasted Estimates (Till 2035)
- 16.10. Esports Market for Ticket & Merchandise: Historical Trends (Since 2019) and Forecasted Estimates (Till 2035)
- 16.11. Esports Market for Others: Historical Trends (Since 2019) and Forecasted Estimates (Till 2035)
- 16.12. Data Triangulation and Validation
17 MARKET OPPORTUNITIES FOR ESPORTS IN NORTH AMERICA
- 17.1. Chapter Overview
- 17.2. Key Assumptions and Methodology
- 17.3. Revenue Shift Analysis
- 17.4. Market Movement Analysis
- 17.5. Penetration-Growth (P-G) Matrix
- 17.6. Esports Market in North America: Historical Trends (Since 2019) and Forecasted Estimates (Till 2035)
- 17.6.1. Esports Market in the US: Historical Trends (Since 2019) and Forecasted Estimates (Till 2035)
- 17.6.2. Esports Market in Canada: Historical Trends (Since 2019) and Forecasted Estimates (Till 2035)
- 17.6.3. Esports Market in Mexico: Historical Trends (Since 2019) and Forecasted Estimates (Till 2035)
- 17.6.4. Esports Market in Other North American Countries: Historical Trends (Since 2019) and Forecasted Estimates (Till 2035)
- 17.7. Data Triangulation and Validation
18. MARKET OPPORTUNITIES FOR ESPORTS IN EUROPE
- 18.1. Chapter Overview
- 18.2. Key Assumptions and Methodology
- 18.3. Revenue Shift Analysis
- 18.4. Market Movement Analysis
- 18.5. Penetration-Growth (P-G) Matrix
- 18.6. Esports Market in Europe: Historical Trends (Since 2019) and Forecasted Estimates (Till 2035)
- 18.6.1. Esports Market in the Austria: Historical Trends (Since 2019) and Forecasted Estimates (Till 2035)
- 18.6.2. Esports Market in Belgium: Historical Trends (Since 2019) and Forecasted Estimates (Till 2035)
- 18.6.3. Esports Market in Denmark: Historical Trends (Since 2019) and Forecasted Estimates (Till 2035)
- 18.6.4. Esports Market in France: Historical Trends (Since 2019) and Forecasted Estimates (Till 2035)
- 18.6.5. Esports Market in Germany: Historical Trends (Since 2019) and Forecasted Estimates (Till 2035)
- 18.6.6. Esports Market in Ireland: Historical Trends (Since 2019) and Forecasted Estimates (Till 2035)
- 18.6.7. Esports Market in Italy: Historical Trends (Since 2019) and Forecasted Estimates (Till 2035)
- 18.6.8. Esports Market in Netherlands: Historical Trends (Since 2019) and Forecasted Estimates (Till 2035)
- 18.6.9. Esports Market in Norway: Historical Trends (Since 2019) and Forecasted Estimates (Till 2035)
- 18.6.10. Esports Market in Russia: Historical Trends (Since 2019) and Forecasted Estimates (Till 2035)
- 18.6.11. Esports Market in Spain: Historical Trends (Since 2019) and Forecasted Estimates (Till 2035)
- 18.6.12. Esports Market in Sweden: Historical Trends (Since 2019) and Forecasted Estimates (Till 2035)
- 18.6.13. Esports Market in Switzerland: Historical Trends (Since 2019) and Forecasted Estimates (Till 2035)
- 18.6.14. Esports Market in the UK: Historical Trends (Since 2019) and Forecasted Estimates (Till 2035)
- 18.6.15. Esports Market in Other European Countries: Historical Trends (Since 2019) and Forecasted Estimates (Till 2035)
- 18.7. Data Triangulation and Validation
19. MARKET OPPORTUNITIES FOR ESPORTS IN ASIA
- 19.1. Chapter Overview
- 19.2. Key Assumptions and Methodology
- 19.3. Revenue Shift Analysis
- 19.4. Market Movement Analysis
- 19.5. Penetration-Growth (P-G) Matrix
- 19.6. Esports Market in Asia: Historical Trends (Since 2019) and Forecasted Estimates (Till 2035)
- 19.6.1. Esports Market in China: Historical Trends (Since 2019) and Forecasted Estimates (Till 2035)
- 19.6.2. Esports Market in India: Historical Trends (Since 2019) and Forecasted Estimates (Till 2035)
- 19.6.3. Esports Market in Japan: Historical Trends (Since 2019) and Forecasted Estimates (Till 2035)
- 19.6.4. Esports Market in Singapore: Historical Trends (Since 2019) and Forecasted Estimates (Till 2035)
- 19.6.5. Esports Market in South Korea: Historical Trends (Since 2019) and Forecasted Estimates (Till 2035)
- 19.6.6. Esports Market in Other Asian Countries: Historical Trends (Since 2019) and Forecasted Estimates (Till 2035)
- 19.7. Data Triangulation and Validation
20. MARKET OPPORTUNITIES FOR ESPORTS IN MIDDLE EAST AND NORTH AFRICA
- 20.1. Chapter Overview
- 20.2. Key Assumptions and Methodology
- 20.3. Revenue Shift Analysis
- 20.4. Market Movement Analysis
- 20.5. Penetration-Growth (P-G) Matrix
- 20.6. Esports Market in Middle East and North Africa (MENA): Historical Trends (Since 2019) and Forecasted Estimates (Till 2035)
- 20.6.1. Esports Market in Egypt: Historical Trends (Since 2019) and Forecasted Estimates (Till 205)
- 20.6.2. Esports Market in Iran: Historical Trends (Since 2019) and Forecasted Estimates (Till 2035)
- 20.6.3. Esports Market in Iraq: Historical Trends (Since 2019) and Forecasted Estimates (Till 2035)
- 20.6.4. Esports Market in Israel: Historical Trends (Since 2019) and Forecasted Estimates (Till 2035)
- 20.6.5. Esports Market in Kuwait: Historical Trends (Since 2019) and Forecasted Estimates (Till 2035)
- 20.6.6. Esports Market in Saudi Arabia: Historical Trends (Since 2019) and Forecasted Estimates (Till 2035)
- 20.6.7. Esports Market in United Arab Emirates (UAE): Historical Trends (Since 2019) and Forecasted Estimates (Till 2035)
- 20.6.8. Esports Market in Other MENA Countries: Historical Trends (Since 2019) and Forecasted Estimates (Till 2035)
- 20.7. Data Triangulation and Validation
21. MARKET OPPORTUNITIES FOR ESPORTS IN LATIN AMERICA
- 21.1. Chapter Overview
- 21.2. Key Assumptions and Methodology
- 21.3. Revenue Shift Analysis
- 21.4. Market Movement Analysis
- 21.5. Penetration-Growth (P-G) Matrix
- 21.6. Esports Market in Latin America: Historical Trends (Since 2021) and Forecasted Estimates (Till 2035)
- 21.6.1. Esports Market in Argentina: Historical Trends (Since 2021) and Forecasted Estimates (Till 2035)
- 21.6.2. Esports Market in Brazil: Historical Trends (Since 2021) and Forecasted Estimates (Till 2035)
- 21.6.3. Esports Market in Chile: Historical Trends (Since 2021) and Forecasted Estimates (Till 2035)
- 21.6.4. Esports Market in Colombia Historical Trends (Since 2021) and Forecasted Estimates (Till 2035)
- 21.6.5. Esports Market in Venezuela: Historical Trends (Since 2021) and Forecasted Estimates (Till 2035)
- 21.6.6. Esports Market in Other Latin American Countries: Historical Trends (Since 2021) and Forecasted Estimates (Till 2035)
- 21.7. Data Triangulation and Validation
22. MARKET OPPORTUNITIES FOR ESPORTS IN REST OF THE WORLD
- 22.1. Chapter Overview
- 22.2. Key Assumptions and Methodology
- 22.3. Revenue Shift Analysis
- 22.4. Market Movement Analysis
- 22.5. Penetration-Growth (P-G) Matrix
- 22.6. Esports Market in Rest of the World: Historical Trends (Since 2019) and Forecasted Estimates (Till 2035)
- 22.6.1. Esports Market in Australia: Historical Trends (Since 2019) and Forecasted Estimates (Till 2035)
- 22.6.2. Esports Market in New Zealand: Historical Trends (Since 2019) and Forecasted Estimates (Till 2035)
- 22.6.3. Esports Market in Other Countries
- 22.7. Data Triangulation and Validation
23. TABULATED DATA
24. LIST OF COMPANIES AND ORGANIZATIONS
25. CUSTOMIZATION OPPORTUNITIES
26. ROOTS SUBSCRIPTION SERVICES
27. AUTHOR DETAIL
- 発行日
- 発行
- Roots Analysis
- ページ情報
- 英文 174 Pages
- 納期
- 7~10営業日