
|
市場調査レポート
商品コード
1693584
インドの航空:市場シェア分析、産業動向と統計、成長予測(2025年~2030年)India Aviation - Market Share Analysis, Industry Trends & Statistics, Growth Forecasts (2025 - 2030) |
||||||
カスタマイズ可能
適宜更新あり
|
|||||||
| インドの航空:市場シェア分析、産業動向と統計、成長予測(2025年~2030年) |
|
出版日: 2025年03月18日
発行: Mordor Intelligence
ページ情報: 英文 244 Pages
納期: 2~3営業日
|

全表示
- 概要
- 目次
概要
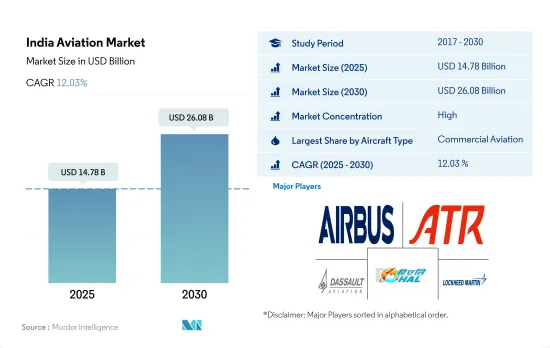
インドの航空市場規模は2025年に147億8,000万米ドルと予測され、2030年には260億8,000万米ドルに達し、予測期間中(2025~2030年)のCAGRは12.03%で成長すると予測されます。
予測期間中、民間航空がインド市場を独占する見込み
- インドの民間・軍用航空産業は、ここ数年で同国で最も急成長している産業の1つに浮上しました。インド政府によると、民間航空部門は2021年にインドのGDPに300億米ドル貢献しました。この成長により、国内航空市場は2024年までに世界第3位にランクされると予測されています。
- 航空輸送量は、世界平均と比較して急速に増加しています。航空便数は現在の600機から2024年には1,200機に増加する可能性があります。インドの一般航空産業は、ビジネスとプライベートの両方のニーズに応える贅沢品と考えられており、国の経済成長を強力に後押ししています。インドへの観光客の急増とHNWIの増加が、同国の一般航空部門の成長を牽引しています。
- こうした原動力にもかかわらず、ビジネスのしやすさ、税制の複雑さ、不十分なインフラ、運航ライセンス取得の複雑なプロセスなどの課題により、インドのビジネス航空市場の成長は低迷しています。インドは重要な軍用機市場であり、パキスタンや中国から国境を守るため、新しい航空機の調達や軍用機の独自開発によって航空能力の近代化を進めています。
- HALはインド最大の航空機・ヘリコプターメーカーであり、BAEホーク・トレーナーやテジャスLCAを生産しています。また、Make in Indiaイニシアチブの下、第5世代の先進中型戦闘機の開発も進めており、予測期間中に納入が開始される見込みです。
インドの航空市場の動向
規制緩和と航空旅客数の増加が市場需要を牽引
- 2022年には、約1億2,320万人の旅客が航空機を利用しました。これは2021年の旅客数を47%上回りました。この年の市場シェアはインディゴが55%近くを占め、他の航空会社は大きく引き離されました。ヴィスタラとエアインディアはそれぞれ9.2%のシェアで2位につけ、スパイスジェットとAIXコネクト(エアアジアインディア)がそれぞれ7.6%で続きました。ゴー・ファースト航空は7.5%のシェアを記録し、アカサ航空は2.3%で1年を終えました。
- 2022年に6,900万人の旅客を運んだインディゴは、6,800万人の旅客を運んだ2019年の業績を100万人改善しました。これは、同社が数機の航空機の着陸に伴うキャパシティーの減少に苦しんだ後のことです。2022年12月の国内航空旅客数は前年同月比15%増の約129,000人だったが、パンデミック前(2019年12月)の水準を1%下回ったままでした。ICRAによると、国内航空産業は2021年12月の約80%、2019年12月の約88%に対し、2022年12月は約91%の推定搭乗率で運航しました。
- 2022年1月から3月までにインドの国内航空会社が運んだ旅客数は、2021年同期間の2,338万人に対し、2,480万人でした。2022年3月、インドは国際定期便を再開し、国際線旅客数の急増につながりました。その結果、2022年4月、インドの航空会社の旅客数は185万人に達し、2019年4月に記録した183万人の国際線旅客数をわずかに上回りました。2022年1月現在、同国は国際線旅行の再開を目指し、35カ国とエアバブル協定を結んでいます。これらのエアバブル協定は、100カ国以上への直行/間接接続を記載しています。
地政学的脅威が国防費増加の原動力
- インドは世界第4位、アジア太平洋では第2位の国防支出国です。2022年の国防費は814億米ドルで、2021年比で6%増となりました。インドは2023~24会計年度の国防費として726億米ドルを提案しており、前期の当初見積もりから13%増となっています。インドの国防予算総額はGDPの2%と見積もられています。インドでは、海軍艦隊の建造に2,420億インドルピー(30億米ドル)近く、航空機の増備を含む空軍の調達に5,714億インドルピー(70億米ドル)を支出する計画です。
- 同国の資本支出は、軍事の装備のアップグレードや中国との係争中の国境沿いの軍事インフラに充てられるもので、2022年の軍事支出全体の23%に相当します。人件費(給与や年金など)は依然としてインド軍事予算における最大の支出項目であり、軍事費全体の約半分を占めています。
- 最近、特に国産品の購入に割り当てが行われました。テージャス軽戦闘機(LCA)Mk-1A、軽戦闘ヘリコプター(LCH)、基礎練習機HTT-40、アルジュンMk-1A戦車、ミサイル数種、その他兵器に多額の資金が投入される可能性があります。国防生産の増加は輸出に道を開き、経費の相殺に役立ちます。外国の装備品メーカーは合弁事業(JV)を設立し、ハイテクセグメントへの外国直接投資(FDI)を誘致する可能性が高くなります。こうしたジョイントベンチャーの一部は、防衛輸出を支援することも期待されています。
インドの航空産業概要
インドの航空市場はかなり統合されており、上位5社で92.04%を占めています。この市場の主要企業は、Airbus SE、ATR、Dassault Aviation、Hindustan Aeronautics Limited、Lockheed Martin Corporationなどです。
その他の特典
- エクセル形式の市場予測(ME)シート
- 3ヶ月のアナリストサポート
目次
第1章 エグゼクティブサマリーと主要調査結果
第2章 レポートのオファー
第3章 イントロダクション
- 調査の前提条件と市場定義
- 調査範囲
- 調査手法
第4章 主要産業動向
- 航空旅客輸送量
- 航空貨物輸送量
- 国内総生産
- 収入旅客キロ(rpk)
- インフレ率
- アクティブフリートデータ
- 国防支出
- 個人富裕層(HNWI)
- 規制の枠組み
- バリューチェーン分析
第5章 市場セグメンテーション
- 航空機タイプ
- 民間航空機
- サブ航空機タイプ別
- 旅客機
- ボディタイプ別
- ナローボディ機
- ワイドボディ機
- 一般旅客機
- サブ航空機タイプ別
- ビジネスジェット
- ボディタイプ別
- 大型ジェット機
- 小型ジェット機
- 中型ジェット機
- ピストン固定翼機
- その他
- 軍用機
- サブ航空機タイプ別
- 固定翼機
- ボディタイプ別
- 多用途航空機
- 訓練用航空機
- 輸送機
- その他
- 回転翼機
- ボディタイプ別
- マルチミッションヘリコプター
- 輸送用ヘリコプター
- その他
- 民間航空機
第6章 競合情勢
- 主要な戦略動向
- 市場シェア分析
- 企業情勢
- 企業プロファイル
- Airbus SE
- ATR
- Bombardier Inc.
- Dassault Aviation
- General Dynamics Corporation
- Hindustan Aeronautics Limited
- Leonardo S.p.A
- Lockheed Martin Corporation
- Textron Inc.
- The Boeing Company
第7章 CEOへの主要戦略的質問
第8章 付録
- 世界概要
- 概要
- ファイブフォース分析フレームワーク
- 世界のバリューチェーン分析
- 市場力学(DROs)
- 情報源と参考文献
- 図表一覧
- 主要な洞察
- データパック
- 用語集
目次
Product Code: 92734
The India Aviation Market size is estimated at 14.78 billion USD in 2025, and is expected to reach 26.08 billion USD by 2030, growing at a CAGR of 12.03% during the forecast period (2025-2030).
Commercial aviation is expected to dominate the market in India during the forecast period
- The civil and military aviation industry in India emerged as one of the fastest-growing industries in the country in the past few years. According to the Indian government, the commercial aviation sector contributed USD 30 billion to India's GDP in 2021. With this growth, the domestic aviation market is projected to rank third globally by 2024.
- Air traffic has been growing rapidly in the country as compared to the global average. The air fleet number may rise from the present 600 to 1,200 during 2024. The general aviation industry in India is considered a luxury for both business and private needs and strongly drives the country's economic growth. The surge of tourist traffic into India and the rising HNWIs have driven the growth of the general aviation sector in the country.
- Despite these driving factors, challenges in ease of doing business, complications with the tax structures, inadequate infrastructure, and complicated processes to obtain operating licenses have resulted in subdued growth of the business aviation market in India. India is a critical military aircraft market, as the country has been modernizing its aerial capabilities by procuring new aircraft and indigenously developing military aircraft to defend its borders from Pakistan and China.
- HAL is the largest manufacturer of aircraft and helicopters in India and has been producing BAE Hawk Trainers and Tejas LCA. It is also developing fifth-generation Advanced Medium Combat Aircraft under the Make in India initiative, with deliveries expected to start during the forecast period.
India Aviation Market Trends
Ease of restrictions and rising air passenger travel are driving the market demand
- In 2022, nearly 123.2 million passengers traveled by air. This was 47% more than the passenger numbers in 2021. The year closed with IndiGo retaining the market share crown at almost 55%, with others trailing far behind. Vistara and Air India were both a distant second in December with a market share of 9.2% each, followed by SpiceJet and AIX Connect (AirAsia India) with 7.6% each. Go First recorded a share of 7.5%, while Akasa Air ended the year with 2.3%.
- By carrying 69 million passengers in 2022, IndiGo improved its 2019 performance by a million when it carried almost 68 million passengers. This is after the company suffered from reduced capacity following the grounding of several of its planes. Domestic air passenger traffic grew 15 percent year-on-year to around 129 lakhs in December 2022 but remained 1 percent lower than the pre-pandemic level (December 2019). According to ICRA, the domestic aviation industry operated at an estimated passenger load factor of around 91% in December 2022 against approximately 80% in December 2021 and about 88% in December 2019.
- A total of 24.8 million passengers were carried by domestic airlines in India between January and March 2022, compared to 23.38 million during the same period in 2021. In March 2022, India resumed its scheduled international flights, leading to a surge in international passenger traffic. As a result, in April 2022, Indian carriers reached 1.85 million passengers, slightly surpassing the traffic recorded in April 2019, which was 1.83 million international passengers. As of January 2022, the country had air bubble arrangements with 35 countries aimed at restarting international travel. These air bubble arrangements will provide direct/indirect connectivity to more than 100 countries.
Geopolitical threats are the driving factor for rising defense expenditure
- India is the fourth-largest defense spender in the world and the second largest in the Asia-Pacific region. In 2022, the country's defense spending was USD 81.4 billion, a growth of 6% compared to 2021. India proposed USD 72.6 billion in defense spending for the 2023-24 financial year, 13% up from the previous period's initial estimates, aiming to add more fighter jets and roads along its tense border with China. The total Indian defense budget is estimated at 2% of GDP. India plans to spend nearly INR 242 billion (USD 3 billion) for naval fleet construction and INR 571.4 billion (USD 7 billion) for air force procurements, including more aircraft.
- The country's expenditure on capital outlays, which funds equipment upgrades for the armed forces and the military infrastructure along its disputed border with China, amounted to 23% of total military spending in 2022. Personnel expenses (e.g., salaries and pensions) remained the largest expenditure category in the Indian military budget, accounting for around half of all military spending.
- Recently, allocations for specifically indigenous purchases were made. The Tejas Light Combat Aircraft (LCA) Mk-1A, Light Combat Helicopters (LCH), basic trainer HTT-40 aircraft, Arjun Mk-1A tanks, several missiles, and other weapons may receive significant funding. Increased defense production will pave the way for exports and help offset expenses. Foreign equipment manufacturers are more likely to establish joint ventures (JVs) and attract foreign direct investment in high technology fields (FDI). Some of these joint ventures are also expected to aid in defense exports.
India Aviation Industry Overview
The India Aviation Market is fairly consolidated, with the top five companies occupying 92.04%. The major players in this market are Airbus SE, ATR, Dassault Aviation, Hindustan Aeronautics Limited and Lockheed Martin Corporation (sorted alphabetically).
Additional Benefits:
- The market estimate (ME) sheet in Excel format
- 3 months of analyst support
TABLE OF CONTENTS
1 EXECUTIVE SUMMARY & KEY FINDINGS
2 REPORT OFFERS
3 INTRODUCTION
- 3.1 Study Assumptions & Market Definition
- 3.2 Scope of the Study
- 3.3 Research Methodology
4 KEY INDUSTRY TRENDS
- 4.1 Air Passenger Traffic
- 4.2 Air Transport Freight
- 4.3 Gross Domestic Product
- 4.4 Revenue Passenger Kilometers (rpk)
- 4.5 Inflation Rate
- 4.6 Active Fleet Data
- 4.7 Defense Spending
- 4.8 High-net-worth Individual (hnwi)
- 4.9 Regulatory Framework
- 4.10 Value Chain Analysis
5 MARKET SEGMENTATION (includes market size in Value in USD and Volume, Forecasts up to 2030 and analysis of growth prospects)
- 5.1 Aircraft Type
- 5.1.1 Commercial Aviation
- 5.1.1.1 By Sub Aircraft Type
- 5.1.1.1.1 Passenger Aircraft
- 5.1.1.1.1.1 By Body Type
- 5.1.1.1.1.1.1 Narrowbody Aircraft
- 5.1.1.1.1.1.2 Widebody Aircraft
- 5.1.2 General Aviation
- 5.1.2.1 By Sub Aircraft Type
- 5.1.2.1.1 Business Jets
- 5.1.2.1.1.1 By Body Type
- 5.1.2.1.1.1.1 Large Jet
- 5.1.2.1.1.1.2 Light Jet
- 5.1.2.1.1.1.3 Mid-Size Jet
- 5.1.2.1.2 Piston Fixed-Wing Aircraft
- 5.1.2.1.3 Others
- 5.1.3 Military Aviation
- 5.1.3.1 By Sub Aircraft Type
- 5.1.3.1.1 Fixed-Wing Aircraft
- 5.1.3.1.1.1 By Body Type
- 5.1.3.1.1.1.1 Multi-Role Aircraft
- 5.1.3.1.1.1.2 Training Aircraft
- 5.1.3.1.1.1.3 Transport Aircraft
- 5.1.3.1.1.1.4 Others
- 5.1.3.1.2 Rotorcraft
- 5.1.3.1.2.1 By Body Type
- 5.1.3.1.2.1.1 Multi-Mission Helicopter
- 5.1.3.1.2.1.2 Transport Helicopter
- 5.1.3.1.2.1.3 Others
- 5.1.1 Commercial Aviation
6 COMPETITIVE LANDSCAPE
- 6.1 Key Strategic Moves
- 6.2 Market Share Analysis
- 6.3 Company Landscape
- 6.4 Company Profiles
- 6.4.1 Airbus SE
- 6.4.2 ATR
- 6.4.3 Bombardier Inc.
- 6.4.4 Dassault Aviation
- 6.4.5 General Dynamics Corporation
- 6.4.6 Hindustan Aeronautics Limited
- 6.4.7 Leonardo S.p.A
- 6.4.8 Lockheed Martin Corporation
- 6.4.9 Textron Inc.
- 6.4.10 The Boeing Company
7 KEY STRATEGIC QUESTIONS FOR AVIATION CEOS
8 APPENDIX
- 8.1 Global Overview
- 8.1.1 Overview
- 8.1.2 Porter's Five Forces Framework
- 8.1.3 Global Value Chain Analysis
- 8.1.4 Market Dynamics (DROs)
- 8.2 Sources & References
- 8.3 List of Tables & Figures
- 8.4 Primary Insights
- 8.5 Data Pack
- 8.6 Glossary of Terms
