
|
市場調査レポート
商品コード
1693533
欧州の特殊肥料:市場シェア分析、産業動向、成長予測(2025年~2030年)Europe Specialty Fertilizer - Market Share Analysis, Industry Trends & Statistics, Growth Forecasts (2025 - 2030) |
||||||
カスタマイズ可能
適宜更新あり
|
|||||||
| 欧州の特殊肥料:市場シェア分析、産業動向、成長予測(2025年~2030年) |
|
出版日: 2025年03月18日
発行: Mordor Intelligence
ページ情報: 英文 237 Pages
納期: 2~3営業日
|

全表示
- 概要
- 目次
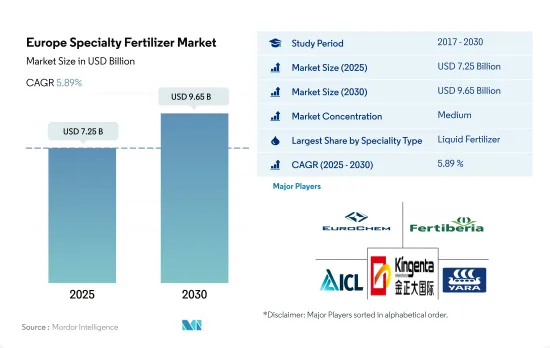
欧州の特殊肥料市場規模は2025年に72億5,000万米ドルと推定・予測され、2030年には96億5,000万米ドルに達し、予測期間中(2025~2030年)のCAGRは5.89%で成長すると予測されています。
特殊肥料市場の原動力は、環境汚染に対する関心の高まりと、高栄養効率の肥料需要の高まりです。
- 2022年、特殊肥料は同地域の肥料市場全体の13.0%を占め、従来型肥料が圧倒的に多いのとは対照的です。この格差は、特殊肥料のコストが高いことと、農業従事者の認識が限定的であることに起因しています。
- 2017~2021年にかけて、特殊肥料市場は顕著な成長を遂げ、2017年と比較して2022年には80.4%急増しました。この上昇は、灌漑農業とサステイナブル農法の採用が増加していることが大きく寄与しています。
- 市場金額では、液体肥料が2022年に48.8%のシェアを占め、一方、水溶性肥料は48.9%で市場規模を独占しました。液体肥料は1トン当たり平均1,051.2米ドルと、水溶性肥料が883.4米ドルであるのに比べ、高い価格で取引されています。この価格差は、他の特殊肥料に比べて価格が手ごろであることと相まって、水溶性肥料の利用率の高さにつながりました。
- 2022年には、水溶性肥料は二次多肥料用途に主に使用され、この地域の二次多肥料全体の53.2%を占めました。同様に、欧州では微量栄養素肥料の53.1%を占めています。
- 同地域では、環境リスクの低減と水質汚染の緩和という利点から、放出制御肥料の採用が増加しています。その結果、これらの肥料の市場規模は2023~2030年の間に7.7%のCAGRで推移すると予測されています。
- 特殊肥料の市場ポテンシャルが急成長していることから、このセグメントは今後数年間で大きく成長するものと考えられます。
近代的な農法の採用が増え、環境への影響が少ないことが市場成長の原動力となっています。
- 特殊肥料は土壌の肥沃度を高め、植物の成長を促進し、収量を最大化します。肥料の過剰使用は栄養分の損失と水質汚染につながります。特殊肥料はこれらの問題を軽減し、植物による栄養分の取り込みを促進します。
- 2022年、ウクライナは金額ベースで欧州の特殊肥料市場の14.9%のシェアを占めました。窒素肥料セグメントが調査対象市場で最大のシェアを占めました。欧州ではエネルギーの脱炭素化が進んでいるため、2023~2030年にかけて「グリーン」アンモニア肥料の需要が伸びると予想されています。
- 2022年の欧州の特殊肥料市場は畑作物が圧倒的で、消費量の82.4%を占め、次いで園芸作物が9.8%でした。畑作物の優位性は、その栽培面積の広さに起因しています。
- 2022年の市場数量シェアは、水溶性肥料が48.9%で最も大きく、次いで液体肥料が45.0%でした。放出制御型肥料(CRF)と緩効性肥料(SRF)のシェアはそれぞれ4.7%と1.3%と小さいです。水溶性肥料は、葉面散布または灌漑によって施用することができ、灌漑の普及に伴って人気が急上昇しています。
- 欧州の土壌は、十分な回復期間のない連作により、肥沃度がますます低下しています。特殊肥料は、環境への影響を最小限に抑えながら、タイムリーな栄養を記載しています。これらの要因が特殊肥料市場を牽引し、2023~2030年のCAGRは5.7%と予測されます。
欧州の特殊肥料市場の動向
国内需要と輸出需要を満たすため、畑作物の栽培面積は着実に増加しています。
- 菜種、小麦、ライ麦、ライ小麦などの畑作物は、欧州では主に冬作物であり、トウモロコシ、ヒマワリ、米、大豆は夏作物です。トウモロコシ、ヒマワリ、コメ、ダイズは夏作物です。大麦は冬作物も春作物も広く出回っています。欧州における主要食用作物の収穫面積は、主に人口増加と食用穀物需要の増加により、着実に増加しています。畑作物は2017年に7万8,500haを占め、2022年には10万8,000haに増加します。
- EUは2022年に2億8,270万トンの普通小麦を収穫し、これは全穀物収穫量の54.0%に相当します。これは2020年より1,100万トン多く、9.3%の増加です。この増加は、収穫面積の増加(5.6%増の2,180万ヘクタール)と見かけの収量の改善を反映しています。
- 2019~2022年にかけて、同地域の収穫面積は34%減少しました。この全体的な減少にもかかわらず、トウモロコシ/メイズの栽培面積は11%、小麦の栽培面積は2%増加したが、その他の畑作物の栽培面積は同期間に減少しました。農業従事者は、収量を向上させ、近年観察された収穫面積の全体的な減少の影響を緩和することを目的として、今後の予測期間において肥料の使用量を増加させることが予想されます。
- したがって、畑作物全体の栽培面積の増加に伴う需要の増加に対応するため、収量と穀物生産量を向上させなければならないという農業従事者への圧力が高まる中、肥料市場は2023~2030年にかけて大きく成長すると予想されます。
この地域の土壌のほとんどは窒素が不足しているため、窒素は畑作物でより多く消費される主要な養分です。
- 2022年には、欧州では畑作物が養分消費の大半を占め、全体の85%を占め、その量は4,700万トンに達しました。この高い需要は、畑作物の広範な栽培とその重要な養分要求量の両方に起因しています。欧州の主要な畑作作物には、小麦、菜種、ライ麦、大豆、トウモロコシなどがあり、いずれも肥料をかなり必要とします。2022年、これらの作物の平均養分施用量は、窒素、リン、カリウムで1ヘクタール当たり187.3kgでした。
- 窒素は、欧州の畑作物にとって最も需要の高い主要養分肥料として浮上し、2022年の平均施用量は1ヘクタール当たり130.64kgとなりました。同地域の農業土壌の大半は十分な窒素レベルがないため、窒素欠乏が最も大きな収量制約となっています。窒素に次いでカリウムが2番目に利用される肥料として目立ち、2022年の平均施用量は103.75kg/ヘクタールです。スウェーデン、スペイン、ポーランド、ラトビアのような砂質土壌の多い国では、カリウム不足が顕著でした。リン酸肥料は後塵を拝し、2022年の施用率は56.93kg/ヘクタールです。
- 一次栄養素肥料は、代謝プロセスに不可欠で、細胞、細胞膜、葉緑素などの重要な植物組織の形成に寄与するため、作物にとって非常に重要な役割を担っています。リンは高品質の作物を栽培する上で極めて重要な役割を果たし、カリウムは植物の成長と開発に不可欠な酵素を活性化します。
欧州の特殊肥料産業概要
欧州の特殊肥料市場は適度に統合されており、上位5社で56.79%を占めています。この市場の主要企業は、EuroChem Group、Fertiberia、ICL Group Ltd、Kingenta Ecological Engineering Group、Yara International ASAなどです。
その他の特典
- エクセル形式の市場予測(ME)シート
- 3ヶ月のアナリストサポート
目次
第1章 エグゼクティブサマリーと主要調査結果
第2章 レポートのオファー
第3章 イントロダクション
- 調査の前提条件と市場定義
- 調査範囲
- 調査手法
第4章 主要産業動向
- 主要作物の作付面積
- 畑作物
- 園芸作物
- 平均養分施用率
- 微量栄養素
- 畑作物
- 園芸作物
- 一次栄養素
- 畑作物
- 園芸作物
- 二次多量栄養素
- 畑作物
- 園芸作物
- 微量栄養素
- 灌漑農地
- 規制の枠組み
- バリューチェーンと流通チャネル分析
第5章 市場セグメンテーション
- 特殊タイプ
- CRF
- ポリマーコート
- ポリマー硫黄コーティング
- その他
- 液体肥料
- SRF
- 水溶性
- CRF
- 施肥モード
- 施肥
- 葉面散布
- 土壌
- 作物タイプ
- 畑作物
- 園芸作物
- 芝・観賞用
- 生産国
- フランス
- ドイツ
- イタリア
- オランダ
- ロシア
- スペイン
- ウクライナ
- 英国
- その他の欧州
第6章 競合情勢
- 主要な戦略動向
- 市場シェア分析
- 企業情勢
- 企業プロファイル
- Achema
- AGLUKON Spezialduenger GmbH & Co.
- EuroChem Group
- Fertiberia
- Grupa Azoty S.A.(Compo Expert)
- ICL Group Ltd
- Kingenta Ecological Engineering Group Co., Ltd.
- Petrokemija DD Fertilizer Factory
- Sociedad Quimica y Minera de Chile SA
- Yara International ASA
第7章 CEOへの主要戦略的質問
第8章 付録
- 世界概要
- 概要
- ファイブフォース分析フレームワーク
- 世界のバリューチェーン分析
- 市場力学(DROs)
- 情報源と参考文献
- 図表一覧
- 主要な洞察
- データパック
- 用語集
The Europe Specialty Fertilizer Market size is estimated at 7.25 billion USD in 2025, and is expected to reach 9.65 billion USD by 2030, growing at a CAGR of 5.89% during the forecast period (2025-2030).
The specialty fertilizer market is driven by the growing concern over environmental pollution and rising demand high nutrient efficient fertilizers
- In 2022, specialty fertilizers represented 13.0% of the overall fertilizer market value in the region, a stark contrast to the dominant conventional fertilizers. This disparity can be attributed to the higher costs of specialty fertilizers and limited awareness among farmers.
- From 2017 to 2021, the specialty fertilizers market experienced notable growth, surging by 80.4% in 2022 compared to 2017. This upswing can largely be credited to the increasing adoption of irrigation agriculture and sustainable farming practices.
- In terms of market value, liquid fertilizers held the lion's share at 48.8% in 2022, while water-soluble fertilizers dominated the market volume at 48.9%. Liquid fertilizers commanded higher prices, with an average of USD 1,051.2 per metric ton, compared to water-soluble fertilizers priced at USD 883.4. This price discrepancy, coupled with their affordability relative to other specialty fertilizers, led to a higher utilization of water-soluble fertilizers.
- Water-soluble fertilizers were predominantly employed for secondary macronutrient applications in 2022, accounting for 53.2% of the total secondary macronutrient fertilizers in the region. Similarly, they constituted 53.1% of the total micronutrient fertilizers in Europe.
- The adoption of controlled-release fertilizers is on the rise in the region, driven by their environmental risk reduction and water contamination mitigation benefits. As a result, the market value of these fertilizers is projected to record a CAGR of 7.7% during 2023-2030.
- Given the burgeoning market potential for specialty fertilizers, this segment is poised for significant growth in the coming years.
The growing adoption of modern farming practices is driving market growth due to its less impact on the environment
- Specialty fertilizers enhance soil fertility, boost plant growth, and maximize yields. Overuse of fertilizers leads to nutrient loss and water contamination. Specialty fertilizers mitigate these issues and enhance nutrient uptake by plants.
- In 2022, Ukraine accounted for the share of 14.9% of the European specialty fertilizer market in terms of value. The nitrogen fertilizer segment occupied the largest share of the market studied. Due to a shift toward decarbonization of energy in Europe, the demand for 'green' ammonia fertilizers is expected to grow during 2023-2030.
- Field crops dominated the European specialty fertilizer market in 2022, accounting for 82.4% of the consumption volume, followed by horticultural crops at 9.8%. The dominance of field crops is attributed to their larger cultivation areas.
- In 2022, water-soluble fertilizers claimed the largest market volume share at 48.9%, followed by liquid fertilizers at 45.0%. Controlled-release fertilizers (CRF) and slow-release fertilizers (SRF) held smaller shares at 4.7% and 1.3%, respectively. Water-soluble fertilizers can be applied either through foliar spraying or fertigation, and their popularity has surged with the rising adoption of irrigation practices.
- European soils are increasingly losing fertility due to continuous cropping without adequate recovery periods. Specialty fertilizers provide timely nutrition while minimizing environmental impact. These factors are projected to drive the specialty fertilizers market, with an estimated CAGR of 5.7% during 2023-2030.
Europe Specialty Fertilizer Market Trends
The cultivation area of field crops is steadily rising to meet domestic needs and export demand
- Field crops, such as rapeseed, wheat, rye, and triticale, are mainly winter crops in Europe, while maize, sunflowers, rice, and soybean are summer crops. Both the winter and spring types of barley are widely available. The area harvested under major food crops in Europe has been steadily increasing, primarily due to the growing population and increasing demand for food grains. Field crops accounted for 78.5 thousand ha in 2017, which increased to 108 thousand ha in 2022.
- The EU harvested 282.7 million ton of common wheat in 2022, the equivalent of 54.0% of all cereal grains harvested. This was 11.0 million ton more than in 2020, an increase of 9.3%. This upturn reflected a rise in the area harvested (+5.6 % to 21.8 million hectares) and improved apparent yields.
- Between 2019 and 2022, there was a notable 34% decline in the harvested area within the region. Despite this overall reduction, the areas dedicated to corn/maize and wheat cultivation experienced increases of 11% and 2%, respectively, while the other field crop acreages decreased during the same period. It is anticipated that farmers will augment their fertilizer usage in the upcoming forecast period, aiming to enhance yields and mitigate the impact of the overall decrease in harvested areas observed in recent years.
- Therefore, with rising pressure on farmers to improve yield and grain production to meet the growing demand with growing overall field crop cultivation area, the fertilizer market is expected to grow significantly during 2023-2030.
Nitrogen is the primary nutrient consumed more in filed crops as most of the soil in the region is deficient in nitrogen
- In 2022, field crops dominated nutrient consumption in Europe, accounting for 85% of the total and reaching a volume of 47 million metric tons. This high demand can be attributed to both the extensive cultivation of field crops and their significant nutrient requirements. The primary field crops in Europe include wheat, rapeseed, rye, soybean, and corn, all of which have a substantial appetite for fertilizers. In 2022, these crops had an average nutrient application rate of 187.3 kg per hectare for nitrogen, phosphorous, and potassium.
- Nitrogen emerged as the most in-demand primary nutrient fertilizer for European field crops, with an average application rate of 130.64 kg/hectare in 2022. Nitrogen deficiency poses the most significant yield constraint, as a majority of agricultural soils in the region lack sufficient nitrogen levels. Following nitrogen, potassium stood out as the second most utilized fertilizer, with an average application rate of 103.75 kg/hectare in 2022. Countries like Sweden, Spain, Poland, and Latvia, with a prevalence of sandy soils, faced more pronounced potassium deficiencies. Phosphatic fertilizers trailed behind with an application rate of 56.93 kg/hectare in 2022.
- Primary nutrient fertilizers hold immense significance for crops, as they are vital for metabolic processes and contribute to the formation of crucial plant tissues, such as cells, cell membranes, and chlorophyll. Phosphorous plays a pivotal role in cultivating high-quality crops, while potassium activates enzymes essential for plant growth and development.
Europe Specialty Fertilizer Industry Overview
The Europe Specialty Fertilizer Market is moderately consolidated, with the top five companies occupying 56.79%. The major players in this market are EuroChem Group, Fertiberia, ICL Group Ltd, Kingenta Ecological Engineering Group Co., Ltd. and Yara International ASA (sorted alphabetically).
Additional Benefits:
- The market estimate (ME) sheet in Excel format
- 3 months of analyst support
TABLE OF CONTENTS
1 EXECUTIVE SUMMARY & KEY FINDINGS
2 REPORT OFFERS
3 INTRODUCTION
- 3.1 Study Assumptions & Market Definition
- 3.2 Scope of the Study
- 3.3 Research Methodology
4 KEY INDUSTRY TRENDS
- 4.1 Acreage Of Major Crop Types
- 4.1.1 Field Crops
- 4.1.2 Horticultural Crops
- 4.2 Average Nutrient Application Rates
- 4.2.1 Micronutrients
- 4.2.1.1 Field Crops
- 4.2.1.2 Horticultural Crops
- 4.2.2 Primary Nutrients
- 4.2.2.1 Field Crops
- 4.2.2.2 Horticultural Crops
- 4.2.3 Secondary Macronutrients
- 4.2.3.1 Field Crops
- 4.2.3.2 Horticultural Crops
- 4.2.1 Micronutrients
- 4.3 Agricultural Land Equipped For Irrigation
- 4.4 Regulatory Framework
- 4.5 Value Chain & Distribution Channel Analysis
5 MARKET SEGMENTATION (includes market size in Value in USD and Volume, Forecasts up to 2030 and analysis of growth prospects)
- 5.1 Speciality Type
- 5.1.1 CRF
- 5.1.1.1 Polymer Coated
- 5.1.1.2 Polymer-Sulfur Coated
- 5.1.1.3 Others
- 5.1.2 Liquid Fertilizer
- 5.1.3 SRF
- 5.1.4 Water Soluble
- 5.1.1 CRF
- 5.2 Application Mode
- 5.2.1 Fertigation
- 5.2.2 Foliar
- 5.2.3 Soil
- 5.3 Crop Type
- 5.3.1 Field Crops
- 5.3.2 Horticultural Crops
- 5.3.3 Turf & Ornamental
- 5.4 Country
- 5.4.1 France
- 5.4.2 Germany
- 5.4.3 Italy
- 5.4.4 Netherlands
- 5.4.5 Russia
- 5.4.6 Spain
- 5.4.7 Ukraine
- 5.4.8 United Kingdom
- 5.4.9 Rest of Europe
6 COMPETITIVE LANDSCAPE
- 6.1 Key Strategic Moves
- 6.2 Market Share Analysis
- 6.3 Company Landscape
- 6.4 Company Profiles
- 6.4.1 Achema
- 6.4.2 AGLUKON Spezialduenger GmbH & Co.
- 6.4.3 EuroChem Group
- 6.4.4 Fertiberia
- 6.4.5 Grupa Azoty S.A. (Compo Expert)
- 6.4.6 ICL Group Ltd
- 6.4.7 Kingenta Ecological Engineering Group Co., Ltd.
- 6.4.8 Petrokemija DD Fertilizer Factory
- 6.4.9 Sociedad Quimica y Minera de Chile SA
- 6.4.10 Yara International ASA
7 KEY STRATEGIC QUESTIONS FOR FERTILIZER CEOS
8 APPENDIX
- 8.1 Global Overview
- 8.1.1 Overview
- 8.1.2 Porter's Five Forces Framework
- 8.1.3 Global Value Chain Analysis
- 8.1.4 Market Dynamics (DROs)
- 8.2 Sources & References
- 8.3 List of Tables & Figures
- 8.4 Primary Insights
- 8.5 Data Pack
- 8.6 Glossary of Terms

