
インドの特殊肥料:市場シェア分析、産業動向・統計、成長予測(2025年~2030年)
India Specialty Fertilizer - Market Share Analysis, Industry Trends & Statistics, Growth Forecasts (2025 - 2030)- 発行日
- ページ情報
- 英文 192 Pages
- 納期
- 2~3営業日
- 商品コード
- 1693510
- カスタマイズ可能 お客様のご希望に応じて、既存データの加工や未掲載情報(例:国別セグメント)の追加などの対応が可能です。詳細はお問い合わせください。
- 適宜更新あり 本レポートは最新情報反映のため適宜更新し、内容構成変更を行う場合があります。ご検討の際はお問い合わせください。
- 翻訳ツール提供対象 PDF対応AI翻訳ツールの無料貸し出しサービスのご利用が可能です
概要
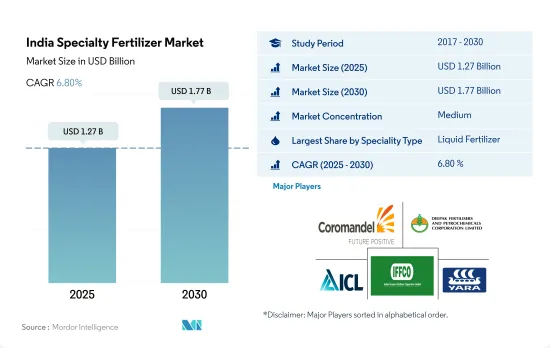
インドの特殊肥料市場規模は2025年に12億7,000万米ドルと推定・予測され、2030年には17億7,000万米ドルに達し、予測期間(2025-2030年)のCAGRは6.80%で成長すると予測されています。
持続可能な農法と環境安全性の向上が特殊肥料の使用を促進
- 同国の放出制御肥料市場は、2017~2021年の間に消費量が24.2%増加したのに対し、市場金額が106.1%増加しました。その主な理由は、インド政府が尿素の国内全生産者に100%ニームコート尿素の生産と農家への補助金付き価格での流通を義務付けたことです。
- 2022年のインドの特殊肥料市場の49.7%を液体肥料が占めました。液体肥料市場では、複合肥料が75.7%と最大のシェアを占めています。この分野は2017年に2億610万米ドルと評価され、2030年には21億2,000万米ドルに達すると予測されています。同様に、ストレート肥料は2022年に液体肥料市場の24.3%を占めました。
- 緩効性肥料は、2022年の特殊肥料市場の1.0%を占めています。畑作物と園芸作物が緩効性肥料の主な消費者で、2022年の市場量の89.6%と10.2%を占める。同国では畑作物や園芸作物の栽培が盛んであるため、緩効性肥料市場の牽引役となることが予想されます。
- 特殊肥料市場では、2022年に水溶性肥料が金額シェアで46.2%を占める。水溶性肥料市場は2017~2021年に安定した成長を示し、2022年には14億6,000万米ドルとなりました。畑作物が88.8%の最大シェアを占め、園芸作物がこれに続きます。
- 高効率肥料への需要の高まり、施肥の容易さ、持続可能な農法の採用、より高い環境安全性が、インドの特殊肥料市場を牽引する要因の一つです。
インドの特殊肥料市場の動向
マンガン欠乏症は欧州諸国では一般的な問題で、砂質土壌、pH6以上の有機土壌に最も多く見られます。
- 同国における畑作物の栽培面積は、2017~2022年の間に3.5%増加しました。国内外での消費者需要の高まりによる同国での穀物、豆類、油糧種子の栽培増加が、栽培面積増加の主な原動力となっています。
- 作物の種類別では、米、小麦、大豆の栽培面積が最も大きく、2022年には4,700万ha、3,110万ha、1,230万haを占める。米はインドで最も重要な食用作物であり、全作付面積の約4分の1を占め、インド人口の約半数に食糧を供給しています。主に西ベンガル州、ウッタル・プラデシュ州、アンドラ・プラデシュ州、パンジャブ州、タミル・ナードゥ州で栽培されています。
- それに伴い、同国の米の消費量は2016年の9,580万トンから2022年には1億700万トンに増加しており、これは同国における同作物に対する需要の高まりを示すものです。この動向は、2023年から2030年にかけての肥料需要をさらに押し上げると予想されます。同様に、国内の小麦栽培は2017年の9,850万トンから2020年には1億760万トンに増加しています。パンジャブ州、西ベンガル州、ハリヤナ州、ラジャスタン州で主に栽培されています。小麦はインドで2番目に重要な穀物作物であり、同国の食料・栄養安全保障において重要な役割を果たしています。そのため、同国では穀物の栽培が盛んであり、国内外の需要の高まりと相まって、2023年から2030年にかけてインドの肥料市場を牽引すると予想されています。
一次栄養素のうち、窒素は畑作で最も施用されている栄養素であり、平均施用量は1ヘクタール当たり223.5kgです。
- 2022年の一次栄養素全体の平均施用量は125.1kg/haで、窒素などの栄養素の平均施用量は223.5kg/haと最も高いです。従って、窒素は国内で集中的に栽培されている稲などの作物の主要な養分源であり、このような土壌の養分不足が全国の稲の生産性を制限しています。
- インドにおけるバイオ肥料と有機肥料の状況は、土壌の健康状態が悪く、化学肥料の消費が増加していることを示しています。その結果、検査した土壌の97.0%、83.0%、71.0%が窒素、リン、カリウムが不足していることが判明しました。
- 作物別では、2022年の平均養分施用量が最も多い作物は小麦、稲、トウモロコシ/メイズで、231kg/ha、156kg/ha、149kg/haと推定されました。小麦と米は、国内的にも世界的にも重要な主食です。複数の養分欠乏が収量と利益を減少させる重要な要因です。小麦と稲の作物は、窒素、リン、カリウムのほか、硫黄、ホウ素、鉄、亜鉛などの微量栄養素を適切な成長と開発に必要とします。作物生産を成功させるためには、養分の適切な管理が必要であり、それが市場成長の原動力となっています。
- 畑作物は、窒素肥料などの一次栄養素を最大限に消費します。同国では穀物や穀類が集中的に栽培されているため、土壌の栄養分が枯渇しており、それを補うためにより多くの肥料が必要となります。
インドの特殊肥料産業の概要
インドの特殊肥料市場は適度に統合されており、上位5社で48.56%を占めています。この市場の主要企業は以下の通りです。 Coromandel International Ltd., Deepak fertilizers & Petrochemicals Corporation Ltd, ICL Group Ltd, Indian Farmers Fertiliser Cooperative Limited and Yara International ASA(アルファベット順)
その他の特典
- エクセル形式の市場予測(ME)シート
- 3ヶ月のアナリストサポート
目次
第1章 エグゼクティブサマリーと主な調査結果
第2章 レポートのオファー
第3章 イントロダクション
- 調査の前提条件と市場定義
- 調査範囲
- 調査手法
第4章 主要産業動向
- 主要作物の作付面積
- 畑作物
- 園芸作物
- 平均養分施用率
- 微量栄養素
- 畑作物
- 園芸作物
- 一次栄養素
- 畑作物
- 園芸作物
- 二次多量栄養素
- 畑作物
- 園芸作物
- 微量栄養素
- 灌漑農地
- 規制の枠組み
- バリューチェーンと流通チャネル分析
第5章 市場セグメンテーション
- スペシャリティタイプ
- CRF
- ポリマーコート
- ポリマー硫黄コーティング
- その他
- 液体肥料
- SRF
- 水溶性
- CRF
- 施肥モード
- 施肥
- 葉面散布
- 土壌
- 作物タイプ
- 畑作物
- 園芸作物
- 芝・観賞用
第6章 競合情勢
- 主要な戦略動向
- 市場シェア分析
- 企業情勢
- 企業プロファイル
- Chambal Fertilizers & Chemicals Ltd
- Coromandel International Ltd.
- Deepak fertilizers & Petrochemicals Corporation Ltd
- Grupa Azoty S.A.(Compo Expert)
- Haifa Group
- ICL Group Ltd
- Indian Farmers Fertiliser Cooperative Limited
- Mangalore Chemicals & Fertilizers Ltd.
- Sociedad Quimica y Minera de Chile SA
- Yara International ASA
第7章 CEOへの主な戦略的質問
第8章 付録
- 世界概要
- 概要
- ファイブフォース分析フレームワーク
- 世界のバリューチェーン分析
- 市場力学(DROs)
- 情報源と参考文献
- 図表一覧
- 主要洞察
- データパック
- 用語集
目次
The India Specialty Fertilizer Market size is estimated at 1.27 billion USD in 2025, and is expected to reach 1.77 billion USD by 2030, growing at a CAGR of 6.80% during the forecast period (2025-2030).
Sustainable farming practices and higher environmental safety are being adopted, driving the usage of specialty fertilizers
- The controlled-release fertilizer market in the country witnessed an increase in market value by 106.1%, whereas the consumption volume increased by 24.2% during 2017-2021. The main reason for this was the Government of India making it mandatory for all domestic producers of urea to produce 100% neem-coated urea and distribute it at a subsidized price to the farmers.
- Liquid fertilizers accounted for 49.7% of India's specialty fertilizer market in 2022. Complex fertilizers accounted for the maximum share in the liquid fertilizer market, i.e., 75.7%. This segment was valued at USD 206.1 million in 2017, which is anticipated to reach USD 2.12 billion by 2030. Similarly, straight fertilizers accounted for 24.3% of the liquid fertilizers market in 2022.
- Slow-release fertilizers accounted for 1.0% of the specialty fertilizer market value in 2022. Field crops and horticultural crops are the major consumers of slow-release fertilizers, accounting for 89.6% and 10.2% of the market volume in 2022. The intensive field crop and horticultural crop cultivation in the country are anticipated to drive the market for slow-release fertilizers.
- In the specialty fertilizer market, water-soluble fertilizers accounted for 46.2% of the value share in 2022. The water-soluble fertilizer market witnessed stable growth during 2017-2021, valued at USD 1.46 billion in 2022. Field crops occupied the largest share of 88.8%, followed by horticultural crops.
- The rise in demand for high-efficiency fertilizers, ease of application, adoption of sustainable farming practices, and higher environmental safety are some of the factors driving the specialty fertilizer market in India.
India Specialty Fertilizer Market Trends
manganese deficiency is a common problem in European countries, which most frequently affects sandy soils, organic soils with a pH above 6
- The area under field crop cultivation in the country increased by 3.5% during 2017-2022. The increased cultivation of cereals, pulses, and oilseeds in the country due to the rising consumer demand domestically and internationally is the major driving factor for the rising acreage.
- By crop type, rice, wheat, and soybean occupied the largest area under cultivation in the country, accounting for 47 million ha, 31.1 million ha, and 12.3 million ha in the year 2022. Rice is the most important food crop of India, covering about one-fourth of the total cropped area and providing food to about half of the Indian population. It is cultivated in almost all the states of the country, mainly in West Bengal, Uttar Pradesh, Andhra Pradesh, Punjab, and Tamil Nadu.
- Accordingly, rice consumption in the country increased from 95.8 million tons in 2016 to 107 million tons in 2022, which shows the rising demand for the crop in the country. This trend is further anticipated to drive the demand for fertilizers during 2023-2030. Similarly, wheat cultivation in the country increased from 98.5 million tons in 2017 to 107.6 million tons in the year 2020. It is cultivated majorly in Punjab, West Bengal, Haryana, and Rajasthan. Wheat is the second most important cereal crop in India and plays a vital role in the food and nutritional security of the country. Therefore, the intense cereal cultivation in the country, coupled with rising domestic and international demand, is anticipated to drive the Indian fertilizer market during 2023-2030.
Among the primary nutrients, nitrogen is the most-applied nutrient in field crops, with an average application rate of 223.5 kg per hectare
- The overall primary nutrient average application rate in 2022 was 125.1 kg/ha, with nutrients such as nitrogen with the highest average application rate of 223.5 kg/ha. Accordingly, nitrogen is the major source of nutrients for crops such as rice, which is intensively cultivated in the country, and such nutrient deficiency in soil is limiting rice productivity across the nation.
- The State of Biofertilizers and Organic Fertilizers in India marked poor status of soil health and increasing consumption of chemical fertilizers in India. Accordingly, 97.0%, 83.0%, and 71.0% of the soil tested were found to be deficient in nitrogen, phosphorous, and potassium.
- By crop, wheat, rice, and corn/maize were estimated to be the crop types with the highest average nutrient application rate of 231, 156, and 149 kg/ha in 2022. Wheat and rice are important staple food domestically and globally. Multiple nutrient deficiencies are the key factors that reduce yield and profit. Wheat and rice crops require nitrogen, phosphorous, and potassium, along with other micronutrients such as sulfur, boron, iron, and zinc, for their proper growth and development. The proper management of nutrients is necessary for successful crop production, which in turn is driving market growth.
- Field crops consume the maximum amount of primary nutrients, such as nitrogen fertilizer. As grains and cereals are intensively grown in the country, the soil is depleted of its nutrition, and hence they require more amount of fertilizers to supplement them, which in turn is anticipated to drive the market during 2023-2030.
India Specialty Fertilizer Industry Overview
The India Specialty Fertilizer Market is moderately consolidated, with the top five companies occupying 48.56%. The major players in this market are Coromandel International Ltd., Deepak fertilizers & Petrochemicals Corporation Ltd, ICL Group Ltd, Indian Farmers Fertiliser Cooperative Limited and Yara International ASA (sorted alphabetically).
Additional Benefits:
- The market estimate (ME) sheet in Excel format
- 3 months of analyst support
TABLE OF CONTENTS
1 EXECUTIVE SUMMARY & KEY FINDINGS
2 REPORT OFFERS
3 INTRODUCTION
- 3.1 Study Assumptions & Market Definition
- 3.2 Scope of the Study
- 3.3 Research Methodology
4 KEY INDUSTRY TRENDS
- 4.1 Acreage Of Major Crop Types
- 4.1.1 Field Crops
- 4.1.2 Horticultural Crops
- 4.2 Average Nutrient Application Rates
- 4.2.1 Micronutrients
- 4.2.1.1 Field Crops
- 4.2.1.2 Horticultural Crops
- 4.2.2 Primary Nutrients
- 4.2.2.1 Field Crops
- 4.2.2.2 Horticultural Crops
- 4.2.3 Secondary Macronutrients
- 4.2.3.1 Field Crops
- 4.2.3.2 Horticultural Crops
- 4.2.1 Micronutrients
- 4.3 Agricultural Land Equipped For Irrigation
- 4.4 Regulatory Framework
- 4.5 Value Chain & Distribution Channel Analysis
5 MARKET SEGMENTATION (includes market size in Value in USD and Volume, Forecasts up to 2030 and analysis of growth prospects)
- 5.1 Speciality Type
- 5.1.1 CRF
- 5.1.1.1 Polymer Coated
- 5.1.1.2 Polymer-Sulfur Coated
- 5.1.1.3 Others
- 5.1.2 Liquid Fertilizer
- 5.1.3 SRF
- 5.1.4 Water Soluble
- 5.1.1 CRF
- 5.2 Application Mode
- 5.2.1 Fertigation
- 5.2.2 Foliar
- 5.2.3 Soil
- 5.3 Crop Type
- 5.3.1 Field Crops
- 5.3.2 Horticultural Crops
- 5.3.3 Turf & Ornamental
6 COMPETITIVE LANDSCAPE
- 6.1 Key Strategic Moves
- 6.2 Market Share Analysis
- 6.3 Company Landscape
- 6.4 Company Profiles
- 6.4.1 Chambal Fertilizers & Chemicals Ltd
- 6.4.2 Coromandel International Ltd.
- 6.4.3 Deepak fertilizers & Petrochemicals Corporation Ltd
- 6.4.4 Grupa Azoty S.A. (Compo Expert)
- 6.4.5 Haifa Group
- 6.4.6 ICL Group Ltd
- 6.4.7 Indian Farmers Fertiliser Cooperative Limited
- 6.4.8 Mangalore Chemicals & Fertilizers Ltd.
- 6.4.9 Sociedad Quimica y Minera de Chile SA
- 6.4.10 Yara International ASA
7 KEY STRATEGIC QUESTIONS FOR FERTILIZER CEOS
8 APPENDIX
- 8.1 Global Overview
- 8.1.1 Overview
- 8.1.2 Porter's Five Forces Framework
- 8.1.3 Global Value Chain Analysis
- 8.1.4 Market Dynamics (DROs)
- 8.2 Sources & References
- 8.3 List of Tables & Figures
- 8.4 Primary Insights
- 8.5 Data Pack
- 8.6 Glossary of Terms
- 発行日
- 発行
- Mordor Intelligence
- ページ情報
- 英文 192 Pages
- 納期
- 2~3営業日


