
|
市場調査レポート
商品コード
1693529
北米の特殊肥料:市場シェア分析、産業動向、成長予測(2025年~2030年)North America Specialty Fertilizer - Market Share Analysis, Industry Trends & Statistics, Growth Forecasts (2025 - 2030) |
||||||
カスタマイズ可能
適宜更新あり
|
|||||||
| 北米の特殊肥料:市場シェア分析、産業動向、成長予測(2025年~2030年) |
|
出版日: 2025年03月18日
発行: Mordor Intelligence
ページ情報: 英文 218 Pages
納期: 2~3営業日
|

全表示
- 概要
- 目次
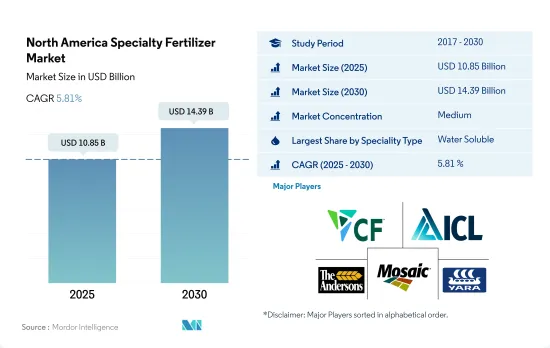
北米の特殊肥料市場規模は2025年に108億5,000万米ドルと推定され、2030年には143億9,000万米ドルに達すると予測され、予測期間中(2025~2030年)のCAGRは5.81%で成長する見込みです。
幅広い栄養グレードとさまざまな施用方法があるため、市場は水溶性肥料が支配的です。
- 2022年には、水溶性肥料が北米の特殊肥料市場で最大シェアを占め、47.9%を占めました。これらの肥料の需要は、特定のニーズによる栄養グレードや、葉面散布や施肥などの施用方法によって左右されます。特に2022年には、葉面散布が市場の45.2%を占め、潅注は54.8%を占めました。
- 液体肥料は2022年に45.9%で2番目の市場シェアを確保しました。この地域の耕地が酸性であることから、硝酸アンモニウムのような液体ベースの特殊肥料を好む傾向が強まっています。これらの肥料は土壌のpHレベルを維持するのに役立つだけでなく、環境保護論者と農業従事者の双方にとって重要な問題である窒素の溶出に関する懸念にも対処することができます。
- 放出制御肥料は、市場シェア4.9%とわずかだが、精密農業において極めて重要な役割を果たしています。作物に正確な栄養分を与えることで、現代農業に欠かせないものとなっています。
- 2022年には、米国が北米の特殊肥料市場の67.1%と大きな割合を占めました。米国市場では、水溶性肥料と液体肥料が支配的なセグメントでした。同様に、調査期間中、米国では葉面散布と灌漑が強く選好されていることが明らかになったが、これは同国の灌漑インフラがよく整備されていることに起因する動向です。
- 灌漑システムが発達し、畑作物、芝、観葉植物への需要が伸びていることから、米国の特殊肥料市場は今後数年間で成長する見込みです。
米国は、発達した農業システムと国全体の耕作面積の広さによって市場を独占しています。
- 2022年、米国は北米の特殊肥料市場で圧倒的な地位を占めました。市場シェアは水溶性肥料が48.0%、液体肥料が46.3%、CRFが5.1%でした。緩効性肥料のシェアは0.6%と小さく、これは主に小麦、トウモロコシ、穀類などの主要作物での採用が限られているためです。しかし、同セグメントの成長は、同国のマイクロ灌漑システムの開発によって後押しされると予想されます。2022年、米国の灌漑耕作地は1,830万ヘクタールに及びました。
- 北米では、カナダが第2位の特殊肥料市場を持ち、米国がそれに続きます。2023~2030年にかけて、カナダの特殊肥料市場はCAGR 6.4%を記録すると予想されています。
- メキシコは2022年に北米の特殊肥料市場で16.0%のシェアを占めました。特に、メキシコの畑作物は2022年に220万トンとなり、2030年には280万トンに増加する見込みです。
- 特殊肥料は、主にCOVID-19パンデミックによるサプライチェーンの混乱が原因で、2019年と2020年に金額と数量の両方で顕著な落ち込みを経験しました。しかし、2021年には原料価格の上昇と需要の増加により市場は回復しました。
- 精密技術の採用拡大が特殊肥料の需要を牽引すると予想されます。最適な肥料散布を重視する精密農業は、放出制御型や緩効性といった特殊肥料の特性とよく合致しています。その結果、北米の特殊肥料市場は2023~2030年にCAGR 5.6%を記録すると予測されています。
北米の特殊肥料市場の動向
補助金など政府による財政支援が畑作物の拡大に貢献
- 北米の農場では、畑作物を中心にさまざまな作物が栽培されています。トウモロコシ、綿花、米、大豆、小麦は、この地域で主要な畑作物の一部です。米国、カナダ、メキシコは、この地域の農業生産に大きく貢献しています。2022年、北米では畑作物が栽培全体の約97.6%を占め、穀物と油糧種子が市場を独占しています。
- 国別では米国が市場を独占し、調査期間中の作物栽培面積全体の1億3,570万ヘクタールを占めています。畑作と園芸が面積の大半を占め、2022年のシェアは97.2%と2.8%でした。しかし、2018~2019年にかけて、テキサスやヒューストンなどの地域で大洪水が発生した不利な環境条件のため、作物栽培面積が大幅に減少しました。
- 米国中西部の伝統的地域で、インディアナ西部、イリノイ州、アイオワ州、ミズーリ州、ネブラスカ州東部、カンザス州東部をほぼカバーし、トウモロコシと大豆が主要作物です。また、米の主要輸出国でもあり、この地域の米栽培は主に4つの地域に集中しています。この地域の畑作物の市場ポテンシャルの増大は、政府の資金援助と保護の強化と相まって、この地域の畑作物栽培面積を押し上げると予想されます。
一次栄養素の中でも窒素は畑作物への施用量が多く、229.8kg/ヘクタールに相当します。
- 稲、トウモロコシ/メイズ、小麦、菜種/カノーラなどの畑作物は、この地域で主要な一次養分を消費する作物の一部です。2022年には、約140.85kg/ヘクタールの一次栄養素がコメで消費され、次いで118.40kg/ヘクタールの菜種/カノーラで消費されます。穀物が最も多く窒素肥料を消費すると予想されます。この地域では集中的に栽培されているため、土壌の栄養素が枯渇し、成長を補うために多くの肥料が必要となります。
- 一次栄養素の中では窒素の施用量が多く、2022年には約74.0%を占め、畑作物では229.8kg/ヘクタールに相当します。しかし、窒素欠乏はこの地域で最も一般的な作物養分の問題のひとつです。そのため、窒素補給のほとんどは土壌施用によって行われています。土壌に施用されると、窒素は植物が吸収しやすいようにミネラル硝酸塩に変換されます。主要な窒素消費作物である菜種は、米国で広く栽培されています。
- 菜種は、潤滑油、油圧作動油、プラスチックなどの工業用途の油の抽出に使用されます。肥料の使用量は土壌の質と降雨の可能性によるが、窒素要求量は100~150ポンド/エーカーです。リンとカリウムの施肥率も土壌によって異なります。しかし、AgMRCによると、推奨される割合は0~80ポンド/エーカー、0~140ポンド/エーカーです。
- 一次養分は様々な作物の主要な養分源であるため、土壌の枯渇や溶出などにより、その施用量は年々大幅に増加すると予想されます。
北米の特殊肥料産業概要
北米の特殊肥料市場は適度に統合されており、上位5社で63.41%を占めています。この市場の主要企業は、CF Industries Holdings、Inc.、ICL Group Ltd、The Andersons Inc.、The Mosaic Company、Yara International ASAなどです。
その他の特典
- エクセル形式の市場予測(ME)シート
- 3ヶ月のアナリストサポート
目次
第1章 エグゼクティブサマリーと主要調査結果
第2章 レポートのオファー
第3章 イントロダクション
- 調査の前提条件と市場定義
- 調査範囲
- 調査手法
第4章 主要産業動向
- 主要作物の作付面積
- 畑作物
- 園芸作物
- 平均養分施用率
- 微量栄養素
- 畑作物
- 園芸作物
- 一次栄養素
- 畑作物
- 園芸作物
- 二次多量栄養素
- 畑作物
- 園芸作物
- 微量栄養素
- 灌漑農地
- 規制の枠組み
- バリューチェーンと流通チャネル分析
第5章 市場セグメンテーション
- 特殊タイプ
- CRF
- ポリマーコート
- ポリマー硫黄コーティング
- その他
- 液体肥料
- SRF
- 水溶性
- CRF
- 施肥モード
- 施肥
- 葉面散布
- 土壌
- 作物タイプ
- 畑作物
- 園芸作物
- 芝・観賞用
- 生産国
- カナダ
- メキシコ
- 米国
- その他の北米地域
第6章 競争情勢
- 主要な戦略動向
- 市場シェア分析
- 企業情勢
- 企業プロファイル
- CF Industries Holdings, Inc.
- Haifa Group
- ICL Group Ltd
- Koch Industries Inc.
- Nutrien Ltd.
- Sociedad Quimica y Minera de Chile SA
- The Andersons Inc.
- The Mosaic Company
- Wilbur-Ellis Company LLC
- Yara International ASA
第7章 CEOへの主要戦略的質問
第8章 付録
- 世界概要
- 概要
- ファイブフォース分析フレームワーク
- 世界のバリューチェーン分析
- 市場力学(DROs)
- 情報源と参考文献
- 図表一覧
- 主要な洞察
- データパック
- 用語集
The North America Specialty Fertilizer Market size is estimated at 10.85 billion USD in 2025, and is expected to reach 14.39 billion USD by 2030, growing at a CAGR of 5.81% during the forecast period (2025-2030).
The market is dominated by water-soluble fertilizers due to the wide range of nutrient grades and different application methods
- In 2022, water-soluble fertilizers held the maximum share of the North American specialty fertilizers market, accounting for 47.9%. The demand for these fertilizers is influenced by nutrient grades and application modes, such as foliar or fertigation, based on specific needs. Notably, in 2022, foliar application accounted for 45.2% of the market, while fertigation claimed 54.8%.
- Liquid fertilizers secured the second-largest market share at 45.9% in 2022. Given the acidic nature of arable lands in the region, there's a growing preference for liquid-based specialty fertilizers like ammonium nitrate. These fertilizers not only help maintain soil pH levels but also address concerns about nitrogen leaching, a key issue for both environmentalists and farmers.
- Controlled-release fertilizers, with a modest 4.9% market share, play a pivotal role in precision farming. By ensuring crops receive precise nutrient dosages, they have become indispensable in modern agriculture.
- In 2022, the US accounted for a significant chunk, 67.1%, of the North American specialty fertilizer market. Water-soluble and liquid fertilizers were the dominant segments in the US market. Likewise, the study period revealed a strong preference for foliar and fertigation modes in the US, a trend attributed to the country's well-established irrigation infrastructure.
- With a well-developed irrigation system and growing demand for field crops, turfs, and ornamentals, the specialty fertilizer market in the US is poised for growth in the coming years.
The United States dominates the market due to well-developed agricultural systems and larger cultivation area across the country
- In 2022, the United States held a dominant position in the North American specialty fertilizers market. Water-soluble fertilizers, liquid fertilizers, and CRF accounted for 48.0%, 46.3%, and 5.1% of the market share, respectively. Slow-release fertilizers had a smaller share of 0.6%, primarily due to limited adoption in major crops like wheat, maize, and cereals. However, the segment's growth is expected to be bolstered by the country's developing micro-irrigation system. In 2022, the total irrigated cropland in the US spanned 18.3 million hectares.
- In North America, Canada has the second-largest specialty fertilizer market, followed by the United States. During 2023-2030, the country's specialty fertilizer market is anticipated to register a CAGR of 6.4%.
- Mexico held a 16.0% share of the North American specialty fertilizers market in 2022. Notably, Mexico's field crops saw a volume of 2.2 million metric tons in 2022, with an expected rise to 2.8 million metric tons by 2030.
- Specialty fertilizers experienced a notable decline in both value and volume in 2019 and 2020, primarily due to disruptions in the supply chain caused by the COVID-19 pandemic. However, the market rebounded in 2021, driven by rising raw material prices and increased demand.
- The growing adoption of precision technologies is expected to drive the demand for specialty fertilizers. Precision farming, which emphasizes optimal fertilizer application, aligns well with the characteristics of specialty fertilizers like controlled-release and slow-release variants. As a result, the North American specialty fertilizers market is projected to register a CAGR of 5.6% during 2023-2030.
North America Specialty Fertilizer Market Trends
Financial support by the government, such as subsidies, has contributed to the expansion of field crops
- A wide array of crops are grown on North American farms, mainly covering field crops. Corn, cotton, rice, soybean, and wheat are some of the dominating field crops across the region. The United States, Canada, and Mexico are major contributors to the region's agricultural output. In 2022, field crops covered around 97.6% of the overall cultivation in North America, with cereals and oilseeds dominating the market.
- By country, the United States dominates the market, covering 135.7 million hectares of the overall area under crop cultivation during the study period. Field crops and horticulture covered the majority of the area and accounted for shares of 97.2% and 2.8% in 2022. However, between 2018 and 2019, the country witnessed a significant dip in crop acreages majorly due to unfavorable environmental conditions resulting in heavy floods in areas like Texas and Houston.
- The largest crop cultivated is corn, the majority of which is grown in a region known as the 'Corn Belt,' It is a traditional area in the midwestern United States, roughly covering western Indiana, Illinois, Iowa, Missouri, eastern Nebraska, and eastern Kansas, in which corn (maize) and soybeans are the dominant crops. Also, it is the major rice exporter, and rice cultivation in the region is mainly concentrated within four regions, with three in the South and one in California. The increased market potential for the region's field crops, coupled with increased government funding and protection, is anticipated to positively drive the area under field crop cultivation in the region.
Among all the primary nutrients, nitrogen is applied in a higher quantity to field crops, which is equivalent to 229.8 kg/hectare
- Field crops, such as rice, corn/maize, wheat, and rapeseed/canola, are some of the major primary nutrient-consuming crops in the region. In 2022, about 140.85 kg/hectare of primary nutrients were consumed by rice, followed by 118.40 kg/hectare consumed by rapeseed/canola. Cereals are anticipated to consume the maximum amount of nitrogen-based fertilizers. As they are grown intensively in the region, they deplete the nutrients in the soil and require more fertilizers to supplement growth.
- Among all the primary nutrients, nitrogen is applied in a higher quantity, accounting for about 74.0% in 2022, equivalent to 229.8 kg/hectare for field crops. Nitrogen deficiency, however, is one of the most prevalent crop nutrient problems in the region. Hence, most of the nitrogen supplement is provided through soil application. When applied to the soil, nitrogen is converted to mineral nitrate for the plants to absorb easily. Rapeseed, the major nitrogen-consuming crop, is widely grown in the United States.
- Rapeseed is used for extracting oil for industrial applications, like lubricants, hydraulic fluids, and plastics. While fertilizer usage is based on soil quality and rainfall potential, its nitrogen requirements range from 100 to 150 lbs./acre. Phosphorus and potassium fertility rates also vary from soil to soil. However, the recommended rates range from 0 to 80 lbs./acre and 0 to 140 lbs./acre, as per the AgMRC.
- Since primary nutrients are the major sources of nutrients for various crops, their application rates are anticipated to grow significantly over the years due to soil depletion, leaching, etc.
North America Specialty Fertilizer Industry Overview
The North America Specialty Fertilizer Market is moderately consolidated, with the top five companies occupying 63.41%. The major players in this market are CF Industries Holdings, Inc., ICL Group Ltd, The Andersons Inc., The Mosaic Company and Yara International ASA (sorted alphabetically).
Additional Benefits:
- The market estimate (ME) sheet in Excel format
- 3 months of analyst support
TABLE OF CONTENTS
1 EXECUTIVE SUMMARY & KEY FINDINGS
2 REPORT OFFERS
3 INTRODUCTION
- 3.1 Study Assumptions & Market Definition
- 3.2 Scope of the Study
- 3.3 Research Methodology
4 KEY INDUSTRY TRENDS
- 4.1 Acreage Of Major Crop Types
- 4.1.1 Field Crops
- 4.1.2 Horticultural Crops
- 4.2 Average Nutrient Application Rates
- 4.2.1 Micronutrients
- 4.2.1.1 Field Crops
- 4.2.1.2 Horticultural Crops
- 4.2.2 Primary Nutrients
- 4.2.2.1 Field Crops
- 4.2.2.2 Horticultural Crops
- 4.2.3 Secondary Macronutrients
- 4.2.3.1 Field Crops
- 4.2.3.2 Horticultural Crops
- 4.2.1 Micronutrients
- 4.3 Agricultural Land Equipped For Irrigation
- 4.4 Regulatory Framework
- 4.5 Value Chain & Distribution Channel Analysis
5 MARKET SEGMENTATION (includes market size in Value in USD and Volume, Forecasts up to 2030 and analysis of growth prospects)
- 5.1 Speciality Type
- 5.1.1 CRF
- 5.1.1.1 Polymer Coated
- 5.1.1.2 Polymer-Sulfur Coated
- 5.1.1.3 Others
- 5.1.2 Liquid Fertilizer
- 5.1.3 SRF
- 5.1.4 Water Soluble
- 5.1.1 CRF
- 5.2 Application Mode
- 5.2.1 Fertigation
- 5.2.2 Foliar
- 5.2.3 Soil
- 5.3 Crop Type
- 5.3.1 Field Crops
- 5.3.2 Horticultural Crops
- 5.3.3 Turf & Ornamental
- 5.4 Country
- 5.4.1 Canada
- 5.4.2 Mexico
- 5.4.3 United States
- 5.4.4 Rest of North America
6 COMPETITIVE LANDSCAPE
- 6.1 Key Strategic Moves
- 6.2 Market Share Analysis
- 6.3 Company Landscape
- 6.4 Company Profiles
- 6.4.1 CF Industries Holdings, Inc.
- 6.4.2 Haifa Group
- 6.4.3 ICL Group Ltd
- 6.4.4 Koch Industries Inc.
- 6.4.5 Nutrien Ltd.
- 6.4.6 Sociedad Quimica y Minera de Chile SA
- 6.4.7 The Andersons Inc.
- 6.4.8 The Mosaic Company
- 6.4.9 Wilbur-Ellis Company LLC
- 6.4.10 Yara International ASA
7 KEY STRATEGIC QUESTIONS FOR FERTILIZER CEOS
8 APPENDIX
- 8.1 Global Overview
- 8.1.1 Overview
- 8.1.2 Porter's Five Forces Framework
- 8.1.3 Global Value Chain Analysis
- 8.1.4 Market Dynamics (DROs)
- 8.2 Sources & References
- 8.3 List of Tables & Figures
- 8.4 Primary Insights
- 8.5 Data Pack
- 8.6 Glossary of Terms
