
|
市場調査レポート
商品コード
1693537
南米の特殊肥料:市場シェア分析、産業動向・統計、成長予測(2025年~2030年)South America Specialty Fertilizer - Market Share Analysis, Industry Trends & Statistics, Growth Forecasts (2025 - 2030) |
||||||
カスタマイズ可能
適宜更新あり
|
|||||||
| 南米の特殊肥料:市場シェア分析、産業動向・統計、成長予測(2025年~2030年) |
|
出版日: 2025年03月18日
発行: Mordor Intelligence
ページ情報: 英文 204 Pages
納期: 2~3営業日
|

全表示
- 概要
- 目次
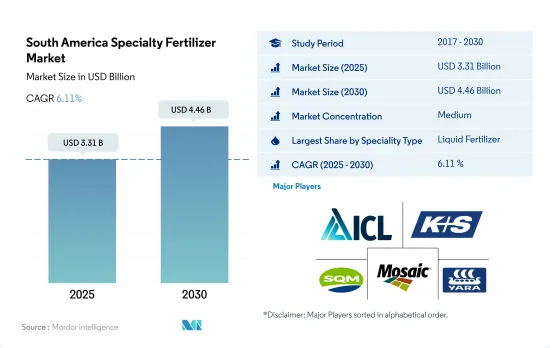
南米の特殊肥料市場規模は2025年に33億1,000万米ドルと推定・予測され、2030年には44億6,000万米ドルに達し、予測期間(2025-2030年)のCAGRは6.11%で成長すると予測されます。
水溶性肥料は様々な農業システムに適しているため市場を独占
- 2022年、南米の特殊肥料市場では水溶性肥料が42.3%の圧倒的シェアを占めました。水溶性肥料(WSF)は、養分レベルが溶出や浸食の影響を受けないため、栄養管理が簡素化されます。水耕栽培や点滴灌漑のような近代的農業システムの重要な要素である施肥は、水溶性肥料によって使いやすくなります。
- 2022年の南米の特殊肥料市場では、液体肥料が51.6%のシェアを占めました。この地域の生産者は液体肥料の利点をますます認識するようになっています。これらの肥料は土壌に浸透しやすく、植物による養分の吸収が早いだけでなく、無駄を最小限に抑えることができます。地上部にも葉面にも施用できるため、南米に大きな成長機会をもたらしています。
- 2022年の南米における放出制御型肥料市場のシェアは2.8%と小幅です。放出制御型肥料の中では、ポリマー被覆肥料が76.3%のシェアを占めています。この市場は、革新的で環境に優しい放出制御型肥料の開発に対する関心の高まりに後押しされています。今後数年間の放出制御肥料市場のCAGRは6.7%と予測されています。
- 時間をかけて徐々に栄養素を放出する緩効性肥料は、南米の特殊肥料市場の2.4%を占めるに過ぎないです。これらの肥料は、水、熱、日光、土壌微生物の影響を受けて徐々に分解され、土壌を豊かにします。特殊肥料の市場ポテンシャルが拡大していることから、緩効性セグメントは2023年から2030年にかけて大きく成長する見込みです。
ブラジルは、面積が広く農業の潜在力が大きいため、市場を独占しています。
- 2022年には、世界の農業セクターの重要なプレーヤーであるブラジルは、米、トウモロコシ、大豆、コーヒーなどの商品の主要輸出国として立っていました。ブラジルの特殊肥料市場は18億米ドルと評価され、同年の消費量は200万トンでした。
- アルゼンチンは農業部門に大きく依存しており、小麦、トウモロコシ、大豆が主要作物です。同国の肥料消費量は特筆すべきもので、平均施用量は259.4kg/haです。2022年、アルゼンチンの特殊肥料消費量は同地域の14.1%を占めました。
- 同地域の特殊肥料消費量は2017年以降増加傾向にあり、28万9,600トンから2022年には43万200トンに急増しました。市場価値は、COVID-19パンデミックによって貿易とサプライチェーンが混乱した2019年まで一貫した成長を示しました。この地域が肥料の輸入に依存していることを考えると、価格はこの期間に上昇傾向を示しました。
- チリ、コロンビア、ペルー、ボリビア、パラグアイを含む残りの南米諸国は、2022年には合計で同地域の特殊肥料消費量の25.9%を占める。これらの国々は、穀物から果物や野菜に至るまで多様な農業を誇り、農業は国民の主要な収入源となっています。
- 耕作面積が拡大し、干ばつや熱波のような気候リスクが高まっているため、南米の特殊肥料市場は成長の態勢を整えています。こうした課題が、より効率的な肥料の採用を後押ししています。
南米の特殊肥料市場の動向
作物生産の自給自足を目指すブラジル政府の取り組み
- 南米における畑作物の栽培面積は12.8%増加し、2017年の1億1,160万haから2022年には1億2,610万haに増加しました。この栽培面積の急増は、同地域の肥料需要を押し上げると予測されます。畑作物が96.8%という大きなシェアを占めています。2022年には、ブラジルが56.9%で市場の大半を占め、アルゼンチンが29.3%でこれに続きます。大豆生産と輸出の世界的リーダーとして知られるブラジルの大豆生産量は、2021年にはほぼ1億3,500万トンに達しました。そのうち1億550万トンの大豆製品が輸出され、その82%は生大豆、16%は大豆ケーキ、2%は大豆油です。
- 南米では、ブラジルとアルゼンチンが栽培面積の64.4%、26.1%を占め、大豆栽培のトップに君臨しています。しかし、この地域は長期の干ばつに悩まされており、その結果、主要河川の水位が驚くほど低下しています。これは深刻な影響を及ぼしており、収穫と重要な夏作物、特に大豆の輸送の両方に支障をきたしています。その結果、このような状況が南米における肥料の需要増に拍車をかけています。
- メルコスール地域では近年、旺盛な世界需要と魅力的な収益性を背景に、大豆栽培が急増しています。大豆を含む一次産品価格の高騰は、生産者の事業拡大を促し、新しい土地や設備に投資して規模と効率を向上させました。その結果、当地域の畑作物栽培面積は、国内外の市場の成長とともに拡大する態勢を整えています。
南米地域における畑作物の一次養分施用量の平均は、約172.73kg/ヘクタールです。
- 南米は大豆、トウモロコシ、小麦、メイズなどの畑作物の主要生産国です。過去20年間、耕作地の増加と高収量を達成するための努力により、これらの作物の生産量は大幅に増加しました。ブラジルのような国々の生産者が耕作地を拡大し続けているため、作物生産はさらに増加すると予想され、ひいては肥料消費量の増加につながる可能性があります。
- 栄養素は、植物の健康、成長、農作物の生産量に重要な役割を果たします。特に一次栄養素は、植物開発の基本構成要素となるため、畑作物にとって不可欠です。これらの栄養素には窒素、リン、カリウムが含まれ、どれかが欠乏すると作物の収量や品質に大きな影響を与えます。南米における畑作物の一次養分の平均施用量は、2022年には約172.7kg/ヘクタールでした。すべての一次養分の中で窒素の施用率が最も高く193.8kg/ヘクタール、次いでカリウムの181.9kg/ヘクタール、リンの施用率は142.4kg/ヘクタールでした。
- すべての畑作物の中で、小麦、米、トウモロコシ/メイズの平均養分施用率が最も高くなると予測されています。具体的には、小麦の平均養分施用量は231 kg/ha、米とトウモロコシ/メイズの平均施用量はそれぞれ156 kg/haと149 kg/haと予測されます。南米では、人口の増加により畑作物の需要が増加しており、主要な食用作物の収穫面積が増加しています。その結果、畑作物における一次栄養素の使用量は今後数年間で大幅に増加すると予想されます。
南米の特殊肥料産業の概観
南米の特殊肥料市場は適度に統合されており、上位5社で58.59%を占めています。この市場の主要企業は以下の通りです。 ICL Group Ltd, K+S Aktiengesellschaft, Sociedad Quimica y Minera de Chile SA, The Mosaic Company and Yara International ASA(アルファベット順)
その他の特典
- エクセル形式の市場予測(ME)シート
- 3ヶ月のアナリストサポート
目次
第1章 エグゼクティブサマリーと主な調査結果
第2章 レポートのオファー
第3章 イントロダクション
- 調査の前提条件と市場定義
- 調査範囲
- 調査手法
第4章 主要産業動向
- 主要作物の作付面積
- 畑作物
- 園芸作物
- 平均養分施用率
- 微量栄養素
- 畑作物
- 園芸作物
- 一次栄養素
- 畑作物
- 園芸作物
- 二次多量栄養素
- 畑作物
- 園芸作物
- 微量栄養素
- 灌漑農地
- 規制の枠組み
- バリューチェーンと流通チャネル分析
第5章 市場セグメンテーション
- スペシャリティタイプ
- CRF
- ポリマーコート
- ポリマー硫黄コーティング
- その他
- 液体肥料
- SRF
- 水溶性
- CRF
- 施肥モード
- 施肥
- 葉面散布
- 土壌
- 作物タイプ
- 畑作物
- 園芸作物
- 芝・観賞用
- 生産国
- アルゼンチン
- ブラジル
- その他南米
第6章 競合情勢
- 主要な戦略動向
- 市場シェア分析
- 企業情勢
- 企業プロファイル
- EuroChem Group
- Grupa Azoty S.A.(Compo Expert)
- Haifa Group
- ICL Group Ltd
- K+S Aktiengesellschaft
- Sociedad Quimica y Minera de Chile SA
- The Mosaic Company
- TIMAC Agro
- Yara International ASA
第7章 CEOへの主な戦略的質問
第8章 付録
- 世界概要
- 概要
- ファイブフォース分析フレームワーク
- 世界のバリューチェーン分析
- 市場力学(DROs)
- 情報源と参考文献
- 図表一覧
- 主要洞察
- データパック
- 用語集
The South America Specialty Fertilizer Market size is estimated at 3.31 billion USD in 2025, and is expected to reach 4.46 billion USD by 2030, growing at a CAGR of 6.11% during the forecast period (2025-2030).
Water soluble fertilizers dominated the market due to their suitability for various agricultural systems
- In 2022, water-soluble fertilizers held a dominant share of 42.3% in South America's specialty fertilizer market. Water soluble fertilizers (WSF) simplify nutrition management because nutrient levels are not affected by leaching or erosion. Fertigation, a key component of modern agricultural systems like hydroponics and drip irrigation, is made user-friendly with water-soluble fertilizers.
- Liquid fertilizers took the lion's share of 51.6% in South America's specialty fertilizer market in 2022. Growers in the region are increasingly recognizing the benefits of liquid fertilizers. These fertilizers not only penetrate the soil easily, enabling faster nutrient absorption by plants, but also minimize waste. They can be applied to both the ground and foliage, presenting a significant growth opportunity in South America.
- The controlled-release fertilizer market in South America held a modest share of 2.8% in 2022. Among controlled-release fertilizers, polymer-coated variants dominated, commanding a 76.3% share. This market is being propelled by a rising interest in developing innovative and environmentally friendly controlled-release fertilizers. Projections indicate a 6.7% CAGR for the controlled-release fertilizer market in the coming years.
- Slow-release fertilizers, which gradually release nutrients over time, accounted for a modest 2.4% of South America's specialty fertilizer market. These fertilizers, influenced by water, heat, sunlight, and soil microbes, gradually break down and decompose, enriching the soil. Given the expanding market potential for specialty fertilizers, the slow-release segment is poised for significant growth from 2023 to 2030.
Brazil dominated the market owing to the larger area and greater agricultural potential.
- In 2022, Brazil, a significant player in the global agricultural sector, stood as a key exporter of commodities such as rice, maize, soybean, and coffee. The specialty fertilizer market in Brazil was valued at USD 1.8 billion, and it witnessed a consumption of 2.0 million metric ton in the same year.
- Argentina heavily relies on its agricultural sector, with wheat, corn, and soybean being prominent crops. The country's fertilizer consumption is notable, with an average application rate of 259.4 kg/ha. In 2022, Argentina accounted for 14.1% of the region's specialty fertilizer consumption.
- Specialty fertilizer consumption in the region has been on the rise since 2017, surging from 289.6 thousand metric ton to 430.2 thousand metric ton in 2022. The market value showed consistent growth until 2019 when the COVID-19 pandemic disrupted trade and supply chains. Given the region's reliance on fertilizer imports, prices saw an upward trend during the period.
- The remaining South American countries, including Chile, Colombia, Peru, Bolivia, and Paraguay, collectively represented 25.9% of the region's specialty fertilizer consumption in 2022. These countries boast a diverse agricultural landscape, spanning from cereals to fruits and vegetables, with agriculture serving as a primary income source for their populations.
- With an expanding cultivation area and escalating climate risks like droughts and heatwaves, the South American specialty fertilizer market is poised for growth. These challenges are driving the adoption of more efficient fertilizers.
South America Specialty Fertilizer Market Trends
The Brazilian government's initiatives to achieve self-sufficiency in crop production
- The cultivation area for field crops in South America witnessed a 12.8% increase, rising from 111.6 million ha in 2017 to 126.1 million ha in 2022. This surge in cultivation area is projected to drive up the demand for fertilizers in the region. Field crops dominated the landscape, occupying a significant 96.8% share. In 2022, Brazil held the lion's share of the market at 56.9%, with Argentina trailing at 29.3%. Brazil, renowned as the global leader in soy production and exports, saw its soy output reach nearly 135 million tonnes in 2021. Out of this, a substantial 105.5 million tonnes of soy products were exported, with 82% in raw soybean form, 16% as soybean cake, and 2% as soybean oil.
- Soybean cultivation reigns supreme in South America, with Brazil and Argentina leading the pack, accounting for 64.4% and 26.1% of the cultivated area, respectively. However, the region is grappling with an extended drought, resulting in alarmingly low water levels in major rivers. This has severe repercussions, hampering both harvests and the transportation of crucial summer crops, especially soybeans. Consequently, the prevailing conditions are amplifying the demand for increased fertilizer application in South America.
- The Mercosur region has witnessed a surge in soybean cultivation, driven by robust global demand and the crop's attractive profitability in recent years. The surge in commodity prices, including soy, has incentivized producers to expand their operations, investing in new lands and equipment to enhance scale and efficiency. As a result, the field crop cultivation area in the region is poised to expand in tandem with the growing domestic and international markets.
The average rate of primary nutrient application for field crops in the South American region is about 172.73 kg/hectare
- South America is a major producer of field crops such as soybeans, corn, wheat, and maize. Over the last two decades, the production of these crops has experienced a significant rise due to an increase in cultivated land and efforts to achieve higher yields. As growers in countries like Brazil continue to expand their cultivated areas, it is expected that crop production will further increase, which, in turn, may lead to a rise in fertilizer consumption.
- Nutrients play a crucial role in plant health, growth, and crop production output. Primary nutrients, in particular, are essential for field crops as they provide the basic building blocks for plant development. These nutrients include nitrogen, phosphorus, and potassium, and a deficiency in any of them can have a significant impact on crop yield and quality. The average rate of primary nutrient application for field crops in South America was about 172.7 kg/hectare in 2022. Among all the primary nutrients, nitrogen had the highest application rate of 193.8 kg/hectare, followed by potassium with 181.9 kg/hectare, while phosphorous had an application rate of 142.4 kg/hectare.
- Among all the field crops, wheat, rice, and corn/maize are predicted to have the highest average nutrient application rate. Specifically, wheat is projected to have an average nutrient application rate of 231 kg/ha, while rice and corn/maize are estimated to have average rates of 156 kg/ha and 149 kg/ha, respectively. In South America, the demand for field crops has been on the rise due to the growing population, leading to an increase in the area harvested under major food crops. As a result, the use of primary nutrients in field crops is expected to increase significantly in the coming years.
South America Specialty Fertilizer Industry Overview
The South America Specialty Fertilizer Market is moderately consolidated, with the top five companies occupying 58.59%. The major players in this market are ICL Group Ltd, K+S Aktiengesellschaft, Sociedad Quimica y Minera de Chile SA, The Mosaic Company and Yara International ASA (sorted alphabetically).
Additional Benefits:
- The market estimate (ME) sheet in Excel format
- 3 months of analyst support
TABLE OF CONTENTS
1 EXECUTIVE SUMMARY & KEY FINDINGS
2 REPORT OFFERS
3 INTRODUCTION
- 3.1 Study Assumptions & Market Definition
- 3.2 Scope of the Study
- 3.3 Research Methodology
4 KEY INDUSTRY TRENDS
- 4.1 Acreage Of Major Crop Types
- 4.1.1 Field Crops
- 4.1.2 Horticultural Crops
- 4.2 Average Nutrient Application Rates
- 4.2.1 Micronutrients
- 4.2.1.1 Field Crops
- 4.2.1.2 Horticultural Crops
- 4.2.2 Primary Nutrients
- 4.2.2.1 Field Crops
- 4.2.2.2 Horticultural Crops
- 4.2.3 Secondary Macronutrients
- 4.2.3.1 Field Crops
- 4.2.3.2 Horticultural Crops
- 4.2.1 Micronutrients
- 4.3 Agricultural Land Equipped For Irrigation
- 4.4 Regulatory Framework
- 4.5 Value Chain & Distribution Channel Analysis
5 MARKET SEGMENTATION (includes market size in Value in USD and Volume, Forecasts up to 2030 and analysis of growth prospects)
- 5.1 Speciality Type
- 5.1.1 CRF
- 5.1.1.1 Polymer Coated
- 5.1.1.2 Polymer-Sulfur Coated
- 5.1.1.3 Others
- 5.1.2 Liquid Fertilizer
- 5.1.3 SRF
- 5.1.4 Water Soluble
- 5.1.1 CRF
- 5.2 Application Mode
- 5.2.1 Fertigation
- 5.2.2 Foliar
- 5.2.3 Soil
- 5.3 Crop Type
- 5.3.1 Field Crops
- 5.3.2 Horticultural Crops
- 5.3.3 Turf & Ornamental
- 5.4 Country
- 5.4.1 Argentina
- 5.4.2 Brazil
- 5.4.3 Rest of South America
6 COMPETITIVE LANDSCAPE
- 6.1 Key Strategic Moves
- 6.2 Market Share Analysis
- 6.3 Company Landscape
- 6.4 Company Profiles
- 6.4.1 EuroChem Group
- 6.4.2 Grupa Azoty S.A. (Compo Expert)
- 6.4.3 Haifa Group
- 6.4.4 ICL Group Ltd
- 6.4.5 K+S Aktiengesellschaft
- 6.4.6 Sociedad Quimica y Minera de Chile SA
- 6.4.7 The Mosaic Company
- 6.4.8 TIMAC Agro
- 6.4.9 Yara International ASA
7 KEY STRATEGIC QUESTIONS FOR FERTILIZER CEOS
8 APPENDIX
- 8.1 Global Overview
- 8.1.1 Overview
- 8.1.2 Porter's Five Forces Framework
- 8.1.3 Global Value Chain Analysis
- 8.1.4 Market Dynamics (DROs)
- 8.2 Sources & References
- 8.3 List of Tables & Figures
- 8.4 Primary Insights
- 8.5 Data Pack
- 8.6 Glossary of Terms
