
|
市場調査レポート
商品コード
1940836
特殊肥料:市場シェア分析、業界動向と統計、成長予測(2026年~2031年)Specialty Fertilizer - Market Share Analysis, Industry Trends & Statistics, Growth Forecasts (2026 - 2031) |
||||||
カスタマイズ可能
適宜更新あり
|
|||||||
| 特殊肥料:市場シェア分析、業界動向と統計、成長予測(2026年~2031年) |
|
出版日: 2026年02月09日
発行: Mordor Intelligence
ページ情報: 英文 351 Pages
納期: 2~3営業日
|

概要
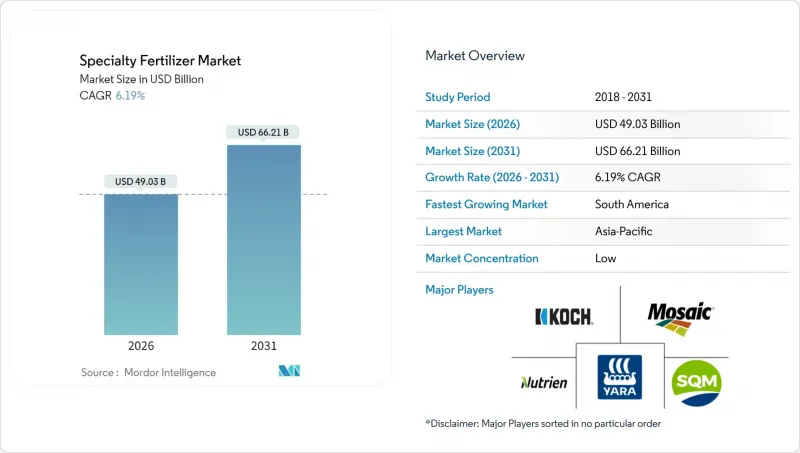
特殊肥料市場は2025年に461億7,000万米ドルと評価され、2026年の490億3,000万米ドルから2031年までに662億1,000万米ドルに達すると予測されています。
予測期間(2026-2031年)におけるCAGRは6.19%と見込まれます。
精密農業ツールの導入が市場成長を牽引しており、これは効率性向上型配合への急速な移行と、栄養管理を環境指標と結びつける政策支援によって推進されています。液体製品が主流を占める理由は、完全な溶解性が施肥灌漑のニーズに合致するためであり、一方、徐放性コーティング技術の進歩により、養分供給が作物の需要と同期し続けています。デジタル農業プラットフォームは、栄養素利用効率の向上、規制順守の促進、カーボンクレジットの収益化を可能にするリアルタイムの圃場データを提供します。保護栽培の拡大、点滴灌漑の普及率向上、窒素利用効率向上のためのインセンティブ提供は、作物カテゴリー全体での需要の回復力を高めます。競争の激しさは、分析、ハードウェア、カスタマイズされた栄養素ソリューションを組み合わせた統合サービスモデルに依存しており、これにより特殊肥料市場における農場の収益性が向上します。
世界の特殊肥料市場の動向と洞察
精密農業の導入
衛星画像、土壌センサー、GPS誘導散布機により、養分投入の精度が向上しています。2024年には、トウモロコシおよび大豆生産者の大多数が可変率施肥を採用し、2023年と比較して、全面散布の減少に伴い、1エーカー当たりの特殊肥料使用量が増加しました。作物の生育段階に合わせたオンデマンド混合投入を可能にするリアルタイム窒素クレジットにより、損失削減と収量向上が図られています。機器メーカーは現在、栄養素供給業者と共同でマルチビン施肥機を設計しており、農家はダウンタイムなしで配合を変更できます。支援的な保全プログラムがハードウェア費用の一部をカバーするため、精密農業対応の高効率製品の普及が加速しています。
水不足と灌漑効率
点滴灌漑と施肥灌漑の組み合わせは、氾濫式灌漑システムと比較して水使用量を削減します。これは、農業が占める淡水資源の割合が縮小する中で極めて重要な利点です。2024年には点滴灌漑ラインの設置面積が世界的に拡大し、このネットワークを通じた特殊肥料の使用量は従来の畑作方法の2倍に達しました。イスラエルとヨルダンでは、10ヘクタールを超える新規農場に対して加圧式灌漑を義務付けており、完全水溶性栄養素ブレンドの需要が固定化されています。オンラインpH・導電率プローブには、目詰まりしない低塩分指数製品が求められます。水使用目標と連動した補助金制度は肥料灌漑を促進し、特殊肥料市場の成長を支えています。
原材料・エネルギー価格の変動
2024年は地政学的緊張により天然ガス、カリ、リン鉱石の価格が変動し、生産者の利益率が圧迫されました。CRFコストの最大25%を占めるポリマーコーティングは原油価格に連動するため、原油高は即座に製品価格上昇につながります。ロシア・ベラルーシからのカリ供給障害によりスポットコストが一時50%上昇し、代替調達が進みました。特殊添加剤における単一供給業者への依存はリスクを増幅させ、為替変動は輸入依存型メーカーにとってさらなる不確実性を加えます。調達サイクルが短いためヘッジの余地が少なく、価格安定は困難な状況です。
セグメント分析
2025年における特殊肥料市場シェアの53.38%を液体肥料が占めました。この地位は、肥料灌漑(フィゲレーション)との比類なき適合性と均一な栄養素分布に支えられています。迅速な溶解性と混合の容易さは、精密な均質性を要求する可変施肥装置に適しています。アジア太平洋地域および南米における大規模灌漑農地の採用が消費量を高水準に維持する一方、屋内農業では塩類蓄積リスクの低さが評価されています。また、バルク輸送や農場内混合を可能とする流通インフラの拡充も、このセグメントの成長に寄与しています。
制御放出型製品の特殊肥料市場規模は、特殊肥料タイプの中で最も速い7.81%のCAGRで拡大すると予測されています。コーティング技術の進歩により、作物の吸収に合わせて予測可能な栄養素放出曲線が実現され、これにより流出が抑制され、労働要件が削減されます。硫黄不足地域ではポリマー硫黄系製品が普及し、生分解性フィルムは迫り来るマイクロプラスチック規制への対応に貢献します。精密農業ツールは付加価値を高め、1回の施肥で複数の生育段階に対応できるため、投資収益率の向上に寄与します。
特殊肥料市場は、特殊タイプ別(CRF、液体肥料、SRF、水溶性)、施用方法別(施肥灌漑、葉面散布、土壌施用)、作物タイプ別(畑作作物、園芸作物、芝生・観賞植物)、地域別(アジア太平洋、欧州、中東・アフリカ、北米、南米)に分類されます。市場予測は、金額(米ドル)および数量(メトリックトン)で提供されます。
地域別分析
2025年時点でアジア太平洋地域は世界収益の65.20%を占めており、中国の土壌検査補助金やインドの小規模農家向け特殊栄養素奨励策がこれを支えています。日本と韓国における集約的な土地利用はヘクタール当たりの支出をさらに促進し、オーストラリアの干ばつ管理規則は液体混合肥料を用いた施肥灌漑システムの利用を促進しています。東南アジアのパーム油・米生産者は持続可能性認証への適合のため高効率資材を採用しており、これが追加的な数量増加をもたらしています。
南米は2031年までCAGR8.55%で最も急速に成長する地域です。ブラジルでは養分効率を高める精密農業技術への投資が始まっており、大規模農場では土壌健康を守るためCRF(制御放出肥料)の使用を不耕起栽培と連動させています。アルゼンチンも同様の軌道をたどり、環境監視の強化の中で輸出競争力を維持するため、大豆やトウモロコシ向けに制御放出ソリューションを活用しています。
南米の特殊肥料市場は、大規模農業経営と近代的農業手法の普及拡大が特徴です。ブラジルとアルゼンチンが中心となるこの地域は、広大な農地と多様な作物ポートフォリオを背景に、大きな市場潜在力を示しています。ブラジルは、その膨大な農業経営規模と農業技術革新への強い注力により、地域最大の市場として台頭しています。アルゼンチンは、精密農業技術の普及拡大と輸出志向型農業への注力により、最も急速に成長している市場として位置づけられます。同地域の市場は、持続可能な農業手法への意識の高まりと農業技術への投資増加が特徴となっています。
その他の特典:
- エクセル形式の市場予測(ME)シート
- アナリストによる3ヶ月間のサポート
よくあるご質問
目次
第1章 イントロダクション
- 調査の前提条件と市場の定義
- 調査範囲
- 調査手法
第2章 レポート提供
第3章 エグゼクティブサマリーおよび主要な調査結果
第4章 主要産業動向
- 主要作物類の作付面積
- 畑作作物
- 園芸作物
- 平均施肥量
- 微量栄養素
- 畑作作物
- 園芸作物
- 主要栄養素
- 畑作作物
- 園芸作物
- 二次的必須栄養素
- 畑作作物
- 園芸作物
- 微量栄養素
- 灌漑設備を備えた農地
- 規制の枠組み
- バリューチェーン及び流通チャネル分析
- 市場促進要因
- 精密農業の導入
- 水不足と灌漑効率
- 温室および垂直農法の拡大
- NUE投入物に対するカーボンクレジットのインセンティブ
- CRISPR技術を活用した栄養豊富な作物
- デジタルトレーサビリティによるプレミアム
- 市場抑制要因
- 原材料およびエネルギー価格の変動性
- 肥料灌漑設備の高額な設備投資費用
- マイクロプラスチックコーティング禁止の動向
- 炭素会計におけるデータ標準のギャップ
第5章 市場規模と成長予測(数量と金額)
- 専門分野タイプ
- 肥効調節型肥料(CRF)
- ポリマーコーティング
- ポリマー・硫黄コーティング
- その他
- 液体肥料
- 緩効性肥料(SRF)
- 水溶性
- 肥効調節型肥料(CRF)
- 施用モード
- 肥料灌漑
- 葉面散布
- 土壌
- 作物タイプ
- 畑作作物
- 園芸作物
- 芝生および観賞用植物
- 地域
- アジア太平洋地域
- オーストラリア
- バングラデシュ
- 中国
- インド
- インドネシア
- 日本
- パキスタン
- フィリピン
- タイ
- ベトナム
- その他アジア太平洋地域
- 欧州
- フランス
- ドイツ
- イタリア
- オランダ
- ロシア
- スペイン
- ウクライナ
- 英国
- その他欧州地域
- 中東・アフリカ
- ナイジェリア
- サウジアラビア
- 南アフリカ
- トルコ
- その他中東・アフリカ地域
- 北米
- カナダ
- メキシコ
- 米国
- その他北米地域
- 南米
- アルゼンチン
- ブラジル
- その他南米
- アジア太平洋地域
第6章 競合情勢
- 主要な戦略的動きs
- 市場シェア分析
- 企業概要
- 企業プロファイル
- Coromandel International Limited
- EuroChem Group AG
- COMPO EXPERT GmbH
- Haifa Group
- Kingenta Ecological Engineering Group Co., Ltd.
- Koch Fertilizer LLC
- Nutrien Ltd.
- Sociedad Quimica y Minera de Chile S.A.
- The Mosaic Company
- Yara International ASA
- ICL Group Ltd.
- K+S Aktiengesellschaft
- Indian Farmers Fertiliser Cooperative Ltd.
- Omex Agriculture Ltd.
- Agro-Culture Liquid Fertilizers LLC
