
米国の小麦プロテイン- 市場シェア分析、産業動向、統計、成長予測(2025年~2030年)
United States Wheat Protein - Market Share Analysis, Industry Trends & Statistics, Growth Forecasts (2025 - 2030)- 発行日
- ページ情報
- 英文 166 Pages
- 納期
- 2~3営業日
- 商品コード
- 1690970
- カスタマイズ可能 お客様のご希望に応じて、既存データの加工や未掲載情報(例:国別セグメント)の追加などの対応が可能です。詳細はお問い合わせください。
- 適宜更新あり 本レポートは最新情報反映のため適宜更新し、内容構成変更を行う場合があります。ご検討の際はお問い合わせください。
- 翻訳ツール提供対象 PDF対応AI翻訳ツールの無料貸し出しサービスのご利用が可能です
概要
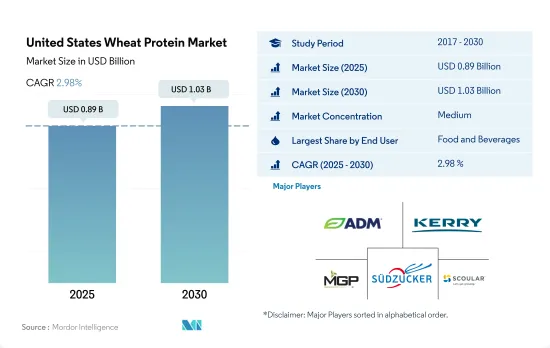
米国の小麦プロテイン市場規模は2025年に8億9,000万米ドルと推定・予測され、2030年には10億3,000万米ドルに達し、予測期間中(2025~2030年)にCAGR 2.98%で成長すると予測されます。
パーソナルケアと化粧品セグメントは、スキンケア製品に関連する有益な特性のため、予測期間中に人気が高まると予想されます。
- 2022年には、F&Bセクタの需要が最も高く、次いで動物飼料セクタが続きます。ベーカリー、朝食用シリアル、肉代替製品における小麦タンパク質の需要の増加が市場成長を牽引しています。したがって、市場のF& Bセグメントは2023~2029年にかけてCAGR 1.99%を記録すると予測されます。小麦タンパク質は、ベジタリアンやヴィーガンのコミュニティから、より好ましい植物性タンパク質源とみなされています。植物ベースの動向の一環として、様々な伝統的肉ベースのアイテムが、小麦タンパク質で作られた代替品に置き換わりつつあります。
- 動物飼料セクタは、予測期間中に3.61%のCAGRで推移すると予測されます。バイタル小麦グルテンの能力は、魚や動物ベースの飼料の適切かつ高機能な代替品として機能し、動物飼料産業の巨大な上昇に寄与しています。2021年、米国における硬質冬小麦の生産量が10%減少した結果、2021年末には価格が上昇し、成長率の妨げとなりました。
- パーソナルケアと化粧品セグメントは、予測期間中にCAGR 4.97%を記録し、最も急成長が見込まれています。現在、化粧品やスキンケアにおける小麦タンパク質の利用はごくわずかです。近年、加水分解物はスキンケアやヘアケア製品の天然成分としてこのセグメントに進出しています。加水分解小麦タンパク質は、肌のハリを増し、水分を保持する膜を形成して輝きを与えることが知られています。また、肌の乾燥を防ぎ、シワを目立たなくし、髪に栄養と補修を与えます。米国で使用されている加水分解物のうち、パーソナルケアセグメントに使用されているのはわずか0.01%であるが、これは今後数年で変化すると予想されます。
米国の小麦タンパク質市場動向
植物性タンパク質消費量の成長が原料市場の主要企業に機会を提供
- 米国では、投資と技術革新に支えられて、一人当たりの植物性タンパク質消費量がかなりの割合で増加しており、その結果、消費量は一日当たり40.28グラムに達しています。米国では、動物が虐待される工場畜産が常態化しているからです。多くのアメリカ人は肉や動物性食品の摂取量を減らしているが、完全に排除しているわけではないです。また、ヴィーガンやベジタリアンよりもフレキシタリアンである傾向が強いです。米国では12%近くの消費者が植物性の食事を好み、7%の消費者がフレキシタリアンです。米国ではあらゆる世代の消費者が植物ベースの食事に関心を持っているが、20代と30代が最も植物ベースの食事に熱心です。
- 肉、鶏肉、ベーカリー製品など、さまざまな食品に幅広く利用されているため、一人当たりのエンドウタンパク消費量は常に増加しています。約41%の消費者がエンドウタンパク由来の植物性食品に関心を持っています。エンドウ豆プロテインは主にスポーツ栄養や肉の代替食品に使用されています。エンドウ豆プロテイン粉末の典型的な1食分は30グラムで、25グラムのタンパク質が含まれています。アスリートは通常1日1食を使用するが、1日3食摂取することもあります。
- 大豆プロテインと乳清プロテインは、主に飲食品、サプリメント、スポーツ栄養産業で使用されています。2021年には、約36%の消費者が大豆タンパク質を知っており、摂取したことがあるのに対し、米国では31%の人がホエイプロテインを摂取していました。同様に、大豆ベースの飲食品消費量は2014~2019年にかけて12.9%増加し、予測期間中も一貫して増加し続ける可能性が高いです。
米国では冬小麦が小麦総生産量の70~80%を占める
- 小麦は米国の畑作物の中で、作付面積、生産量ともにトウモロコシ、大豆に次いで第3位の地位を占めています。2023/24年産では、米国農業従事者は3,730万エーカーの収穫面積から合計18億1,000万ブッシェルの冬小麦、春小麦、デュラム小麦を生産すると推定されます。米国は通常、世界の小麦の約6~7%しか生産していないが、主要な小麦輸出国です。ロシアと欧州連合が世界の小麦輸出国のトップであるのに対し、米国は常に世界の小麦輸出国の上位5に入っています。
- 小麦の3つの分類は大きく5つに分けられます:硬質赤色冬小麦、硬質赤色春小麦、軟質赤色冬小麦、白小麦、デュラム小麦です。硬質赤色春小麦(HRS)は小麦の主要分類のひとつで、生産量の20%を占めます。硬質赤色春小麦は高タンパク質で、特殊パンや低タンパク質小麦とのブレンドに適しています。小麦タンパク質市場の主要抑制要因は、グルテンフリー食品に対する消費者の関心の高まりと、低炭水化物ダイエットの復活推進であり、これが一人当たりの小麦消費量を押し下げる可能性があります。
- 小麦は米国で生産される主要な食用穀物です。国内で播種される主要3品種は、冬小麦、春小麦、デュラム小麦です。2023/2024年には、冬小麦の生産量は平均して米国全体の70%近くを占めます。春小麦は通常、米国小麦生産量の約25~30%、3億4,000万~6億ブッシェル以上を占めます。デュラム小麦は3大小麦の中で最も小さく、通常7,500万ブッシェル以下、米国小麦生産量の2~5%を占めます。
米国小麦プロテイン産業概要
米国小麦プロテイン市場は適度に統合されており、上位5社で53.67%を占めています。この市場の主要企業は、Archer Daniels Midland Company、Kerry Group PLC、MGP Ingredients Inc.、Sudzucker Group、The Scoular Companyなどです。
その他の特典
- エクセル形式の市場予測(ME)シート
- 3ヶ月のアナリストサポート
目次
第1章 エグゼクティブサマリーと主要調査結果
第2章 イントロダクション
- 調査の前提条件と市場定義
- 調査範囲
- 調査手法
第3章 主要産業動向
- エンドユーザー市場規模
- ベビーフードと乳児用調製粉乳
- ベーカリー
- 飲料
- 朝食用シリアル
- 調味料/ソース
- 菓子類
- 乳製品と乳製品代替製品
- 高齢者栄養・医療栄養
- 肉・鶏肉・魚介類と肉代替製品
- RTE/RTC食品
- スナック
- スポーツ/パフォーマンス栄養
- 動物飼料
- パーソナルケアと化粧品
- タンパク質消費動向
- 植物
- 生産動向
- 植物
- 規制の枠組み
- 米国
- バリューチェーンと流通チャネル分析
第4章 市場セグメンテーション
- 形態
- 濃縮物
- 単離液
- テクスチャー/加水分解
- エンドユーザー
- 飼料
- 飲食品
- サブエンドユーザー別
- ベーカリー
- 朝食用シリアル
- 調味料/ソース
- 肉・鶏肉・魚介類と代替肉製品
- RTE/RTC食品
- スナック
- サプリメント
- サブエンドユーザー別
第5章 競合情勢
- 主要な戦略動向
- 市場シェア分析
- 企業情勢
- 企業プロファイル
- A. Costantino & C. SpA
- AMCO Proteins
- Archer Daniels Midland Company
- Kerry Group PLC
- MGP Ingredients Inc.
- Roquette Freres
- Sudzucker Group
- The Scoular Company
第6章 CEOへの主要戦略的質問
第7章 付録
- 世界概要
- 概要
- ファイブフォース分析フレームワーク
- 世界のバリューチェーン分析
- 市場力学(DROs)
- 情報源と参考文献
- 図表一覧
- 主要な洞察
- データパック
- 用語集
目次
The United States Wheat Protein Market size is estimated at 0.89 billion USD in 2025, and is expected to reach 1.03 billion USD by 2030, growing at a CAGR of 2.98% during the forecast period (2025-2030).
Personal Care and cosmetics segment is expected to gain popularity in forecast period due to beneficial properties associated within skin care products
- The F&B sector witnessed the highest demand, followed by the animal feed sector in 2022. The growing demand for wheat protein in bakeries, breakfast cereals, and meat alternatives products is driving market growth. Thus, the F&B segment of the market is projected to register a CAGR of 1.99% from 2023-2029. Wheat protein is viewed as a more favorable source of plant-based protein by the vegetarian and vegan communities. A variety of traditional meat-based items are increasingly being replaced by substitutes made with wheat protein as part of the plant-based trend.
- The animal feed sector is projected to register the highest CAGR of 3.61% during the forecast period. The capabilities of vital wheat gluten, which works as an appropriate and highly functional alternative to fish- and animal-based feeds, have contributed to the enormous rise of the animal feed industry. In 2021, the 10% lower production of hard winter wheat in the US resulted in its higher price by the end of 2021, hindering its growth rate.
- The personal care and cosmetics segment is expected to grow the fastest, registering a CAGR of 4.97% during the forecast period. Currently, the utilization of wheat protein in cosmetics and skincare is very minimal. In recent years, hydrolysates have found their way into the sector as a natural ingredient in skincare and hair care products. Hydrolyzed wheat protein is known to increase the firmness of the skin and helps to form a film to retain moisture and provide luminosity. It also prevents the skin from drying out, diminishes the appearance of wrinkles, and nourishes and repairs hair. Only 0.01% of the hydrolysates used in the US go to the personal care sector, but this is anticipated to change in the coming years.
United States Wheat Protein Market Trends
Growth in plant protein consumption provides opportunities for key players in the ingredients market
- The per capita consumption rate of plant proteins is increasing at a considerable rate in the United States, supported by investments and innovations, resulting in a consumption rate of 40.28 grams per day, primarily due to a rising number of consumers turning vegan to promote animal welfare. This is because factory farming, where animals are maltreated, is a norm in the United States. Most Americans eat less meat and animal products, but they do not eliminate their consumption entirely. They also tend to be more flexitarian than vegan or vegetarian. Nearly 12% of consumers in the country prefer a plant-based diet, whereas 7% of consumers follow a flexitarian diet. Although consumers of all generations in the United States are interested in plant-based meals, individuals in their 20s and 30s are the keenest to adopt plant-based diets.
- There is a constant rise in the per capita consumption of pea protein due to its wide applications in different food products, like meat, poultry, and bakery products. Around 41% of consumers are interested in plant-based food derived from pea protein. Pea protein is mainly used in sports nutrition and meat alternatives. A typical serving of pea protein powder is 30 grams, with 25 grams of protein. Athletes usually use one serving per day but may take as many as three servings per day.
- Soy and whey proteins are used primarily in the food and beverage, supplement, and sports nutrition industries. In 2021, around 36% of consumers were familiar with soy protein and had consumed the same, whereas 31% of individuals consumed whey protein in the US. Similarly, the consumption of soy-based food and beverages favorably increased by 12.9% during 2014-2019, and it is likely to remain consistent throughout the forecast period.
Winter wheat accounts for 70-80% of total wheat production in the United States
- Wheat holds the third position among the US field crops in planted acreage and production, behind corn and soybeans. In the marketing year 2023/24, US farmers are estimated to have produced a total of 1.81 billion bushels of winter, spring, and durum wheat from a harvested area of 37.3 million acres. Although the United States typically produces only about 6-7% of the world's wheat, it is a major wheat exporter. While Russia and the European Union are the top world wheat exporters, the United States routinely ranks among the top five global wheat exporters.
- The three categories of wheat can be disaggregated into five major classes: Hard Red Winter, Hard Red Spring, Soft Red Winter, white, and durum. Hard red spring (HRS) wheat is one of the major classifications of wheat, accounting for 20% of the production. Hard Red Spring wheat is valued for its high protein levels, making it suitable for specialty bread and blending with lower-protein wheat. The major restraint for the wheat protein market is the rising consumer interest in gluten-free foods and the revived promotion of low carbohydrate diets, which may put downward pressure on per capita wheat consumption.
- Wheat is the principal food grain produced in the United States. The three primary varieties of the grain domestically sown are winter wheat, spring wheat, and durum wheat. In 2023/2024, winter wheat production represents nearly 70% of total US production, on average. Spring wheat typically constitutes about 25-30% of total US wheat production, or 340 million to more than 600 million bushels. Durum wheat is the smallest of the three major wheat categories and typically accounts for less than 75 million bushels or 2-5% of total US wheat production.
United States Wheat Protein Industry Overview
The United States Wheat Protein Market is moderately consolidated, with the top five companies occupying 53.67%. The major players in this market are Archer Daniels Midland Company, Kerry Group PLC, MGP Ingredients Inc., Sudzucker Group and The Scoular Company (sorted alphabetically).
Additional Benefits:
- The market estimate (ME) sheet in Excel format
- 3 months of analyst support
TABLE OF CONTENTS
1 EXECUTIVE SUMMARY & KEY FINDINGS
2 INTRODUCTION
- 2.1 Study Assumptions & Market Definition
- 2.2 Scope of the Study
- 2.3 Research Methodology
3 KEY INDUSTRY TRENDS
- 3.1 End User Market Volume
- 3.1.1 Baby Food and Infant Formula
- 3.1.2 Bakery
- 3.1.3 Beverages
- 3.1.4 Breakfast Cereals
- 3.1.5 Condiments/Sauces
- 3.1.6 Confectionery
- 3.1.7 Dairy and Dairy Alternative Products
- 3.1.8 Elderly Nutrition and Medical Nutrition
- 3.1.9 Meat/Poultry/Seafood and Meat Alternative Products
- 3.1.10 RTE/RTC Food Products
- 3.1.11 Snacks
- 3.1.12 Sport/Performance Nutrition
- 3.1.13 Animal Feed
- 3.1.14 Personal Care and Cosmetics
- 3.2 Protein Consumption Trends
- 3.2.1 Plant
- 3.3 Production Trends
- 3.3.1 Plant
- 3.4 Regulatory Framework
- 3.4.1 United States
- 3.5 Value Chain & Distribution Channel Analysis
4 MARKET SEGMENTATION (includes market size in Value in USD and Volume, Forecasts up to 2030 and analysis of growth prospects)
- 4.1 Form
- 4.1.1 Concentrates
- 4.1.2 Isolates
- 4.1.3 Textured/Hydrolyzed
- 4.2 End User
- 4.2.1 Animal Feed
- 4.2.2 Food and Beverages
- 4.2.2.1 By Sub End User
- 4.2.2.1.1 Bakery
- 4.2.2.1.2 Breakfast Cereals
- 4.2.2.1.3 Condiments/Sauces
- 4.2.2.1.4 Meat/Poultry/Seafood and Meat Alternative Products
- 4.2.2.1.5 RTE/RTC Food Products
- 4.2.2.1.6 Snacks
- 4.2.3 Supplements
- 4.2.3.1 By Sub End User
5 COMPETITIVE LANDSCAPE
- 5.1 Key Strategic Moves
- 5.2 Market Share Analysis
- 5.3 Company Landscape
- 5.4 Company Profiles (includes Global Level Overview, Market Level Overview, Core Business Segments, Financials, Headcount, Key Information, Market Rank, Market Share, Products and Services, and Analysis of Recent Developments).
- 5.4.1 A. Costantino & C. SpA
- 5.4.2 AMCO Proteins
- 5.4.3 Archer Daniels Midland Company
- 5.4.4 Kerry Group PLC
- 5.4.5 MGP Ingredients Inc.
- 5.4.6 Roquette Freres
- 5.4.7 Sudzucker Group
- 5.4.8 The Scoular Company
6 KEY STRATEGIC QUESTIONS FOR PROTEIN INGREDIENTS INDUSTRY CEOS
7 APPENDIX
- 7.1 Global Overview
- 7.1.1 Overview
- 7.1.2 Porter's Five Forces Framework
- 7.1.3 Global Value Chain Analysis
- 7.1.4 Market Dynamics (DROs)
- 7.2 Sources & References
- 7.3 List of Tables & Figures
- 7.4 Primary Insights
- 7.5 Data Pack
- 7.6 Glossary of Terms
- 発行日
- 発行
- Mordor Intelligence
- ページ情報
- 英文 166 Pages
- 納期
- 2~3営業日


