
|
市場調査レポート
商品コード
1907003
ペット用栄養補助食品:市場シェア分析、業界動向と統計、成長予測(2026年~2031年)Pet Nutraceuticals - Market Share Analysis, Industry Trends & Statistics, Growth Forecasts (2026 - 2031) |
||||||
カスタマイズ可能
適宜更新あり
|
|||||||
| ペット用栄養補助食品:市場シェア分析、業界動向と統計、成長予測(2026年~2031年) |
|
出版日: 2026年01月12日
発行: Mordor Intelligence
ページ情報: 英文 123 Pages
納期: 2~3営業日
|

概要
2026年のペット用栄養補助食品市場規模は62億6,000万米ドルと推定され、2025年の58億4,000万米ドルから成長を続けています。
2031年までの予測では88億4,000万米ドルに達し、2026年から2031年にかけてCAGR7.15%で拡大が見込まれます。
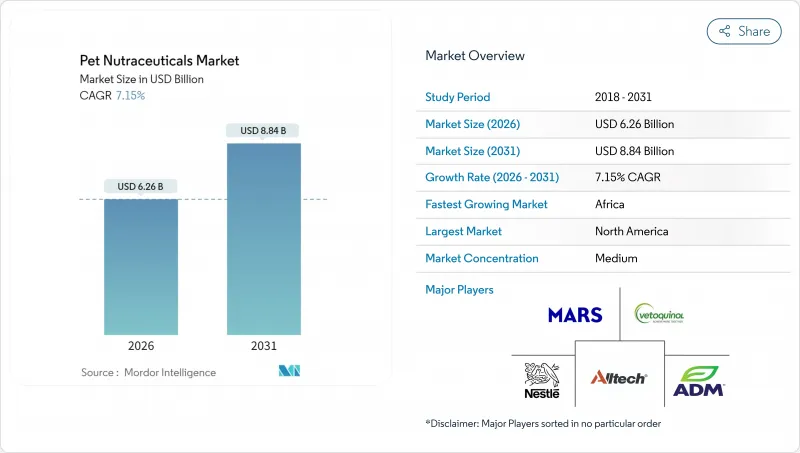
堅調な成長は、ペットの人間化が進んでいること、機能性成分に対する獣医師の支持が拡大していること、予防医療を必須の家計支出と捉える消費者の意識が高まっていることに起因しています。関節の可動性、体重管理、認知機能の健康、消化器のバランスをターゲットとしたプレミアム処方の需要が最も急激に増加しています。供給側の勢いは、特に藻類由来のオメガ3オイルなどの原料の革新と、投与コンプライアンスを向上させるデジタルサブスクリプションモデルに起因しています。競合は中程度で統合が進んでおり、既存のペットフード大手がウェルネス製品ラインを拡大する一方で、ニッチなサプリメント専門企業が迅速な製品開発サイクルを推進しています。
世界のペットニュートラシューティカルズ市場の動向と洞察
ペットの人間化が機能性栄養需要を牽引
ペットオーナーは人間の健康概念をペットに応用する傾向が強まり、ヒト向け機能性食品や栄養補助食品の動向を反映したニュートラシューティカルズへの需要を生み出しています。この行動変化は購買決定に顕著に表れており、2022年には米国消費者の41%がペット用サプリメントを購入しました。この人間化動向は基礎栄養を超え、関節可動性・認知機能・消化器健康など特定健康課題に対応するターゲット型ウェルネスソリューションへと拡大しています。予防医療として位置付けられることで、プレミアム製品は単なるおやつではなく価格感度が低下します。ペットを家族の一員として育ったミレニアル世代とZ世代が、可処分所得の増加とペット健康投資意欲の高まりと共にピーク飼育年齢期を迎えることで、この動向は加速しています。
ペットの肥満および慢性疾患の増加傾向
獣医学データによれば、伴侶動物における肥満関連疾患の有病率が増加しており、体重管理と代謝健康をサポートする栄養補助食品への臨床需要が高まっています。ペット肥満予防協会(APOP)の報告では、先進国市場の犬猫の50%以上が過体重または肥満状態にあり、2022年には健康的な代謝と関節機能をサポートするサプリメントの獣医推奨が促進されました。関節炎、糖尿病、消化器疾患などの慢性疾患は継続的な治療プロトコルを必要とし、栄養補助食品は医薬品による治療を補完します。この医療的必要性という位置付けにより、機能性サプリメントは任意のおやつとは差別化され、プレミアム価格設定とリピート購入パターンが可能となります。
地域ごとに分断された規制上の定義
ペット用栄養補助食品の分類に関する世界の統一基準の欠如は、コンプライアンス上の複雑さを生み、複数地域での製品展開を制約し、規制コストを増加させています。米国食品医薬品局(FDA)の最近のガイダンス文書はペットフードと医薬品の境界を明確化することを目的としていますが、機能性成分や健康強調表示の定義には依然として大きな隔たりが残されています。欧州食品安全機関(EFSA)は、ペットフード添加物とサプリメントについて異なる承認プロセスを維持しています。一方、アジア太平洋地域の各市場では、それぞれ独自の規制枠組みが存在し、個別の申請書類作成が求められます。この分断は、複数の規制当局への申請リソースを欠く中小企業に特に影響を与え、参入障壁となり、イノベーションを制限しています。
セグメント分析
2025年時点で、ビタミン・ミネラルはペット用ニュートラシューティカル市場において26.35%と最大のシェアを占めております。これは、確立された安全性プロファイルと、多様な健康用途における獣医療界での幅広い受容性を反映した結果です。このセグメントは、人間栄養学における数十年にわたる調査が伴侶動物への応用として容易に活用できる点で優位性を持ち、消費者の認知度と専門家による推奨の信頼性を高めています。このセグメントの主導的地位は、主にペットの成長・エネルギー生産・全体的な健康維持を支えるためのビタミン・ミネラルの特定の日次必要量によって支えられています。
また、ビタミン・ミネラル分野は2031年までCAGR7.90%と最も高い成長率を示しており、機能性栄養を探求するペットオーナーにとって、広範囲な栄養サポートが依然として主要な導入ポイントであることを示唆しています。ヒルズ・ペットニュートリションのActivBiomeテクノロジーは、この分野における革新の好例であり、従来のビタミンにプレバイオティック繊維を組み合わせ、消化器の健康をサポートします。ペットの最適な健康維持においてこれらの必須栄養素が重要であるという飼い主の認識が高まっていることから、このセグメントは大きな注目を集めています。
ペット用ニュートラシューティカルズ市場レポートは、サブ製品別(乳由来バイオアクティブ、オメガ3脂肪酸、プロバイオティクス、タンパク質・ペプチド、ビタミン・ミネラル、その他栄養補助食品)、ペット種別(猫、犬、その他ペット)、流通チャネル別(コンビニエンスストア、オンラインチャネル、専門店、スーパーマーケット/ハイパーマーケット、その他チャネル)、地域別(アフリカ、アジア太平洋、欧州、北米、南米)に分析されています。
地域別分析
北米は、高いペット飼育率、確立された獣医療インフラ、予防的なペット医療への投資意欲の高い消費者層に支えられ、2025年に44.10%の市場シェアを占め、世界市場をリードしております。同地域は、製造業者に明確な指針を提供すると同時に、製品の安全性と有効性に対する消費者の信頼を構築する先進的な規制枠組みの恩恵を受けております。
欧州は2025年に大きな市場シェアを獲得しており、EFSA(欧州食品安全機関)の規制面でのリーダーシップがポストバイオティクスなどの新規成分の承認経路を創出し、その後他の市場でも受け入れられています。同地域が持続可能性を重視する姿勢は、藻類由来のオメガ3代替品や環境に配慮した包装の採用を促進し、世界の製品開発に影響を与える動向を形成しています。西欧ではペットの人間化動向が加速し、成長見通しは堅調に推移します。一方、東欧市場では可処分所得の増加に伴い、拡大の機会が生まれています。
アフリカ地域は2031年までCAGR8.75%と最も高い成長率を示しており、基本的なペット飼育動向と栄養健康効果への認識拡大が交差する初期段階の市場発展を反映しています。獣医クリニック、ペット専門店、オンライン小売チャネルを含む強固な流通ネットワークが整備され、ペットオーナーの製品入手可能性が大幅に改善されていることが同地域の強みです。
その他の特典:
- エクセル形式の市場予測(ME)シート
- アナリストによる3ヶ月間のサポート
よくあるご質問
目次
第1章 イントロダクション
- 調査の前提条件と市場の定義
- 調査範囲
- 調査手法
第2章 レポート提供
第3章 エグゼクティブサマリーおよび主要な調査結果
第4章 主要業界動向
- ペットの飼育数
- 猫
- 犬
- その他のペット
- ペット関連支出
- 消費者の動向
第5章 供給と生産の動向
- 貿易分析
- 原料動向
- バリューチェーン及び流通チャネル分析
- 規制の枠組み
- 市場促進要因
- ペットの人間化が進み、機能性栄養への需要が高まっています
- ペットの肥満および慢性疾患の発生率上昇
- プレミアム化により健康維持製品の支出が増加
- 遠隔獣医療プラットフォームが栄養補助食品の定期購入を促進
- 持続可能性要件に伴う藻類由来オメガ3の採用
- EFSA(欧州食品安全機関)の承認がポストバイオティクスの採用を促進
- 市場抑制要因
- 地域ごとの規制定義のばらつき
- プレミアム価格設定が新興市場での普及を制限
- 資源保護割当によるオキアミ油供給の不安定性
- 電子商取引における表示内容の厳格な審査が製品販売停止につながっています
第6章 市場規模と成長予測(金額および数量)
- サブプロダクト
- 乳由来バイオアクティブ成分
- オメガ3脂肪酸
- プロバイオティクス
- タンパク質およびペプチド
- ビタミンとミネラル
- その他の栄養補助食品
- ペット
- 猫
- 犬
- その他のペット
- 流通チャネル
- コンビニエンスストア
- オンラインチャネル
- 専門店
- スーパーマーケット/ハイパーマーケット
- その他のチャネル
- 地域
- アフリカ
- 国別
- 南アフリカ
- その他アフリカ
- 国別
- アジア太平洋地域
- 国別
- オーストラリア
- 中国
- インド
- インドネシア
- 日本
- マレーシア
- フィリピン
- 台湾
- タイ
- ベトナム
- その他アジア太平洋地域
- 国別
- 欧州
- 国別
- フランス
- ドイツ
- イタリア
- オランダ
- ポーランド
- ロシア
- スペイン
- 英国
- その他欧州地域
- 国別
- 北米
- 国別
- カナダ
- メキシコ
- 米国
- その他北米地域
- 国別
- 南米
- 国別
- アルゼンチン
- ブラジル
- その他南米
- 国別
- アフリカ
第7章 競合情勢
- 主要な戦略的動きs
- 市場シェア分析
- Brand Positioning Matrix
- Market Claim Analysis
- 企業概況
- 企業プロファイル.
- Mars, Incorporated
- Vetoquinol
- ADM
- Clearlake Capital Group, L.P.(Wellness Pet Company, Inc.)
- Nestle(Purina)
- Virbac
- Alltech
- Vafo Praha s.r.o.
- Nutramax Laboratories, Inc.
- Dechra Pharmaceuticals PLC
- Zesty Paws LLC
- Blue Buffalo(General Mills Inc.)
- Kemin Industries, Inc.
- DSM-Firmenich
- Healthy Pets Inc.

