
米国のペット用栄養補助食品:市場シェア分析、産業動向、成長予測(2025~2030年)
US Pet Nutraceuticals - Market Share Analysis, Industry Trends & Statistics, Growth Forecasts (2025 - 2030)- 発行日
- ページ情報
- 英文 204 Pages
- 納期
- 2~3営業日
- 商品コード
- 1693996
- カスタマイズ可能 お客様のご希望に応じて、既存データの加工や未掲載情報(例:国別セグメント)の追加などの対応が可能です。詳細はお問い合わせください。
- 適宜更新あり 本レポートは最新情報反映のため適宜更新し、内容構成変更を行う場合があります。ご検討の際はお問い合わせください。
- 翻訳ツール提供対象 PDF対応AI翻訳ツールの無料貸し出しサービスのご利用が可能です
概要
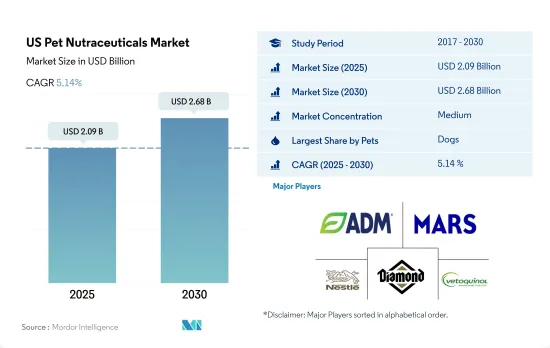
米国のペット用栄養補助食品市場規模は2025年に20億9,000万米ドルと推定・予測され、2030年には26億8,000万米ドルに達し、予測期間(2025~2030年)のCAGRは5.14%で成長すると予測されます。
米国のペット用栄養補助食品市場では、犬の飼育数が多いため犬が最大のシェアを占める
- 栄養補助食品はペットにとって重要な栄養源です。それらはサプリメントとして機能し、ペットの食事の栄養完全性を確保することを目的としています。2022年の米国のペットフード市場に占める栄養補助食品の割合はわずか2.8%であったが、これは主に多くの飼い主の認識不足と、従来のペットフードに比べ比較的高価であることによる。
- 犬用セグメントは米国のペット用栄養補助食品市場で支配的な地位を占め、2022年には11億米ドルに達したが、これは同国の犬の飼育数が多い(ペット総飼育数の約33.6%)ことに起因します。このセグメントの市場規模は2017~2021年にかけて約10.3%成長したが、これは主に栄養補助食品を通じて犬の健康と幸福を向上させる方法を求める飼い主の増加によるものです。
- 猫セグメントは米国で最も急成長しているセグメントの1つで、予測期間中のCAGRは3.4%と予測されています。この成長は、2017~2022年の間に14.8%増加した猫の飼育数増加、猫の健康問題の発生率の上昇、メンテナンスが容易で費用対効果が高いことからペットとしての猫の人気が高まっていることが背景にあると考えられます。
- その他のペットには、鳥類、小型哺乳類、げっ歯類が含まれます。これらの動物もまた、潜在的な健康問題を予防するために、栄養補助食品に対する大きな要求を持っています。その他のペットセグメントは、2022年には2億20万米ドルと評価されました。
- ペットの飼い主の意識の高まりと国内のペット数の増加が、米国のペット用栄養補助食品市場を今後数年間牽引すると予想されます。
米国のペット用栄養補助食品市場の動向
ペットの人間化の進展と同伴需要の増加が米国の猫の飼育数を牽引
- 米国の猫の飼育数は増加しています。同国では、交友関係の需要が高く、他のペットに比べて猫のペットフードへの支出が少ないため、ペットとしての猫が飼われています。同国におけるペットとしての猫は、ペットの人間化の高まりにより、2017~2022年の間に10.8%成長しました。また、猫は犬よりも居住面積が少なくて済むため、狭いアパートにも適しています。米国では、猫をペットとして飼う世帯は2020年に26%、2022年には53.5%増加しました。
- パンデミックの間、米国では在宅勤務文化のためにペットとしての猫の採用が増加し、コンパニオンシップの需要につながりました。また、ペットを飼う人の多くはミレニアル世代です。2022年には、米国のミレニアル世代の33%がペットの親となり、2020年には、猫のペット数の40%が米国の動物保護施設から引き取られました。ペットペアレントは高収入のため、ペットショップから猫を購入しました。2020年、米国では43%の猫親がペットショップから猫を購入しています。そのため、2020~2022年にかけて、同国のペットとしての猫の飼育率は4.5%増加しました。
- 2017~2018年にかけて、約76%の猫親が猫を家族の一員として扱っています。ペットの人間化は、栄養価の高い専用ペットフードなどのペット製品の成長を後押しすると予想されます。また、人々は愛する人に猫を贈るようになっており、2021年には米国における猫の飼い主の3%を占めました。
- 猫の採用や購入が増え、ペットの人間化が進むことで、同国のペット数が増加すると予想されます。このペット数の増加は、米国のペット用栄養補助食品市場の成長をさらに押し上げる可能性があります。
ペットの健康を重視する飼い主の増加と、様々な流通チャネルを通じたペット用サプリメントの入手可能性の増加が、米国におけるペット用栄養補助食品へのペット支出を促進しています。
- 米国のペット支出は、ここ数年着実に増加しています。同国のペット支出全体は2021年の1,236億米ドルから2022年には1,368億米ドルへと10.7%増加したが、これは主にペットの人間化の進展、ペットの健康や福祉に対する飼い主の関心の高まり、様々な流通チャネルを通じたペット用サプリメントの入手可能性の増大によるものです。
- ペット用栄養補助食品への支出は、2022年のペット1匹当たりの平均ペットフード支出の16.5%を占めました。同国のペット1匹当たりの栄養補助食品支出は、主にペットの人間化の進展、予防医療への支出の増加、ペット用栄養補助食品に関連する様々な健康上の利点により、2017年の231.3米ドルから2022年には324.1米ドルに増加しました。ペット動物の中では、犬に対するペット用栄養補助食品の支出が最も高く(2022年に犬1頭当たり137.3米ドル)、次いで猫(同115.6米ドル)です。
- ペットの親は、オンライン小売業者、スーパーマーケット、ペットショップを通じてペット用栄養補助食品を購入します。ペットの親はeコマースを通じて多くのペット用サプリメントを購入するため、専門店やオンライン小売業者を通じたペット用栄養補助食品の売上は高いです。パンデミックもオンライン注文の需要を増加させました。国内のオンラインチャネルを通じたペットサプリメント販売のシェアは、2017年の18.1%から2022年には24.8%に増加しました。高品質フードの利点に対する意識の高まりとペットフード製品のプレミアム化は、同国におけるペット支出を引き続き促進すると予想されます。
米国のペット用栄養補助食品産業概要
米国のペット用栄養補助食品市場は適度に統合されており、上位5社で53.28%を占めています。この市場の主要企業は、ADM、Mars Incorporated、Nestle(Purina)、Schell & Kampeter Inc.(Diamond Pet Foods)、Vetoquinolです。
その他の特典
- エクセル形式の市場予測(ME)シート
- 3ヶ月間のアナリストサポート
目次
第1章 エグゼクティブサマリーと主要調査結果
第2章 レポートのオファー
第3章 イントロダクション
- 調査の前提条件と市場定義
- 調査範囲
- 調査手法
第4章 主要産業動向
- ペット数
- 猫
- 犬
- その他
- ペット支出
- 規制の枠組み
- バリューチェーンと流通チャネル分析
第5章 市場セグメンテーション
- サブ製品
- ミルクバイオアクティブ
- オメガ3脂肪酸
- プロバイオティクス
- タンパク質とペプチド
- ビタミンとミネラル
- その他の栄養補助食品
- ペット
- 猫
- 犬
- その他
- 流通チャネル
- コンビニエンスストア
- オンラインチャネル
- 専門店
- スーパーマーケット/ハイパーマーケット
- その他のチャネル
第6章 競合情勢
- 主要な戦略動向
- 市場シェア分析
- 企業情勢
- 企業プロファイル
- ADM
- Alltech
- Clearlake Capital Group, L.P.(Wellness Pet Company Inc.)
- Dechra Pharmaceuticals PLC
- Mars Incorporated
- Nestle(Purina)
- Nutramax Laboratories Inc.
- Schell & Kampeter Inc.(Diamond Pet Foods)
- Vetoquinol
- Virbac
第7章 CEOへの主要戦略的質問
第8章 付録
- 世界概要
- 概要
- ファイブフォース分析フレームワーク
- 世界のバリューチェーン分析
- 市場力学(DROs)
- 情報源と参考文献
- 図表一覧
- 主要な洞察
- データパック
- 用語集
目次
Product Code: 50001479
The US Pet Nutraceuticals Market size is estimated at 2.09 billion USD in 2025, and is expected to reach 2.68 billion USD by 2030, growing at a CAGR of 5.14% during the forecast period (2025-2030).
Dogs hold the largest share of the US pet nutraceuticals market due to their higher population
- Nutraceuticals are an important source of nutrition for pets. They are intended to work as supplements and ensure the nutritional completeness of the diet in pets. Nutraceuticals accounted for only 2.8% of the US pet food market in 2022, primarily due to a lack of awareness among many pet owners and the relatively higher cost compared to traditional pet food.
- The dog segment held a dominant position in the US pet nutraceuticals market, reaching a value of USD 1.10 billion in 2022, attributed to the high population of dogs in the country (about 33.6% of the total pet population). The segment's market value grew by approximately 10.3% between 2017 and 2021, primarily driven by a rising number of pet owners who are seeking ways to improve the health and well-being of their dogs through nutraceutical products.
- The cats segment is projected to be one of the fastest-growing segments in the United States, with a CAGR of 3.4% during the forecast period. This growth is likely to be driven by the increasing cat population, which grew by 14.8% between 2017 and 2022, the rising incidence of health issues in cats, and the growing popularity of cats as pets due to their low maintenance and cost-effectiveness.
- The other pets include birds, small mammals, and rodents. These animals also have significant requirements for nutraceuticals to prevent potential health problems. The other pets segment was valued at USD 200.2 million in 2022.
- The increasing awareness among pet owners and the growing population of pets in the country are expected to drive the US pet nutraceuticals market in the coming years.
US Pet Nutraceuticals Market Trends
The growing pet humanization and increased demand for companionship are driving the cat population in the United States
- The cat population in the United States has been growing. Cats as pets are being adopted in the country due to the high demand for companionship and less expenditure on pet food for cats than other pets. Cats as pets in the country grew by 10.8% between 2017 and 2022 due to the rising pet humanization. Cats are also suitable for smaller apartments as they require less area to live in than dogs. In the United States, households owning a cat as a pet grew by 26% in 2020 and 53.5% in 2022.
- During the pandemic, the United States witnessed higher adoption of cats as pets due to the work-from-home culture, leading to the demand for companionship. A higher number of pet owners are also millennials. In 2022, 33% of millennials in the United States were pet parents, and in 2020, 40% of the cat pet population was adopted from animal shelters in the United States. Pet parents purchased cats from pet stores due to high income. In 2020, 43% of cat parents in the United States purchased cats from pet stores. Therefore, the country's adoption rate of cats as pets grew by 4.5% between 2020 and 2022.
- About 76% of cat parents treated their cats as a part of their family between 2017 and 2018. Pet humanization is expected to boost the growth of pet products, including pet food such as nutritious specialized pet food. People are also gifting cats to their loved ones, which accounted for 3% of cat owners in the United States in 2021.
- An increase in the adoption and purchase of cats and rising pet humanization are expected to boost the pet population in the country. This rising pet population may further boost the growth of the US pet nutraceuticals market in the country.
Increasing pet owners focusing on their pet health and the growing availability of pet supplements through various distribution channels are driving the pet expenditure on pet nutraceuticals in the United States
- Pet expenditure in the United States has steadily increased over the years. The overall pet expenditure in the country increased from USD 123.6 billion in 2021 to USD 136.8 billion in 2022, representing a 10.7% increase, mainly due to the growing pet humanization, increased pet owners' focus on their pet health and well-being, and the increasing availability of pet supplements through various distribution channels.
- Expenditure on pet nutraceuticals accounted for 16.5% of the average pet food expenditure per pet in 2022. The nutraceutical expenditure per pet in the country increased from USD 231.3 in 2017 to USD 324.1 in 2022, mainly due to the growing pet humanization, the increased spending on preventive care, and the various health benefits associated with pet nutraceuticals. Among pet animals, pet nutraceutical expenditure on dogs is the highest (USD 137.3 per dog in 2022), followed by cats (USD 115.6 in the same year).
- Pet parents purchase pet nutraceuticals through online retailers, supermarkets, and pet stores. The sales of pet nutraceuticals through specialty stores and online retailers are high as pet parents purchase many pet supplements through e-commerce. The pandemic also increased the demand for online orders. The share of pet supplement sales through online channels in the country increased from 18.1% in 2017 to 24.8% in 2022. The growing awareness of the benefits of quality food and the premiumization of pet food products are anticipated to continue driving pet expenditure in the country.
US Pet Nutraceuticals Industry Overview
The US Pet Nutraceuticals Market is moderately consolidated, with the top five companies occupying 53.28%. The major players in this market are ADM, Mars Incorporated, Nestle (Purina), Schell & Kampeter Inc. (Diamond Pet Foods) and Vetoquinol (sorted alphabetically).
Additional Benefits:
- The market estimate (ME) sheet in Excel format
- 3 months of analyst support
TABLE OF CONTENTS
1 EXECUTIVE SUMMARY & KEY FINDINGS
2 REPORT OFFERS
3 INTRODUCTION
- 3.1 Study Assumptions & Market Definition
- 3.2 Scope of the Study
- 3.3 Research Methodology
4 KEY INDUSTRY TRENDS
- 4.1 Pet Population
- 4.1.1 Cats
- 4.1.2 Dogs
- 4.1.3 Other Pets
- 4.2 Pet Expenditure
- 4.3 Regulatory Framework
- 4.4 Value Chain & Distribution Channel Analysis
5 MARKET SEGMENTATION (includes market size in Value in USD and Volume, Forecasts up to 2030 and analysis of growth prospects)
- 5.1 Sub Product
- 5.1.1 Milk Bioactives
- 5.1.2 Omega-3 Fatty Acids
- 5.1.3 Probiotics
- 5.1.4 Proteins and Peptides
- 5.1.5 Vitamins and Minerals
- 5.1.6 Other Nutraceuticals
- 5.2 Pets
- 5.2.1 Cats
- 5.2.2 Dogs
- 5.2.3 Other Pets
- 5.3 Distribution Channel
- 5.3.1 Convenience Stores
- 5.3.2 Online Channel
- 5.3.3 Specialty Stores
- 5.3.4 Supermarkets/Hypermarkets
- 5.3.5 Other Channels
6 COMPETITIVE LANDSCAPE
- 6.1 Key Strategic Moves
- 6.2 Market Share Analysis
- 6.3 Company Landscape
- 6.4 Company Profiles
- 6.4.1 ADM
- 6.4.2 Alltech
- 6.4.3 Clearlake Capital Group, L.P. (Wellness Pet Company Inc.)
- 6.4.4 Dechra Pharmaceuticals PLC
- 6.4.5 Mars Incorporated
- 6.4.6 Nestle (Purina)
- 6.4.7 Nutramax Laboratories Inc.
- 6.4.8 Schell & Kampeter Inc. (Diamond Pet Foods)
- 6.4.9 Vetoquinol
- 6.4.10 Virbac
7 KEY STRATEGIC QUESTIONS FOR PET FOOD CEOS
8 APPENDIX
- 8.1 Global Overview
- 8.1.1 Overview
- 8.1.2 Porter's Five Forces Framework
- 8.1.3 Global Value Chain Analysis
- 8.1.4 Market Dynamics (DROs)
- 8.2 Sources & References
- 8.3 List of Tables & Figures
- 8.4 Primary Insights
- 8.5 Data Pack
- 8.6 Glossary of Terms
米国のペット用栄養補助食品:市場シェア分析、産業動向、成長予測(2025~2030年)
- 発行日
- 発行
- Mordor Intelligence
- ページ情報
- 英文 204 Pages
- 納期
- 2~3営業日

