
北米のアイスクリーム:市場シェア分析、産業動向、成長予測(2025年~2030年)
North America Ice Cream - Market Share Analysis, Industry Trends & Statistics, Growth Forecasts (2025 - 2030)- 発行日
- ページ情報
- 英文 173 Pages
- 納期
- 2~3営業日
- 商品コード
- 1686218
- カスタマイズ可能 お客様のご希望に応じて、既存データの加工や未掲載情報(例:国別セグメント)の追加などの対応が可能です。詳細はお問い合わせください。
- 適宜更新あり 本レポートは最新情報反映のため適宜更新し、内容構成変更を行う場合があります。ご検討の際はお問い合わせください。
- 翻訳ツール提供対象 PDF対応AI翻訳ツールの無料貸し出しサービスのご利用が可能です
概要
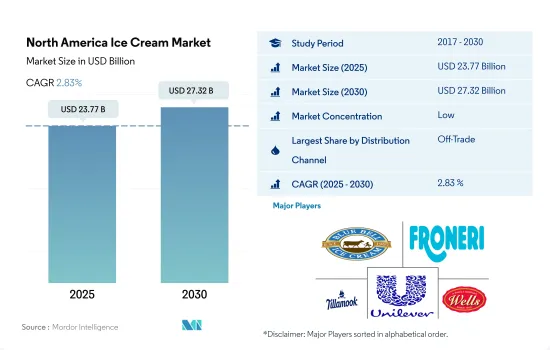
北米のアイスクリーム市場規模は2025年に237億7,000万米ドルと推定・予測され、2030年には273億2,000万米ドルに達し、予測期間(2025年~2030年)のCAGRは2.83%で成長すると予測されます。
消費者のライブショッピング体験に対する需要の高まりが小売ビジネスを後押し
- 北米地域の流通チャネルは、オン・トレードとオフ・トレードに二分されます。オフ・トレード・セグメントは、前年の2021年と比較して、2022年には2.4%の成長を示しました。オフ・トレード・チャンネルの成長は、消費者に提供するショッピング施設に関連しています。スーパーマーケットやハイパーマーケットでは、4.84米ドルから最高140米ドルまで、さまざまな価格でアイスクリームを提供しています。アイスクリームをさまざまな価格で簡単に入手できることも、消費者の購買力を高めています。これに加えて、アイスクリームに対する需要の高まりと消費者の便利な買い物の選択肢を求めて、2025年には流通チャネル部門の非売品小売セグメントの小売額は4.01%成長すると推定されます。
- COVID-19の発生後、消費者は自宅外での消費を好むようになりました。この結果、フードチェーン部門と外食小売店の需要は2022年に2.4%増加しました。北米地域の有名なアイスクリーム外食チェーンには、Baskin-Robbins、Ben and Jerryなどがあります。これらの小売業者は、チョコレート、バニラ、ストロベリーなど、さまざまなフレーバーのアイスクリームを提供しています。
- 北米では、オンライン小売部門も2022年に小売額が2.56%増加します。これらのオンライン小売業者は、さまざまな原材料、ブランド、フレーバーなどを持つ幅広い製品を提供しています。オンライン小売業者は、さまざまなオファーを提供することで、消費者の関心をeコマース・ショッピングに集めています。アイスクリームの迅速な購入オプションを求め、アイスクリームの消費額は前年の2020年と比較して5.48%増加しました。
様々なフレーバーが豊富に揃い、浸透した小売チャネルと相まって市場は成長へ
- 北米地域のアイスクリーム産業は、2021年と比較して2022年には2.40%の成長を示しました。この分野では、さまざまなフレーバーが入手しやすくなっており、今後も成長が見込まれます。消費者の注目を集めるため、メーカーは低脂肪や無脂肪のアイスクリームなど、さまざまな形態のアイスクリームを販売しています。このため、健康的な食生活を維持しようとする人々の間で、アイスクリーム製品に対する関心が高まっています。アイスクリーム製品の需要を求め、アイスクリーム産業は2024年に3.2%の成長が見込まれます。
- 北米地域では、米国がアイスクリーム業界を支配しています。2022年、米国のシェアは70.08%でした。2023年1月、米国で営業しているコンビニエンスストアは150,174店で、2022年の店舗数から1.5%増加しました。これは消費者がアイスクリーム製品を購入するのに役立っています。
- カナダのシェアは18.85%。最もコンビニエンスストアが多いのはテキサス州で16,018店舗、次いでカリフォルニア州の12,000店舗となっています。北米地域で有名な店舗には、ウォルマート、アマゾン、クローガー、ターゲットなどがあります。これらの店舗は、市場で多種多様なアイスクリーム製品を提供しています。
- メキシコのシェアは51.02%。2020年には、全国に33のスーパーマーケット・チェーンがあり、3,227店舗、2,365の百貨店、53,793の専門店がありました。小売市場の約50%は、移動式露天商やオープン・パブリック・マーケットなど、非公式の店舗が占めています。アイスクリーム製品もさまざまな価格(低価格、中価格、高価格)で販売されています。パック入り牛乳の基本販売価格は1.72米ドルで、最高価格は50.5米ドルです。さまざまな価格帯の製品が入手可能なため、国民の購買力が高まっています。
北米のアイスクリーム市場動向
さまざまなフレーバーのアイスクリーム製品が入手可能であることが、北米での消費を促進する要因のひとつです。
- アイスクリーム分野は、北米地域の消費者の間で大きな人気を集めているが、その主な理由は幅広いフレーバーが入手可能なことです。人気のフレーバーには、チョコレート、クッキー&クリーム、バニラ、ストロベリーなどがあります。バニラ味は消費者の36.87%に好まれ、チョコレートは25.42%に好まれています。2022年、このセグメントは2021年比で7.6%の成長を示しました。アメリカ人は平均して、年間約10kgのアイスクリームと関連フローズン・デザートを消費します。通常のアイスクリームは、フローズン・デザートの中で最も人気のあるカテゴリーです。
- アイスクリームの全乳固形分には、脂肪分とその他の固形分が含まれます。これらの乳固形分には、牛乳に含まれるタンパク質と乳糖が含まれ、アイスクリームでは9%から12%の範囲です。このため、一人当たりの消費量は年々増加しており、2020年から2023年にかけては2.21%増加しました。メキシコでは、2023年の生乳生産量は1,342万トン(MMT)と予測され、2022年から2%の伸びを示しています。これは、国内のインフレ率と飼料価格の両方が高いにもかかわらず、生産者が繁栄を続けているためです。
- 北米では、アイスクリームは4.97米ドルから87.2米ドル以上の価格で販売されています。メキシコでは、2022年6月現在、農場で支払われるフルイドミルクの平均価格は1リットル当たり7.80MXN(0.39米ドル)です。この価格は前月比で1.3%の上昇、2021年6月比で12.6%の上昇を反映しています。メキシコにおける牛乳の卸売価格は1リットル当たり17.64MXN(0.88米ドル)で、2021年5月と比較して1.6%の上昇、前年と比較して14.5%の上昇となりました。消費者が支払う平均価格は現在1リットル当たり22.02MXN(1.1米ドル)で、2022年5月と比較して0.22%の上昇、2021年6月と比較して9.6%の上昇を示しています。
北米のアイスクリーム産業の概要
北米のアイスクリーム市場は細分化されており、上位5社で32.72%を占めています。この市場の主要企業は以下の通り。 Blue Bell Creameries LP, Froneri International Limited, Tillamook CCA, Unilever PLC and Wells Enterprises Inc.(sorted alphabetically).
その他の特典
- エクセル形式の市場予測(ME)シート
- アナリストによる3ヶ月間のサポート
目次
第1章 エグゼクティブサマリーと主な調査結果
第2章 レポートのオファー
第3章 イントロダクション
- 調査の前提条件と市場定義
- 調査範囲
- 調査手法
第4章 主要産業動向
- 一人当たり消費量
- 原材料/商品生産量
- 牛乳
- 規制の枠組み
- カナダ
- メキシコ
- 米国
- バリューチェーンと流通チャネル分析
第5章 市場セグメンテーション
- 流通チャネル
- オフトレード
- サブ流通チャネル別
- コンビニエンスストア
- オンライン小売
- 専門店
- スーパーマーケットとハイパーマーケット
- その他(倉庫クラブ、ガソリンスタンドなど)
- オン・トレード
- オフトレード
- 国名
- カナダ
- メキシコ
- 米国
- その他の北米
第6章 競争情勢
- 主要な戦略動向
- 市場シェア分析
- 企業情勢
- 企業プロファイル.
- Agropur Dairy Cooperative
- Arla Foods amba
- Blue Bell Creameries LP
- Chapman's
- Froneri International Limited
- Prairie Farms Dairy Inc.
- Tillamook CCA
- Turkey Hill Dairy
- Unilever PLC
- Wells Enterprises Inc.
- Yasso Inc.
第7章 CEOへの主な戦略的質問
第8章 付録
- 世界概要
- 概要
- ファイブフォース分析フレームワーク
- 世界のバリューチェーン分析
- 市場力学(DROs)
- 情報源と参考文献
- 図表一覧
- 主要洞察
- データパック
- 用語集
目次
The North America Ice Cream Market size is estimated at 23.77 billion USD in 2025, and is expected to reach 27.32 billion USD by 2030, growing at a CAGR of 2.83% during the forecast period (2025-2030).
Increasing demand for live shopping experience among consumers is boosting the retailing business
- The distribution channel of the North American region is bifurcated into on-trade and off-trade retailing chambers. The off-trade segment witnessed a growth of 2.4% in 2022 compared with the previous year, 2021. The growth in off-trade channels is related to the shopping facility that it provides to its consumers. The supermarket and hypermarkets provide ice cream at different prices, which range from USD 4.84 and go up to more than USD 140. The easy availability of ice creams at different prices also surges the buying power of consumers. In addition to this, seeking the rising demand for ice cream and convenient shopping options among consumers, the off-trade retailing segment's retail value of the distribution channel sector is estimated to grow by 4.01% in 2025.
- After the COVID-19 outbreak, consumers have started preferring out-home consumption. As a result of this, the demand for the food chains segment and food service retailers increased by 2.4% in 2022. Some of the famous ice cream food service chains in the North American region are Baskin-Robbins, Ben and Jerry, etc. These retailers provide ice cream in different flavors, including chocolate, vanilla, and strawberry, among others.
- In North America, online retailing sectors also witnessed growth in their retail value by 2.56% in 2022. These online retailers offer a wide range of products with varied ingredients, brands, flavors, etc. Online retailers are captivating the focus of consumers towards e-commerce shopping by offering them a variety of offers. Seeking quick buying options for ice cream, the consumption value of ice cream increased by 5.48% when compared to the preceding year, 2020.
Strong availability of various flavors coupled with well penetrated retail channels market market to grow
- The ice cream industry in the North American region witnessed a growth of 2.40% in 2022 compared to 2021. It is anticipated to grow with the rising availability of a variety of flavors in this segment. In order to captivate the focus of consumers, manufacturers are selling ice cream in different formats, including low-fat and fat-free ice creams. This has led to an increased interest in ice cream products as people seek to maintain a healthy diet. Seeking the demand for ice cream products, the ice cream industry is expected to grow by 3.2% in 2024.
- In the North American region, the United States is dominating the ice cream industry. In 2022, the US held a share of 70.08%. In January 2023, there were 150,174 convenience stores operating in the United States, which was a rise of 1.5% from the 2022 store count. This helps consumers purchase ice cream products.
- Canada held a share of 18.85%. Texas has the most convenience stores, with 16,018 stores, which is followed by California, with 12,000 stores. Some of the famous stores in the North American region are Walmart, Amazon, Kroger, and Target, among others. These stores offer a wide variety of ice cream products in the market.
- Mexico held a share of 51.02%. In 2020, there were 33 supermarket chains, with 3,227 stores, 2,365 department stores, and 53,793 specialized stores throughout the country. Around 50% of the retail market is covered by informal establishments, such as mobile street vendors and open public markets. Ice cream products are also available at varied prices (low, medium, and high). The base selling price of packaged milk is USD 1.72, which goes as high as USD 50.5. The availability of these products at various price ranges promotes buying power among the population.
North America Ice Cream Market Trends
The availability of various flavors of ice cream products is one of the factors driving consumption in North America
- The ice cream segment is gaining significant popularity among consumers in the North American region, primarily due to the availability of a wide range of flavors. Popular flavors include chocolate, cookies and cream, vanilla, and strawberry. The vanilla flavor is preferred by 36.87% of consumers, while chocolate is preferred by 25.42% of the population. In 2022, the segment witnessed a growth of 7.6% compared to 2021. On average, an American consumes approximately 10 kg of ice cream and related frozen desserts per year. Regular ice cream is the most popular category of frozen desserts.
- The total milk solids component of ice cream includes both fat and other solids. These milk solids include the protein and lactose levels in milk and range from 9% to 12% in ice cream. This has resulted in a rise in per capita consumption over the years, which increased by 2.21% from 2020 to 2023. In Mexico, the forecast for milk production in 2023 is 13.42 million metric tons (MMT), a growth of 2% from 2022, as producers continue to thrive despite both high domestic inflation and feed prices.
- In North America, ice creams are available at a price ranging from USD 4.97 to more than USD 87.2. In Mexico, the average price for fluid milk paid on the farm was MXN 7.80 (USD 0.39) per liter as of June 2022. This price reflects a 1.3% increase compared to the previous month and a 12.6% increase compared to June 2021. The wholesale price of milk in Mexico was MXN 17.64 (USD 0.88) per liter, representing a 1.6% increase compared to May 2021 and a 14.5% increase compared to the previous year. The average price paid by consumers is currently MXN 22.02 (USD 1.1) per liter, showing a 0.22% increase compared to May 2022 and a 9.6% increase compared to June 2021.
North America Ice Cream Industry Overview
The North America Ice Cream Market is fragmented, with the top five companies occupying 32.72%. The major players in this market are Blue Bell Creameries LP, Froneri International Limited, Tillamook CCA, Unilever PLC and Wells Enterprises Inc. (sorted alphabetically).
Additional Benefits:
- The market estimate (ME) sheet in Excel format
- 3 months of analyst support
TABLE OF CONTENTS
1 EXECUTIVE SUMMARY & KEY FINDINGS
2 REPORT OFFERS
3 INTRODUCTION
- 3.1 Study Assumptions & Market Definition
- 3.2 Scope of the Study
- 3.3 Research Methodology
4 KEY INDUSTRY TRENDS
- 4.1 Per Capita Consumption
- 4.2 Raw Material/commodity Production
- 4.2.1 Milk
- 4.3 Regulatory Framework
- 4.3.1 Canada
- 4.3.2 Mexico
- 4.3.3 United States
- 4.4 Value Chain & Distribution Channel Analysis
5 MARKET SEGMENTATION (includes market size in Value in USD and Volume, Forecasts up to 2030 and analysis of growth prospects)
- 5.1 Distribution Channel
- 5.1.1 Off-Trade
- 5.1.1.1 By Sub Distribution Channels
- 5.1.1.1.1 Convenience Stores
- 5.1.1.1.2 Online Retail
- 5.1.1.1.3 Specialist Retailers
- 5.1.1.1.4 Supermarkets and Hypermarkets
- 5.1.1.1.5 Others (Warehouse clubs, gas stations, etc.)
- 5.1.2 On-Trade
- 5.1.1 Off-Trade
- 5.2 Country
- 5.2.1 Canada
- 5.2.2 Mexico
- 5.2.3 United States
- 5.2.4 Rest of North America
6 COMPETITIVE LANDSCAPE
- 6.1 Key Strategic Moves
- 6.2 Market Share Analysis
- 6.3 Company Landscape
- 6.4 Company Profiles (includes Global Level Overview, Market Level Overview, Core Business Segments, Financials, Headcount, Key Information, Market Rank, Market Share, Products and Services, and Analysis of Recent Developments).
- 6.4.1 Agropur Dairy Cooperative
- 6.4.2 Arla Foods amba
- 6.4.3 Blue Bell Creameries LP
- 6.4.4 Chapman's
- 6.4.5 Froneri International Limited
- 6.4.6 Prairie Farms Dairy Inc.
- 6.4.7 Tillamook CCA
- 6.4.8 Turkey Hill Dairy
- 6.4.9 Unilever PLC
- 6.4.10 Wells Enterprises Inc.
- 6.4.11 Yasso Inc.
7 KEY STRATEGIC QUESTIONS FOR DAIRY AND DAIRY ALTERNATIVE CEOS
8 APPENDIX
- 8.1 Global Overview
- 8.1.1 Overview
- 8.1.2 Porter's Five Forces Framework
- 8.1.3 Global Value Chain Analysis
- 8.1.4 Market Dynamics (DROs)
- 8.2 Sources & References
- 8.3 List of Tables & Figures
- 8.4 Primary Insights
- 8.5 Data Pack
- 8.6 Glossary of Terms
- 発行日
- 発行
- Mordor Intelligence
- ページ情報
- 英文 173 Pages
- 納期
- 2~3営業日


