
|
市場調査レポート
商品コード
1906859
北米の貨物およびロジスティックス:市場シェア分析、業界動向と統計、成長予測(2026年~2031年)North America Freight And Logistics - Market Share Analysis, Industry Trends & Statistics, Growth Forecasts (2026 - 2031) |
||||||
カスタマイズ可能
適宜更新あり
|
|||||||
| 北米の貨物およびロジスティックス:市場シェア分析、業界動向と統計、成長予測(2026年~2031年) |
|
出版日: 2026年01月12日
発行: Mordor Intelligence
ページ情報: 英文 713 Pages
納期: 2~3営業日
|

概要
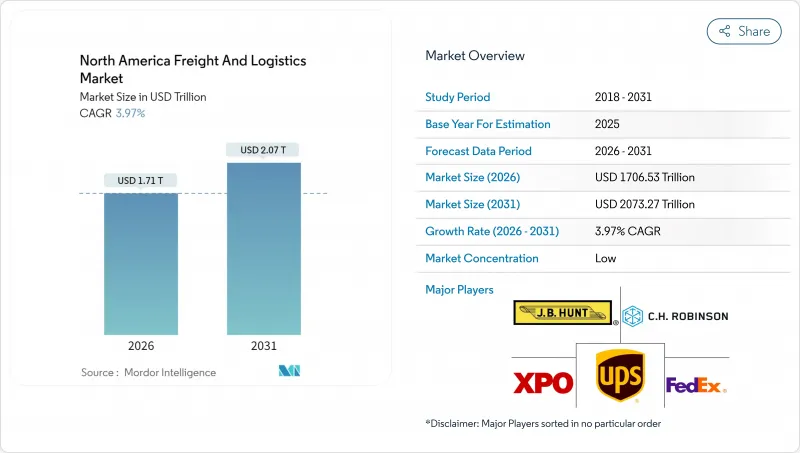
北米の貨物およびロジスティックス市場は、2025年に1兆6,413億7,000万米ドルと評価され、2026年の1兆7,065億3,000万米ドルから2031年までに2兆732億7,000万米ドルに達すると予測されています。
予測期間(2026年~2031年)におけるCAGRは3.97%と見込まれています。
米国・メキシコ・カナダ協定(USMCA)による強固な貿易統合、急増する電子商取引の小包量、連邦政府資金によるインフラ近代化プロジェクトが、この回廊の戦略的重要性を強化し、投資の流れを支えています。2024年には国境を越えた貿易が過去最高水準に達し、カナダと米国の貿易額は7,800億米ドル、メキシコと米国の貿易額は8,078億米ドルに達しました。メキシコへのニアショアリング加速と、1,100億米ドル規模の米国運輸資金が相まって、貨物輸送回廊の再構築と技術主導の効率化が進んでいます。一方で、労働力不足やサイバーセキュリティ脅威が輸送能力を制約し、自動化導入を促進するとともに、強靭なネットワークの必要性を高めています。こうした背景のもと、北米の貨物およびロジスティックス市場は、短期的な運営上の逆風はあるもの、技術革新による着実な成長が見込まれます。
北米の貨物およびロジスティックス市場の動向と洞察
加速するEコマース小包量によるラストマイル革新
2024年第2四半期における電子商取引の浸透率は小売売上高の15.6%に達し、年間240億個以上の小包を発生させ、従来のラストマイル輸送能力を上回りました。これに対し事業者側は、都市部へのマイクロフルフィルメントハブ設置、自律走行配送バンの試験運用、ギグエコノミーの配達員活用により、年間取扱量の40%を占めるピーク時の柔軟な対応能力を強化しました。当日・翌日配送への期待は120億米ドル規模の都市物流不動産市場を創出しており、アマゾンが2024年に150ヶ所の新配送ステーションを開設したことがその証左です。米国とカナダの規制当局は限定的なドローン飛行回廊を認可し、代替輸送手段への制度的支援を示しました。小包密度の増加(2022年比35%増)により路肩の混雑が深刻化し、運送会社は車両の滞留時間と排出ガスを削減する集約型配送モデルの試験導入を進めています。
USMCAによる貿易統合が国境を越えた物流ネットワークを再構築
USMCAにより2024年の三国間貿易額は1兆6,000億米ドルに達し、貨物輸送量は前年比8.2%増加しました。ラレドやデトロイトなどの国境検問所では自動通関プラットフォームにより通関時間が最大30%短縮される一方、メキシコからの4,550億米ドル規模の輸出は高付加価値部品の複雑なリバースロジスティクス需要を生み出しています。2024年のカナダ太平洋鉄道とカンザスシティ・レイルウェイの合併により、カナダの港湾とメキシコの工業地帯を直接結ぶ初の単一路線サービスが確立され、輸送時間の短縮と荷受け回数の最小化が実現しました。強化されたデジタル貿易規定により貨物追跡がリアルタイム化され、高流通量の国境地帯における滞留時間は約90分にまで短縮されています。国境両側におけるコールドチェーン・自動車物流センターへの投資は、北米の貨物およびロジスティックス市場の戦略的深みを浮き彫りにしています。
労働力不足が運営能力を制約
2024年時点で北米全域において8万を超える商用ドライバー職と60万の倉庫業務職が未充足であり、南カリフォルニアやテキサス・トライアングルなどのホットスポットでは離職率が75%を超えました。運送会社が人材獲得競争を繰り広げる中、賃金総額は15~20%上昇したもの、労働力の中央年齢は47歳を超え、長期的な輸送能力に懸念が生じています。自動化への投資額は2024年に48億米ドルに達し、企業はロボット仕分けシステムや自律走行ヤードトラックを導入しました。若年ドライバーによる州間貨物輸送を認める連邦政府の特例措置は実施されていますが、2026年以前に労働力不足が大幅に緩和される見込みは薄いです。
セグメント分析
製造業の28.95%というシェアは、ジャストインタイム方式の定着と複雑な返品フローを示しています。半導体、電気自動車、医療機器メーカーは、管理された環境と安全な輸送を必要とする要件を牽引しています。ニアショアリングが進む中でも、製造業者は生産マイルストーンと貨物マイルストーンを統合し、バッファ在庫を縮小するエンドツーエンドの可視化ツールを求めています。
オムニチャネル対応の推進により、卸売・小売業は4.21%のCAGR(2026-2031年)で最も急速に成長しています。小売業者は配送時間を短縮するため在庫を分散化し、店舗とオンラインの在庫プールを統合しつつあります。温度管理型食料品物流への関心が高まっており、北米の貨物およびロジスティックス市場におけるコールドチェーン投資のさらなる拡大を支えています。リバースロジスティクスの取扱量が増加する中、返品品を迅速に選別し再販またはリサイクルできる運送業者がシェアを拡大するでしょう。
貨物輸送は2025年に収益の62.58%を占め、北米の貨物およびロジスティックス市場における中核的役割を再確認しました。この機能を道路輸送が支配していますが、荷主がコストと持続可能性を優先するにつれ、鉄道コンテナ輸送のシェアは徐々に上昇しています。このセグメントでは、テレマティクスを活用した予知保全により、予期せぬダウンタイムを削減し、配送時間の精度を高めています。自動化パイロット事業は、長距離プラトーニングやヤード内作業用ロボットに拡大しており、今後10年間で有人資産と自律資産の段階的な融合が進むことを示唆しています。
CEPサービスは規模こそ小さいもの、電子商取引の成長により2026年から2031年にかけてCAGR4.4%で拡大しています。都市部の高密度ネットワークとアルゴリズムによる経路最適化を基盤に、米国世帯の75%で当日配送が実現可能となりました。小口配送業者は、リアルタイム需要に輸送能力を調整する動的価格設定エンジンの試験運用を進めています。これらの動向は、ファーストマイル・ラストマイル配送におけるイノベーションが、北米の貨物およびロジスティックス市場全体の競争優位性を決定づけることを示唆しています。
その他の特典:
- エクセル形式の市場予測(ME)シート
- アナリストによる3ヶ月間のサポート
よくあるご質問
目次
第1章 イントロダクション
- 調査の前提条件と市場の定義
- 調査範囲
第2章 調査手法
第3章 エグゼクティブサマリー
第4章 市場情勢
- 市場概要
- 人口統計
- 経済活動別GDP分布
- 経済活動別GDP成長率
- インフレ
- 経済的パフォーマンスとプロファイル
- 電子商取引業界の動向
- 製造業の動向
- 輸送・保管セクターのGDP
- 輸出動向
- 輸入動向
- 燃料価格
- トラック輸送の運営コスト
- トラック輸送車両規模(種類別)
- 主要トラック供給業者
- 物流パフォーマンス
- 輸送モード別シェア
- 海上輸送船隊の積載能力
- 定期船輸送の接続性
- 寄港地とパフォーマンス
- 貨物運賃の動向
- 貨物トン数の動向
- インフラストラクチャー
- 規制の枠組み(道路および鉄道)
- カナダ
- メキシコ
- 米国
- 規制枠組み(海上・航空)
- カナダ
- メキシコ
- 米国
- バリューチェーンと流通チャネル分析
- 市場促進要因
- 加速する電子商取引小包取扱量
- USMCA(米国・メキシコ・カナダ協定)による国境を越えた貿易統合
- 米国インフラ投資・雇用創出法による資金調達
- メキシコへの製造拠点のニアショアリング
- デジタル貨物マーケットプレースとAPI接続性
- 温度管理(コールドチェーン)物流の拡大
- 市場抑制要因
- 運転手および倉庫作業員の労働力不足
- 港湾の混雑と鉄道輸送能力のボトルネック
- トラック業界における保険料の上昇
- 接続車両におけるサイバーセキュリティ上の脆弱性
- 市場における技術革新
- ポーターのファイブフォース分析
- 新規参入業者の脅威
- 買い手の交渉力
- 供給企業の交渉力
- 代替品の脅威
- 競争企業間の敵対関係
第5章 市場規模と成長予測
- エンドユーザー産業
- 農業、漁業、林業
- 建設
- 製造業
- 石油・ガス、鉱業・採石業
- 卸売・小売業
- その他
- ロジスティックス機能
- 宅配便・エクスプレス・小包(CEP)
- 目的地タイプ別
- 国内
- 国際
- 目的地タイプ別
- 貨物フォワーディング
- 輸送手段別
- 航空
- 海上および内陸水路
- その他
- 輸送手段別
- 貨物輸送
- 輸送手段別
- 航空
- パイプライン
- 鉄道
- 道路
- 海上および内陸水路
- 輸送手段別
- 倉庫保管・貯蔵
- 温度管理別
- 非温度管理
- 温度管理
- 温度管理別
- その他のサービス
- 宅配便・エクスプレス・小包(CEP)
- 国
- カナダ
- メキシコ
- 米国
- その他北米地域
第6章 競合情勢
- 市場集中度
- 主要な戦略的動きs
- 市場シェア分析
- 企業プロファイル
- A.P. Moller-Maersk
- AIT Worldwide Logistics
- Americold
- ArcBest
- Arrive Logistics
- Ascent Global Logistics
- Berkshire Hathaway Inc.(Including BNSF Railway Company)
- Brookfield Infrastructure Partners L.P.(Including Genesee & Wyoming Inc.)
- Burris Logistics
- C.H. Robinson
- Canada Post Corporation(Including Purolator)
- Canadian National Railway
- Canadian Pacific Railway
- Capstone Logistics LLC
- Congebec
- CSX Corporation
- DHL Group
- DSV A/S(Including DB Schenker)
- Excel Group
- Expeditors International of Washington, Inc.
- Fastfrate Inc.
- FedEx
- Fomento Economico Mexicano, S.A.B. de C.V.
- GEODIS
- Grupo Mexico
- GXO Logistics, Inc.
- Hub Group Inc.
- J.B. Hunt Transport, Inc.
- Knight-Swift Transportation Holdings, Inc.
- Kuehne+Nagel
- Landstar System, Inc.
- Lineage, Inc.
- M3 Transport
- Mactrans Logistics
- MODE Global LLC
- NFI Industries
- Nippon Express Holdings
- Norfolk Southern Railway
- Old Dominion Freight Line
- Omni Logistics
- OnTrac
- Patriot Rail Company
- Penske Corporation(including Penske Logistics)
- Polaris Worldwide Logistics
- Ryder System, Inc.
- Schneider National, Inc.
- SF Express(KEX-SF)
- TFI International Inc.
- Total Quality Logistics, LLC
- Transportation Insight Holding
- Traxion
- Uber Technologies Inc.
- Union Pacific Railroad
- United Parcel Service of America, Inc.(UPS)
- Werner Enterprises, Inc.
- XPO, Inc.

