
アジア太平洋地域のコンフェクショナリー:市場シェア分析、産業動向・統計、成長予測(2025~2030年)
Asia Pacific Confectionery - Market Share Analysis, Industry Trends & Statistics, Growth Forecasts (2025 - 2030)- 発行日
- ページ情報
- 英文 288 Pages
- 納期
- 2~3営業日
- 商品コード
- 1683178
- カスタマイズ可能 お客様のご希望に応じて、既存データの加工や未掲載情報(例:国別セグメント)の追加などの対応が可能です。詳細はお問い合わせください。
- 適宜更新あり 本レポートは最新情報反映のため適宜更新し、内容構成変更を行う場合があります。ご検討の際はお問い合わせください。
- 翻訳ツール提供対象 PDF対応AI翻訳ツールの無料貸し出しサービスのご利用が可能です
概要
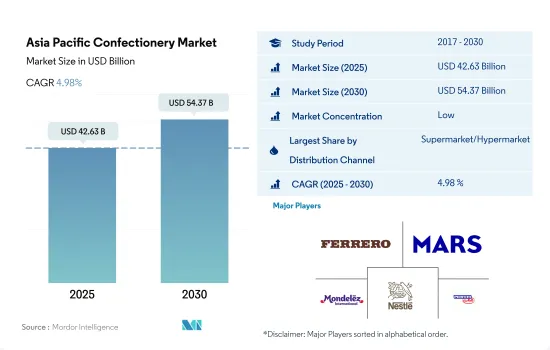
アジア太平洋地域のコンフェクショナリー市場規模は2025年に426億3,000万米ドルと推計され、2030年には543億7,000万米ドルに達すると予測され、予測期間中(2025-2030年)のCAGRは4.98%で成長する見込みです。
スーパーマーケット、ハイパーマーケット、コンビニエンスストアを通じたコンフェクショナリーの衝動買いは、専用棚における戦略的な商品ポジショニングに影響されます。
- アジア太平洋地域におけるコンフェクショナリーの主要販売チャネルはスーパーマーケットとハイパーマーケットです。これらの小売チャネルは消費者にとって理想的な買い物の選択肢であり、さまざまな企業が製造したチョコレート、スナックバー、ガム、キャンディーなど、さまざまな種類のコンフェクショナリーをニーズに合わせて選ぶことができると考えられています。スーパーマーケットとハイパーマーケットにおけるコンフェクショナリーの販売額は、2023年には2022年から3.81%増加しました。予測期間中(2023~2030年)の同製品のCAGRは3.69%と予測されます。
- コンビニエンスストアは、スーパーマーケット、ハイパーマーケットに次いでコンフェクショナリーの購入に広く好まれている流通チャネルです。コンビニエンスストアを通じたコンフェクショナリーの販売量は、2022年と比較して2024年には8.3%の成長率を記録すると推定されます。コンフェクショナリーの専用棚における戦略的な商品ポジショニングは、潜在的消費者の衝動購買行動に影響を与えます。Easy Joy、Meiyijia、7-Eleven Inc.、uSmile、Lawsonは、この地域の大手コンビニエンスストアです。これらの事業者の全国的なネットワークにより、地元や主流のコンフェクショナリーブランドへのアクセスが容易になっています。2023年現在、イージー・ジョイは中国で27,800以上の店舗を運営し、セブン-イレブンは日本で約21,000のコンビニエンスストアを運営しています。
- オンライン・チャネルはコンフェクショナリーの流通チャネルとして急成長しており、予測期間(2023~2030年)のCAGRは金額ベースで4.04%と予測されます。インターネット利用者の増加は、食料品購入におけるオンライン小売チャネルの役割の進化に影響を与えています。2021年には8億4,210万人であったのに対し、2022年には8億4,500万人以上が中国で商品やサービスをオンラインで購入しています。
2023年のアジア太平洋地域のコンフェクショナリー市場のシェアは、中国がトップ、次いで日本が続き、合計で50%を超える
- アジア太平洋地域のコンフェクショナリー市場は、2023年に2022年比4.05%の成長率を記録。同地域のコンフェクショナリー市場は、可処分所得の増加、都市化、消費者の嗜好の変化、嗜好品への欲求の高まりなど、いくつかの要因によって著しい成長を遂げています。
- 他国と比較すると、中国はコンフェクショナリーの消費量が最も多く、同地域で大きなシェアを占めています。中国におけるコンフェクショナリーの販売額は2023年には2022年から3.51%増加するが、これは消費者の高級チョコレートへの嗜好と大陸間フレーバーへの傾向の高まりに起因していると考えられます。
- 日本は同地域におけるコンフェクショナリーの売上高で第2位の国です。日本におけるコンフェクショナリーの販売額は、2023年から2030年にかけてCAGR 3.38%を記録すると予測されます。消費者嗜好の動向は、高級で健康的、持続可能で倫理的な製品へのシフトを示しています。そのため、既存の中・大規模メーカーと並んで、多くの小規模メーカーが市場で事業を展開しています。このような要因が、予測期間中のコンフェクショナリー需要を牽引すると推定されます。
- オーストラリアは、この地域のコンフェクショナリー販売で最も急成長している国です。2022年、オーストラリア人は1人当たり平均133.07米ドルをチョコレート製品に費やしました。2022年には、成人オーストラリア人の約49%がキャンディーやチョコレートを常食していました。同年、オーストラリア人の28%が外出先でのおやつにチョコレートを食べ、23%が愛する人への贈り物としてチョコレートを購入し、33%が食料品店に買い物に行くたびにカートにチョコレートを入れていました。
アジア太平洋地域のコンフェクショナリー市場の動向
オーストラリア市場では、健康的なチョコレートのバリエーションに支えられた甘いものへの嗜好などの要因により、チョコレートの消費が好調です。
- オーストラリアは依然としてアジア太平洋地域における有力なチョコレート消費国です。オーストラリア人は2022年に1人当たり平均125.86米ドルをチョコレートコンフェクショナリーに費やします。2021年には、オーストラリアの成人の49%がキャンディーやチョコレートを定期的に間食していると報告しています。
- コンフェクショナリーの広告、パッケージング、魅力的なポジショニングは、消費者の購買に影響を与える最も顕著な要因です。リシーラブル包装は実用的な包装オプションと見なされており、消費者が小分けにして食べることを可能にしています。この地域の創造的な製品導入は、コンフェクショナリーの購入を促進する重要な決定要因のひとつであり続けています。
- アジア太平洋地域の消費者は高級コンフェクショナリーへの関心を高めており、長い1日や1週間の終わりの「ご褒美」として贅沢なコンフェクショナリーを選ぶようになっています。こうした消費者は、「高価格」「高級パッケージ」「手作り」「少量生産」の製品を好みます。
- 消費者の嗜好は伝統的なおコンフェクショナリーから一口サイズやBFY(ベター・フォー・ユー)チョコレートの消費へとシフトしており、ヘルシーな高級チョコレートの消費需要が加速しています。
アジア太平洋地域のコンフェクショナリー産業の概要
アジア太平洋地域のコンフェクショナリー市場は細分化されており、上位5社で29.29%を占めています。この市場の主要企業は以下の通りです。 Ferrero International SA, Mars Incorporated, Mondelez International Inc., Nestle SA and Perfetti Van Melle BV(sorted alphabetically).
その他の特典
- エクセル形式の市場予測(ME)シート
- 3ヶ月間のアナリストサポート
目次
第1章 エグゼクティブサマリーと主な調査結果
第2章 レポートのオファー
第3章 イントロダクション
- 調査の前提条件と市場定義
- 調査範囲
- 調査手法
第4章 主要産業動向
- 規制の枠組み
- 消費者の購買行動
- 成分分析
- バリューチェーンと流通チャネル分析
第5章 市場セグメンテーション
- コンフェクション別
- チョコレート
- コンフェクショナリー種類別
- ダークチョコレート
- ミルク&ホワイトチョコレート
- ガム
- コンフェクショナリー種類別
- バブルガム
- チューインガム
- 砂糖含有量別
- 砂糖入りチューインガム
- 無糖チューインガム
- スナックコンフェクショナリー
- コンフェクショナリー種類別
- シリアル・バー
- フルーツ&ナッツバー
- プロテイン・バー
- シュガーコンフェクショナリー
- コンフェクショナリー種類別
- ハードキャンディー
- ロリポップ
- ミント
- パスティル、グミ、ゼリー
- トフィーとヌガー
- その他
- チョコレート
- 流通チャネル別
- コンビニエンスストア
- オンラインストア
- スーパーマーケット
- その他
- 国別
- オーストラリア
- 中国
- インド
- インドネシア
- 日本
- マレーシア
- ニュージーランド
- 韓国
- その他アジア太平洋地域
第6章 競合情勢
- 主要な戦略動向
- 市場シェア分析
- 企業情勢
- 企業プロファイル
- Chocoladefabriken Lindt & Sprungli AG
- Delfi Limited
- Ferrero International SA
- General Mills Inc.
- Haighs Proprietary Limited
- Kellogg Company
- Lotte Corporation
- Mars Incorporated
- Meiji Holdings Company Ltd
- Mondelez International Inc.
- Morinaga & Co. LTD
- Nestle SA
- Orion Holdings Corporation
- PepsiCo Inc.
- Perfetti Van Melle BV
- The Hershey Company
第7章 CEOへの主な戦略的質問
第8章 付録
- 世界概要
- 概要
- ファイブフォース分析フレームワーク
- 世界のバリューチェーン分析
- 市場力学(DROs)
- 情報源と参考文献
- 図表一覧
- 主要洞察
- データパック
- 用語集
目次
The Asia Pacific Confectionery Market size is estimated at 42.63 billion USD in 2025, and is expected to reach 54.37 billion USD by 2030, growing at a CAGR of 4.98% during the forecast period (2025-2030).
Strategic product positioning across dedicated shelves influences the impulse buying of confectionery products through supermarkets, hypermarkets, and convenience stores
- Supermarkets and hypermarkets were the primary sales channels for confectionery products in Asia-Pacific. These retail channels are considered an ideal option for consumers to shop, allowing them to select various types of confectionery products such as chocolates, snack bars, gums, and candies made by various companies according to their needs. The sales value of confectionery products in supermarkets and hypermarkets increased by 3.81% in 2023 from 2022. The products are expected to register a CAGR of 3.69% during the forecast period (2023-2030).
- Convenience stores are the second most widely preferred distribution channel for the purchase of confectionery products after supermarkets and hypermarkets. The sales volume of confectionery products through convenience stores is estimated to register an 8.3% growth rate in 2024 compared to 2022. Strategic product positioning on the dedicated shelves for the confectionery category influences impulse purchase behavior among potential consumers. Easy Joy, Meiyijia, 7-Eleven Inc., uSmile, and Lawson are some of the leading convenience stores in the region. A nationwide network of these operators allows easy access to local and mainstream confectionery brands. As of 2023, Easy Joy operated more than 27,800 stores in China, while 7-Eleven operated around 21,000 convenience stores in Japan.
- The online channel is projected to be the fastest-growing distribution channel for confectionery products, with an anticipated CAGR of 4.04% by value during the forecast period (2023-2030). The increasing number of internet users influences the evolving role of online retail channels in grocery purchases. In 2022, more than 845 million people in China purchased goods or services online, compared to 842.1 million in 2021.
China is the leading market, followed by Japan, collectively accounting for more than 50% share of the region's confectionery market in 2023
- The confectionery market in Asia-Pacific registered a growth rate of 4.05% in 2023 compared to 2022. The region's confectionery market has been witnessing significant growth due to several factors, including rising disposable incomes, urbanization, changes in consumer preferences, and an increasing appetite for indulgent treats.
- Compared to other countries, China holds the major share in the region, supported by the highest consumption of confectionery products in the country. The sales value of confectionery products in China increased by 3.51% in 2023 from 2022, which could be attributed to consumers' preferences for premium chocolates and the increasing trend toward intercontinental flavors.
- Japan is the second-leading country in terms of the sales of confectionery products in the region. The sales value of confectionery products in Japan is anticipated to register a CAGR of 3.38% from 2023 to 2030. Trends in consumer preferences indicate a shift toward premium, healthier, sustainable, and ethical products. Therefore, many smaller-scale manufacturers are operating in the market alongside existing medium-to-large-scale manufacturers. This factor, in turn, is estimated to drive the demand for confectionery products during the forecast period.
- Australia is the fastest-growing country for the sales of confectionery products in the region. In 2022, Australians spent an average of USD 133.07 per capita on chocolate products. About 49% of adult Aussies munched on candy and chocolate regularly in 2022. In the same year, 28% of Australians admitted that chocolate was their on-the-go snack, 23% had bought it as a gift for loved ones, and as many as 33% added it to their carts whenever they went grocery shopping.
Asia Pacific Confectionery Market Trends
The Australian market witnesses a strong consumption of chocolates in the region due to factors like an inclination toward sweet indulgence supported by the availability of healthy variants of chocolates
- Australia remains to be the prominent chocolate consumer in Asia-Pacific. Australians spent an average of USD 125.86 on chocolate confectionery per person in 2022. In 2021, 49% of Australian adults reported regularly snacking on candy and chocolate.
- Advertising, packaging, and attractive positioning of confectionery are the most prominent factors influencing consumer purchase. Resealable packaging has been in use and is regarded as a practical packaging option, allowing consumers to eat smaller portions.; The region's creative product introductions continue to be one of the key determinants driving confectionery purchases.
- Consumers in Asia-Pacific are becoming more interested in premium confectionary items and are choosing luxurious confectionery as a "treat" at the end of a long day or week. These customers favor "high priced," "premium packaging," handcrafted, small-batch products.
- Consumer preferences are shifting away from traditional sweets and inclining towards consuming bite-sized and better-for-you (BFY) chocolates, which are accelerating the demand for the consumption of healthy premium chocolates.
Asia Pacific Confectionery Industry Overview
The Asia Pacific Confectionery Market is fragmented, with the top five companies occupying 29.29%. The major players in this market are Ferrero International SA, Mars Incorporated, Mondelez International Inc., Nestle SA and Perfetti Van Melle BV (sorted alphabetically).
Additional Benefits:
- The market estimate (ME) sheet in Excel format
- 3 months of analyst support
TABLE OF CONTENTS
1 EXECUTIVE SUMMARY & KEY FINDINGS
2 REPORT OFFERS
3 INTRODUCTION
- 3.1 Study Assumptions & Market Definition
- 3.2 Scope of the Study
- 3.3 Research Methodology
4 KEY INDUSTRY TRENDS
- 4.1 Regulatory Framework
- 4.2 Consumer Buying Behavior
- 4.3 Ingredient Analysis
- 4.4 Value Chain & Distribution Channel Analysis
5 MARKET SEGMENTATION (includes market size in Value in USD and Volume, Forecasts up to 2030 and analysis of growth prospects)
- 5.1 Confections
- 5.1.1 Chocolate
- 5.1.1.1 By Confectionery Variant
- 5.1.1.1.1 Dark Chocolate
- 5.1.1.1.2 Milk and White Chocolate
- 5.1.2 Gums
- 5.1.2.1 By Confectionery Variant
- 5.1.2.1.1 Bubble Gum
- 5.1.2.1.2 Chewing Gum
- 5.1.2.1.2.1 By Sugar Content
- 5.1.2.1.2.1.1 Sugar Chewing Gum
- 5.1.2.1.2.1.2 Sugar-free Chewing Gum
- 5.1.3 Snack Bar
- 5.1.3.1 By Confectionery Variant
- 5.1.3.1.1 Cereal Bar
- 5.1.3.1.2 Fruit & Nut Bar
- 5.1.3.1.3 Protein Bar
- 5.1.4 Sugar Confectionery
- 5.1.4.1 By Confectionery Variant
- 5.1.4.1.1 Hard Candy
- 5.1.4.1.2 Lollipops
- 5.1.4.1.3 Mints
- 5.1.4.1.4 Pastilles, Gummies, and Jellies
- 5.1.4.1.5 Toffees and Nougats
- 5.1.4.1.6 Others
- 5.1.1 Chocolate
- 5.2 Distribution Channel
- 5.2.1 Convenience Store
- 5.2.2 Online Retail Store
- 5.2.3 Supermarket/Hypermarket
- 5.2.4 Others
- 5.3 Country
- 5.3.1 Australia
- 5.3.2 China
- 5.3.3 India
- 5.3.4 Indonesia
- 5.3.5 Japan
- 5.3.6 Malaysia
- 5.3.7 New Zealand
- 5.3.8 South Korea
- 5.3.9 Rest of Asia-Pacific
6 COMPETITIVE LANDSCAPE
- 6.1 Key Strategic Moves
- 6.2 Market Share Analysis
- 6.3 Company Landscape
- 6.4 Company Profiles
- 6.4.1 Chocoladefabriken Lindt & Sprungli AG
- 6.4.2 Delfi Limited
- 6.4.3 Ferrero International SA
- 6.4.4 General Mills Inc.
- 6.4.5 Haighs Proprietary Limited
- 6.4.6 Kellogg Company
- 6.4.7 Lotte Corporation
- 6.4.8 Mars Incorporated
- 6.4.9 Meiji Holdings Company Ltd
- 6.4.10 Mondelez International Inc.
- 6.4.11 Morinaga & Co. LTD
- 6.4.12 Nestle SA
- 6.4.13 Orion Holdings Corporation
- 6.4.14 PepsiCo Inc.
- 6.4.15 Perfetti Van Melle BV
- 6.4.16 The Hershey Company
7 KEY STRATEGIC QUESTIONS FOR CONFECTIONERY CEOS
8 APPENDIX
- 8.1 Global Overview
- 8.1.1 Overview
- 8.1.2 Porter's Five Forces Framework
- 8.1.3 Global Value Chain Analysis
- 8.1.4 Market Dynamics (DROs)
- 8.2 Sources & References
- 8.3 List of Tables & Figures
- 8.4 Primary Insights
- 8.5 Data Pack
- 8.6 Glossary of Terms
- 発行日
- 発行
- Mordor Intelligence
- ページ情報
- 英文 288 Pages
- 納期
- 2~3営業日


