
アフリカの菓子:市場シェア分析、産業動向・統計、成長予測(2025年~2030年)
Africa Confectionery - Market Share Analysis, Industry Trends & Statistics, Growth Forecasts (2025 - 2030)- 発行日
- ページ情報
- 英文 260 Pages
- 納期
- 2~3営業日
- 商品コード
- 1684014
- カスタマイズ可能 お客様のご希望に応じて、既存データの加工や未掲載情報(例:国別セグメント)の追加などの対応が可能です。詳細はお問い合わせください。
- 適宜更新あり 本レポートは最新情報反映のため適宜更新し、内容構成変更を行う場合があります。ご検討の際はお問い合わせください。
- 翻訳ツール提供対象 PDF対応AI翻訳ツールの無料貸し出しサービスのご利用が可能です
概要
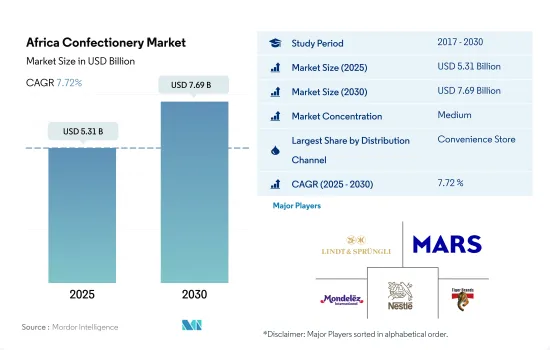
アフリカの菓子の市場規模は2025年に53億1,000万米ドルと推定され、2030年には76億9,000万米ドルに達すると予測され、予測期間中(2025-2030年)のCAGRは7.72%で成長する見込みです。
スーパーマーケットとコンビニエンスストアがシェアの80%以上を占める。
- この地域の菓子販売では、スーパーマーケット/ハイパーマーケットが常に強力なリードを維持しています。チョコレートはスーパーマーケットやハイパーマーケットを通じて最も広く販売されている菓子であり、2022年の市場数量シェアは50.89%です。チョコレート菓子の専用棚における戦略的なポジショニングは、潜在的な消費者の衝動買い行動に影響を与えます。
- Shoprite Holdings、Carrefour、Massmart Holdings Limitedは、この地域の大手食料品店オペレーターです。これらの事業者の全国的なネットワークにより、地元の菓子ブランドと主流菓子ブランドの両方へのアクセスが容易になっています。2023年現在、Massmartは南アフリカの9つの州で約287店舗を運営しています。また、カルフールグループはアフリカ7カ国でフランチャイズを展開し、200以上の店舗で現地パートナーと提携しています。
- コンビニエンスストアは、スーパーマーケット、ハイパーマーケットに次いで、菓子の購入に広く選ばれている流通チャネルです。コンビニエンスストアを通じた菓子の販売量は、2024年には18.96%の販売量シェアを記録すると推定されます。より広範囲に手が届き、プライベートブランドに簡単にアクセスできることから、消費者は他の小売チャネルよりも伝統的な食料品店を好みます。スナックバーの売上はコンビニエンスストアを通じて最も高いCAGRで成長し、2030年には7億6,198万米ドルの売上額に達すると推定されます。
- オンラインチャネルは菓子の流通チャネルとして最も急速に成長すると予測され、予測期間中の予想CAGRは金額ベースで6.13%です。食料品購入におけるオンライン・チャネルの役割が進化しているのは、インターネット・ユーザーの増加が影響しています。アフリカのインターネット普及率は2021年12月時点で43%です。
南アフリカが最大の市場シェアを占めるのは、プレミアムブランドや高級ブランドへの需要の高まりを特徴とするチョコレートの高い消費によるものである
- 2022年現在、南アフリカはアフリカにおける菓子の圧倒的な消費国です。チョコレートは2023年時点で78.98%の金額シェアを占め、市場で最大のシェアを占めています。消費者需要の大部分は、地域平均よりも高い同国の平均所得水準に支えられたプレミアム・ブランドや高級ブランドへの需要の高まりによって推進されています。2022年現在、南アフリカの月給中央値は1,394米ドルであるのに対し、地域平均は758米ドルです。この要因は、過去10年間にリンツ(Lindt)やフェレロ・ロシェ(Ferrero Rocher)といった世界・ブランドが南アフリカでプレミアム・チョコレートの知名度を拡大させてきたことにも裏付けられています。例えば、2023年、リンツは同国で先駆的な高級セレクションのビーガンチョコレートバーを発売しました。
- エジプトはこの地域で最も急成長している市場で、2023~2030年のCAGRは金額ベースで6.61%と予想されています。国内需要とは別に、エジプトは歴史的・文化的遺産を探索するために多くの海外旅行者を受け入れています。チョコレートやスナックバーは、1日の探検を続けるのに十分なエネルギーとカロリーを供給するため、旅行中の間食として有用な選択肢と考えられています。2023年、エジプトは1,170万人の観光客を受け入れ、2020-2021年度の800万人から増加しました。2022年に実施された消費者調査では、「ギャラクシー」、「キットカット」、「キャドバリー」の各ブランドが、同国で最も好まれている菓子ブランドの上位を繰り返し占めました。
- ナイジェリアはそのカカオ生産能力により、2022年時点で地域市場に大きく貢献しています。オンドは国内最大のカカオ(菓子の主要原料)生産国で、年間約8万トンを生産しています。
アフリカ菓子の市場動向
砂糖菓子とチョコレートはアフリカの人々に広く受け入れられている菓子であり、そのため一人当たりの消費量が多い
- 菓子の消費はアフリカのさまざまな年齢層で高く評価されており、特に20~30歳代での消費が多いです。チョコレート菓子は、あらゆる年齢層、社会経済層、性別の消費者によって消費されています。
- 菓子では、消費者は主にブランド・ロイヤルティの影響を受けています。アフリカでは、Z世代とミレニアル世代の消費者が、他の年齢層の中で最も高いブランド・ロイヤルティを公言しています。アフリカの消費者の73%が、特定の小売業者、ブランド、店舗に「忠実」であると考えています。
- 2023年には、菓子の売上が増加します。2023年、菓子分野では、揚げ菓子よりもスナックバーが好まれるようになり、スナックバーの人気が大幅に高まっています。
- アフリカでは、菓子分野ではチョコレートが人気のあるお菓子であり、その健康上の利点と潜在的な欠点が考慮されています。2023年には人口の92%がチョコレートを消費するようになると思われます。
アフリカ菓子産業の概要
アフリカの菓子市場は適度に統合されており、上位5社で41.82%を占めています。この市場の主要企業は以下の通りです。Chocoladefabriken Lindt & Sprungli AG, Mars Incorporated, Mondelez International Inc., Nestle SA and Tiger Brands(sorted alphabetically).
その他の特典
- エクセル形式の市場予測(ME)シート
- 3ヶ月のアナリストサポート
目次
第1章 エグゼクティブサマリーと主な調査結果
第2章 レポートのオファー
第3章 イントロダクション
- 調査の前提条件と市場定義
- 調査範囲
- 調査手法
第4章 主要産業動向
- 規制の枠組み
- 消費者の購買行動
- 成分分析
- バリューチェーンと流通チャネル分析
第5章 市場セグメンテーション
- 菓子
- チョコレート
- 菓子別
- ダークチョコレート
- ミルク&ホワイトチョコレート
- ガム
- 菓子別
- バブルガム
- チューインガム
- 砂糖含有量別
- シュガーチューインガム
- シュガーフリーチューインガム
- スナック菓子
- 菓子別
- シリアルバー
- フルーツ&ナッツバー
- プロテインバー
- 砂糖菓子
- 菓子別
- ハードキャンディー
- ロリポップ
- ミント
- トローチ、グミ、ゼリー
- トフィーとヌガー
- その他
- チョコレート
- 流通チャネル
- コンビニエンスストア
- オンラインストア
- スーパーマーケット
- その他
- 国名
- エジプト
- ナイジェリア
- 南アフリカ
- その他のアフリカ
第6章 競合情勢
- 主要な戦略動向
- 市場シェア分析
- 企業情勢
- 企業プロファイル
- Afrikoa
- Arcor S.A.I.C
- August Storck KG
- Chocoladefabriken Lindt & Sprungli AG
- Ferrero International SA
- General Mills Inc.
- HARIBO Holding GmbH & Co. KG
- Kellogg Company
- Mars Incorporated
- Mondelez International Inc.
- Nestle SA
- PepsiCo Inc.
- Perfetti Van Melle BV
- The Hershey Company
- Tiger Brands
- YIldIz Holding AS
第7章 CEOへの主な戦略的質問
第8章 付録
- 世界概要
- 概要
- ファイブフォース分析フレームワーク
- 世界のバリューチェーン分析
- 市場力学(DROs)
- 情報源と参考文献
- 図表一覧
- 主要洞察
- データパック
- 用語集
目次
The Africa Confectionery Market size is estimated at 5.31 billion USD in 2025, and is expected to reach 7.69 billion USD by 2030, growing at a CAGR of 7.72% during the forecast period (2025-2030).
Supermarkets and convenience stores account for over 80% of the share as nationwide store chains allow broader reach and easy access to multiple brands
- Supermarkets/hypermarkets have always maintained a strong lead in the sales of confectionery in the region. Chocolate is the most widely sold confection through supermarkets and hypermarkets, with a market volume share of 50.89% in 2022. Strategic positioning on the dedicated shelves for the chocolate confections influences impulse purchase behavior among potential consumers.
- Shoprite Holdings, Carrefour, and Massmart Holdings Limited are some of the leading grocery store operators in the region. A nationwide network of these operators allows easy access to both local and mainstream confectionery brands. As of 2023, Massmart operated around 287 stores across nine provinces of South Africa. Also, The Carrefour Group operates in Africa via franchises in 7 countries with local partners in more than 200 stores.
- Convenience stores are the second most widely preferred distribution channel for purchasing confectionery after supermarkets and hypermarkets. The volume of sales of confectionery through convenience stores is estimated to register an 18.96% volume share in 2024. The broader reach and easy access to private label brands drive the consumer preference for traditional grocery stores over other retail channels. Snack bar sales are estimated to grow at the highest CAGR through convenience stores to reach a sales value of USD 761.98 million in 2030.
- The online channel is projected to be the fastest-growing distribution channel for confectionery, with an anticipated CAGR of 6.13% in terms of value during the forecast period. The evolving role of online channels in grocery purchases is influenced by the increasing number of internet users. Internet penetration rate in Africa was 43% as of December 2021.
South Africa accounts for the largest market share due to the high consumption of chocolates, characterized by the increasing demand for premium and luxury brands
- South Africa was a dominant consumer of confectionery products in Africa as of 2022. Chocolates occupied the largest share in the market, with a value share of 78.98% as of 2023. Consumer demand is mostly propelled by the increasing demand for premium and luxury brands supported by the rising average level of income in the country, which is higher than the regional average. As of 2022, the median monthly salary in South Africa was USD 1,394 against a regional average of USD 758. This factor can also be supported by the expanding profile of premium chocolates in the country by global brands, such as Lindt and Ferrero Rocher, over the past decade. For instance, in 2023, Lindt launched a range of pioneering luxury selections of crafted vegan chocolate bars in the country.
- Egypt is the fastest-growing market in the region, with an anticipated CAGR of 6.61% by value during 2023-2030. Apart from domestic demand, the country receives numerous international travelers to explore its historical and cultural heritage. Chocolate and snack bars are considered useful snacking options while traveling as they provide a good amount of energy and calories to carry on with a full-day expedition. In 2023, Egypt received 11.7 million tourists, up from eight million in FY 2020-2021. In a consumer survey conducted in 2022, Galaxy, KitKat, and Cadbury brands repeatedly held the top positions for the most-liked chocolate confectionery brands in the country.
- Nigeria was a significant contributor to the regional market as of 2022 due to its cocoa-producing capacities. Ondo is the country's largest producer of cocoa (the primary confectionery ingredient), producing about 80,000 tons annually.
Africa Confectionery Market Trends
Sugar confectioneries and chocolates are widely accepted confectioneries among Africans, thereby resulting in a higher per capita consumption of these products
- Consumption of confectionery products is highly valued by individuals of different ages in Africa, with confectionery consumption being particularly prevalent among those aged 20 to 30. Chocolate confectionery is consumed by consumers of all ages, socio-economic groups, and both genders.
- Under the confectionery section, consumers are mainly affected by brand loyalty. In Africa, Gen Z and Millennial consumers professed the highest brand loyalty among other age groups. 73% of African consumers consider themselves "loyal" to certain retailers, brands, and stores.
- In 2023, confectionery products witnessed a hike in their sales. The sales growth is linked to the changing eating habits of consumers.; In 2023, under the confectionery segment, the snack bar has been gaining a significant volume of popularity as people prefer them over fried snacks.
- In Africa, under the confectionery segment, chocolate is a popular treat enjoyed by individuals; there are considerations regarding its health benefits and potential drawbacks. Chocolates will be consumed by 92% of the population in 2023.
Africa Confectionery Industry Overview
The Africa Confectionery Market is moderately consolidated, with the top five companies occupying 41.82%. The major players in this market are Chocoladefabriken Lindt & Sprungli AG, Mars Incorporated, Mondelez International Inc., Nestle SA and Tiger Brands (sorted alphabetically).
Additional Benefits:
- The market estimate (ME) sheet in Excel format
- 3 months of analyst support
TABLE OF CONTENTS
1 EXECUTIVE SUMMARY & KEY FINDINGS
2 REPORT OFFERS
3 INTRODUCTION
- 3.1 Study Assumptions & Market Definition
- 3.2 Scope of the Study
- 3.3 Research Methodology
4 KEY INDUSTRY TRENDS
- 4.1 Regulatory Framework
- 4.2 Consumer Buying Behavior
- 4.3 Ingredient Analysis
- 4.4 Value Chain & Distribution Channel Analysis
5 MARKET SEGMENTATION (includes market size in Value in USD and Volume, Forecasts up to 2030 and analysis of growth prospects)
- 5.1 Confections
- 5.1.1 Chocolate
- 5.1.1.1 By Confectionery Variant
- 5.1.1.1.1 Dark Chocolate
- 5.1.1.1.2 Milk and White Chocolate
- 5.1.2 Gums
- 5.1.2.1 By Confectionery Variant
- 5.1.2.1.1 Bubble Gum
- 5.1.2.1.2 Chewing Gum
- 5.1.2.1.2.1 By Sugar Content
- 5.1.2.1.2.1.1 Sugar Chewing Gum
- 5.1.2.1.2.1.2 Sugar-free Chewing Gum
- 5.1.3 Snack Bar
- 5.1.3.1 By Confectionery Variant
- 5.1.3.1.1 Cereal Bar
- 5.1.3.1.2 Fruit & Nut Bar
- 5.1.3.1.3 Protein Bar
- 5.1.4 Sugar Confectionery
- 5.1.4.1 By Confectionery Variant
- 5.1.4.1.1 Hard Candy
- 5.1.4.1.2 Lollipops
- 5.1.4.1.3 Mints
- 5.1.4.1.4 Pastilles, Gummies, and Jellies
- 5.1.4.1.5 Toffees and Nougats
- 5.1.4.1.6 Others
- 5.1.1 Chocolate
- 5.2 Distribution Channel
- 5.2.1 Convenience Store
- 5.2.2 Online Retail Store
- 5.2.3 Supermarket/Hypermarket
- 5.2.4 Others
- 5.3 Country
- 5.3.1 Egypt
- 5.3.2 Nigeria
- 5.3.3 South Africa
- 5.3.4 Rest of Africa
6 COMPETITIVE LANDSCAPE
- 6.1 Key Strategic Moves
- 6.2 Market Share Analysis
- 6.3 Company Landscape
- 6.4 Company Profiles
- 6.4.1 Afrikoa
- 6.4.2 Arcor S.A.I.C
- 6.4.3 August Storck KG
- 6.4.4 Chocoladefabriken Lindt & Sprungli AG
- 6.4.5 Ferrero International SA
- 6.4.6 General Mills Inc.
- 6.4.7 HARIBO Holding GmbH & Co. KG
- 6.4.8 Kellogg Company
- 6.4.9 Mars Incorporated
- 6.4.10 Mondelez International Inc.
- 6.4.11 Nestle SA
- 6.4.12 PepsiCo Inc.
- 6.4.13 Perfetti Van Melle BV
- 6.4.14 The Hershey Company
- 6.4.15 Tiger Brands
- 6.4.16 YIldIz Holding AS
7 KEY STRATEGIC QUESTIONS FOR CONFECTIONERY CEOS
8 APPENDIX
- 8.1 Global Overview
- 8.1.1 Overview
- 8.1.2 Porter's Five Forces Framework
- 8.1.3 Global Value Chain Analysis
- 8.1.4 Market Dynamics (DROs)
- 8.2 Sources & References
- 8.3 List of Tables & Figures
- 8.4 Primary Insights
- 8.5 Data Pack
- 8.6 Glossary of Terms
- 発行日
- 発行
- Mordor Intelligence
- ページ情報
- 英文 260 Pages
- 納期
- 2~3営業日


