
|
市場調査レポート
商品コード
1687296
北米の菓子類:市場シェア分析、産業動向、統計、成長予測(2025~2030年)North America Confectionery - Market Share Analysis, Industry Trends & Statistics, Growth Forecasts (2025 - 2030) |
||||||
カスタマイズ可能
適宜更新あり
|
|||||||
| 北米の菓子類:市場シェア分析、産業動向、統計、成長予測(2025~2030年) |
|
出版日: 2025年03月18日
発行: Mordor Intelligence
ページ情報: 英文 274 Pages
納期: 2~3営業日
|

全表示
- 概要
- 目次
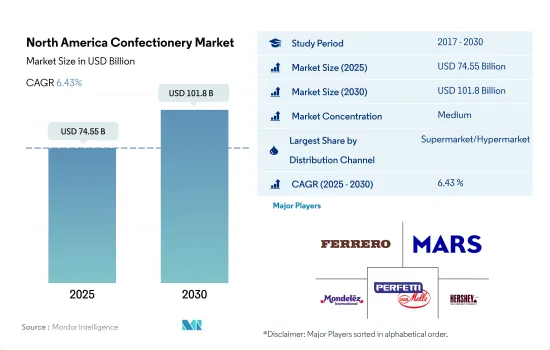
北米の菓子類市場規模は2025年に745億5,000万米ドルと推定され、2030年には1,018億米ドルに達すると予測され、予測期間(2025~2030年)のCAGRは6.43%で成長する見込みです。
スーパーマーケットとハイパーマーケットが大きなシェアを占め、次いでコンビニエンスストアが続きます。
- スーパーマーケットとハイパーマーケットは北米の菓子類市場の最大チャネルです。2023年の北米の菓子類販売における流通チャネル全体では、金額ベースで44%のシェアを占めています。これらのチャネルは、各国に近接しているため、市場で入手可能な多種多様な製品の中から消費者の購入決定に影響を与えるという付加的な利点があります。スーパーマーケットとハイパーマーケットにおける菓子類の販売額は、2023年には2022年に比べて5%増加し、この地域では2023~2029年の間にCAGR 19.7%を記録すると予測されます。2023年には、これらのチャネルにおける菓子類全体の金額シェアでチョコレートが51%と大半のシェアを占めています。
- コンビニエンスストアは、北米全域で菓子類の購入にスーパーマーケット、ハイパーマーケットに次いで広く好まれている流通チャネルです。このセグメントは2023年には金額ベースで25%の市場シェアを獲得します。こうした店舗が消費者に好まれる主要因は、プライベートブランドへのリーチが広く入手しやすいことと、こうしたチャネルの拡大が進んでいることです。2023年1月現在、米国のコンビニエンスストアは150,174店です。
- オンラインチャネルは、この地域で菓子類が消費される流通チャネルとして急成長しています。2024~2027年の間に、金額ベースで23%の成長を記録すると予測されています。消費者は、迅速な配達オプションを提供するオンラインチャネルを好む可能性が高いです。同地域のインターネット普及率の高さは、予測期間においてオンラインチャネルを後押しすると考えられます。2022年には、米国だけで3億720万人のインターネットユーザーがいた。
米国が80%以上の市場シェアを占めるのは、主にチョコレートの消費量が多いためで、2022年には人口の81%がチョコレートを好むようになります。
- 金額ベースでは、北米の菓子類市場は2023年に2021年比5.29%の成長を観察しました。この地域全体で甘いものを好む消費者が増加していることから、さらなる成長が見込まれます。2023年、米国の消費者は一人当たり平均144.90米ドルをチョコレートに費やすことが確認されました。米国は北米の菓子類市場を独占しています。2022年には、米国人口の81%がチョコレートを好みました。平均的なアメリカ人は2022年に約9.5ポンドのチョコレートを消費します。
- カナダは、2023年に北米の菓子類市場をリードしていた第2位の国とされています。これは、さまざまな形態、サイズ、価格の菓子類が入手可能なためです。2023年の砂糖菓子類(ハードキャンディ、ゼリー)の平均販売価格は1.25米ドルで、2.87米ドルという高値まで幅がありました。様々な価格帯の菓子が入手可能なため、顧客は好みに応じて製品を購入することができます。
- 数量ベースでは、メキシコは北米の菓子類市場で最も急成長している国です。メキシコの消費者は日常的に軽食として菓子を好みます。2023年、チューインガムに対する消費者の平均支出は1人当たり1.8kgでした。2023年の北米の菓子類市場では、北米以外のセグメントが最も低いシェアを占めていました。北米以外の地域の2022年の一人当たりチョコレート消費量は3.2kgでした。
- 2025~2029年にかけて、北米の菓子類市場は5.58%の成長率が見込まれます。これは主に、北米地域の消費者の間で高級チョコレートに対する需要が高まっているためです。
北米の菓子類市場の動向
健康志向とより健康的な代替品への需要が北米の菓子類市場に影響を及ぼしています。
- 北米における菓子類の消費は文化的伝統や祝祭に起因しており、少なくとも年に1回は消費されます。2歳以上のアメリカ人の約26%が菓子類を消費しており、2~18歳の若者の間では、2021年時点でアメリカ人の31%が任意の日に菓子類を消費しています。
- チョコレート製品における革新的なフレーバーの出現に伴う様々な味覚プロファイルの嗜好は、消費者の注目を集める大きな要因のひとつです。アメリカ人の90%以上が、チョコレート、特にアーモンドにちょっとしたプラスアルファを好みます。
- プレミアムチョコレートとクラフトチョコレートは、この地域の市場シェアと消費者の認知度を高め続けています。プレミアムチョコレートは、2020年にチョコレート消費者の67%が購入します。
- 製品の健康性は、製品の品質認識にプラスの影響を与えます。免疫力を高める」「気分を高める」といった効能を宣伝するラベルを貼った製品が頻繁に登場しています。
北米の菓子類産業概要
北米の菓子類市場は適度に統合されており、上位5社で47.58%を占めています。この市場の主要企業は、 Ferrero International SA、Mars Incorporated、Mondelez International Inc.、Perfetti Van Melle BV、The Hershey Companyなどがあります。
その他の特典
- エクセル形式の市場予測(ME)シート
- アナリストによる3ヶ月間のサポート
目次
第1章 エグゼクティブサマリーと主要調査結果
第2章 レポートのオファー
第3章 イントロダクション
- 調査の前提条件と市場定義
- 調査範囲
- 調査手法
第4章 主要産業動向
- 規制の枠組み
- 消費者の購買行動
- 成分分析
- バリューチェーンと流通チャネル分析
第5章 市場セグメンテーション
- 菓子
- チョコレート
- 菓子類別
- ダークチョコレート
- ミルク&ホワイトチョコレート
- ガム
- 菓子類別
- バブルガム
- チューインガム
- 砂糖含有量別
- 砂糖入りチューインガム
- 無糖チューインガム
- スナック菓子
- 菓子類別
- シリアルバー
- フルーツ&ナッツバー
- プロテインバー
- 砂糖菓子類
- 菓子類別
- ハードキャンディ
- ロリポップ
- ミント
- パスティル、グミ、ゼリー
- トフィーとヌガー
- その他
- チョコレート
- 流通チャネル
- コンビニエンスストア
- オンラインストア
- スーパーマーケット
- その他
- 国名
- カナダ
- メキシコ
- 米国
- その他の北米地域
第6章 競争情勢
- 主要な戦略動向
- 市場シェア分析
- 企業情勢
- 企業プロファイル
- Chocoladefabriken Lindt & Sprungli AG
- Ferrero International SA
- Ford Gum & Machine Company Inc.
- General Mills Inc.
- HARIBO Holding GmbH & Co. KG
- Kellogg Company
- Mars Incorporated
- Mondelez International Inc.
- Nestle SA
- PepsiCo Inc.
- Perfetti Van Melle BV
- Simply Good Foods Co.
- The Bazooka Companies Inc.
- The Hershey Company
- Tootsie Roll Industries Inc.
第7章 CEOへの主要戦略的質問
第8章 付録
- 世界概要
- 概要
- ファイブフォース分析フレームワーク
- 世界のバリューチェーン分析
- 市場力学(DROs)
- 情報源と参考文献
- 図表一覧
- 主要洞察
- データパック
- 用語集
The North America Confectionery Market size is estimated at 74.55 billion USD in 2025, and is expected to reach 101.8 billion USD by 2030, growing at a CAGR of 6.43% during the forecast period (2025-2030).
Supermarkets and hypermarkets account for a prominent share, followed by convenience stores, due to the broader reach and easy access to private-label brands
- Supermarkets and hypermarkets are the largest channels in the North American confectionery market. The channel held the major share of 44% by value in the overall distribution channels segment for North America's confectionery sales in 2023. The proximity factor of these channels in the countries gives them an added advantage of influencing the consumer's decision to purchase among the large variety of products available in the market. The sales value of confectionery products in supermarkets and hypermarkets increased by 5% in 2023 compared to 2022, and it is anticipated to register a CAGR of 19.7% during 2023-2029 in the region. In 2023, chocolates accounted for the majority share of 51% of the value share of the total confectionery category in these channels.
- Convenience stores are the second most widely preferred distribution channel after supermarkets and hypermarkets for purchasing confectionery products across North America. The segment acquired a 25% market share in terms of value in 2023. The key factors driving consumer preference for these stores are the broader reach and easy access to private-label brands and the increasing expansion of these channels. As of January 2023, there were 150,174 convenience stores in the United States.
- Online channels are the fastest-growing distribution channel through which confectionery products are consumed in the region. It is projected to register a growth of 23% by value during the period 2024-2027. Consumers are likely to prefer online channels as they provide quick delivery options. The high internet penetration in the region will likely aid online channels in the forecast period. In 2022, there were 307.2 million internet users in the United States alone.
The United States accounts for more than an 80% market share mainly due to the high consumption of chocolates, with 81% of the population preferring chocolate in 2022
- By value, the North American confectionery market observed a growth of 5.29% in 2023 compared to 2021. Further growth is anticipated with the rising volume of consumers with a sweet tooth across the region. In 2023, US consumers were observed to spend an average of USD 144.90 per capita on chocolate. The United States is dominating the North American confectionery market. In 2022, 81% of the US population preferred chocolate. The average American consumed around 9.5 pounds of chocolate in 2022.
- Canada is considered the second largest country, which was leading the confectionery market in North America in 2023. This is due to the availability of confectioneries in different shapes, sizes, and prices. In 2023, the average selling price of sugar confectionery (hard candy, jelly) was USD 1.25, which ranged to as high as USD 2.87. The availability of confections at varied price ranges enables customers to purchase products according to their preferences.
- By volume, Mexico is the fastest-growing country in the North American confectionery market. Consumers in Mexico prefer confections as refreshments on a regular basis. In 2023, it was observed that the average consumer spending on chewing gum was 1.8 kg per person. The Rest of North America segment held the least share in the North American confectionery market in 2023. The per capita consumption of chocolate in 2022 in the Rest of North America was 3.2 kg per person.
- During 2025-2029, the North American confectionery market is expected to grow at a rate of 5.58%. This is mainly due to the rising demand for premium chocolates among consumers in the North American region.
North America Confectionery Market Trends
Health consciousness and the demand for healthier alternatives have influenced the confectionery market across North America
- Confectionery consumption in North America is attributed to cultural traditions and celebrations, making the consumption possible at least once a year. About 26% of Americans aged more than or equal to 2 years consumed candy, and among youth aged 2-18 years, 31% of Americans consume confectionery on any given day as of 2021.
- The preference for various taste profiles associated with the emergence of innovative flavors in chocolate products is one of the major factors driving consumers' attention. Over 90% of Americans prefer a little extra in their chocolate, especially almonds.
- Premium and craft chocolates continue to increase in market share and consumer recognition in the region. Premium chocolate had an audience with 67% of chocolate consumers purchasing it in 2020.
- The healthfulness of a product positively influences the perception of product quality. Products with labels advertising "immune-boosting" or "mood-enhancing" benefits are popping up more frequently.
North America Confectionery Industry Overview
The North America Confectionery Market is moderately consolidated, with the top five companies occupying 47.58%. The major players in this market are Ferrero International SA, Mars Incorporated, Mondelez International Inc., Perfetti Van Melle BV and The Hershey Company (sorted alphabetically).
Additional Benefits:
- The market estimate (ME) sheet in Excel format
- 3 months of analyst support
TABLE OF CONTENTS
1 EXECUTIVE SUMMARY & KEY FINDINGS
2 REPORT OFFERS
3 INTRODUCTION
- 3.1 Study Assumptions & Market Definition
- 3.2 Scope of the Study
- 3.3 Research Methodology
4 KEY INDUSTRY TRENDS
- 4.1 Regulatory Framework
- 4.2 Consumer Buying Behavior
- 4.3 Ingredient Analysis
- 4.4 Value Chain & Distribution Channel Analysis
5 MARKET SEGMENTATION (includes market size in Value in USD and Volume, Forecasts up to 2030 and analysis of growth prospects)
- 5.1 Confections
- 5.1.1 Chocolate
- 5.1.1.1 By Confectionery Variant
- 5.1.1.1.1 Dark Chocolate
- 5.1.1.1.2 Milk and White Chocolate
- 5.1.2 Gums
- 5.1.2.1 By Confectionery Variant
- 5.1.2.1.1 Bubble Gum
- 5.1.2.1.2 Chewing Gum
- 5.1.2.1.2.1 By Sugar Content
- 5.1.2.1.2.1.1 Sugar Chewing Gum
- 5.1.2.1.2.1.2 Sugar-free Chewing Gum
- 5.1.3 Snack Bar
- 5.1.3.1 By Confectionery Variant
- 5.1.3.1.1 Cereal Bar
- 5.1.3.1.2 Fruit & Nut Bar
- 5.1.3.1.3 Protein Bar
- 5.1.4 Sugar Confectionery
- 5.1.4.1 By Confectionery Variant
- 5.1.4.1.1 Hard Candy
- 5.1.4.1.2 Lollipops
- 5.1.4.1.3 Mints
- 5.1.4.1.4 Pastilles, Gummies, and Jellies
- 5.1.4.1.5 Toffees and Nougats
- 5.1.4.1.6 Others
- 5.1.1 Chocolate
- 5.2 Distribution Channel
- 5.2.1 Convenience Store
- 5.2.2 Online Retail Store
- 5.2.3 Supermarket/Hypermarket
- 5.2.4 Others
- 5.3 Country
- 5.3.1 Canada
- 5.3.2 Mexico
- 5.3.3 United States
- 5.3.4 Rest of North America
6 COMPETITIVE LANDSCAPE
- 6.1 Key Strategic Moves
- 6.2 Market Share Analysis
- 6.3 Company Landscape
- 6.4 Company Profiles
- 6.4.1 Chocoladefabriken Lindt & Sprungli AG
- 6.4.2 Ferrero International SA
- 6.4.3 Ford Gum & Machine Company Inc.
- 6.4.4 General Mills Inc.
- 6.4.5 HARIBO Holding GmbH & Co. KG
- 6.4.6 Kellogg Company
- 6.4.7 Mars Incorporated
- 6.4.8 Mondelez International Inc.
- 6.4.9 Nestle SA
- 6.4.10 PepsiCo Inc.
- 6.4.11 Perfetti Van Melle BV
- 6.4.12 Simply Good Foods Co.
- 6.4.13 The Bazooka Companies Inc.
- 6.4.14 The Hershey Company
- 6.4.15 Tootsie Roll Industries Inc.
7 KEY STRATEGIC QUESTIONS FOR CONFECTIONERY CEOS
8 APPENDIX
- 8.1 Global Overview
- 8.1.1 Overview
- 8.1.2 Porter's Five Forces Framework
- 8.1.3 Global Value Chain Analysis
- 8.1.4 Market Dynamics (DROs)
- 8.2 Sources & References
- 8.3 List of Tables & Figures
- 8.4 Primary Insights
- 8.5 Data Pack
- 8.6 Glossary of Terms
