
|
市場調査レポート
商品コード
1693886
非乳製品ヨーグルト-市場シェア分析、産業動向・統計、成長予測(2025~2030年)Non-dairy Yogurt - Market Share Analysis, Industry Trends & Statistics, Growth Forecasts (2025 - 2030) |
||||||
カスタマイズ可能
適宜更新あり
|
|||||||
| 非乳製品ヨーグルト-市場シェア分析、産業動向・統計、成長予測(2025~2030年) |
|
出版日: 2025年03月18日
発行: Mordor Intelligence
ページ情報: 英文 251 Pages
納期: 2~3営業日
|

全表示
- 概要
- 目次
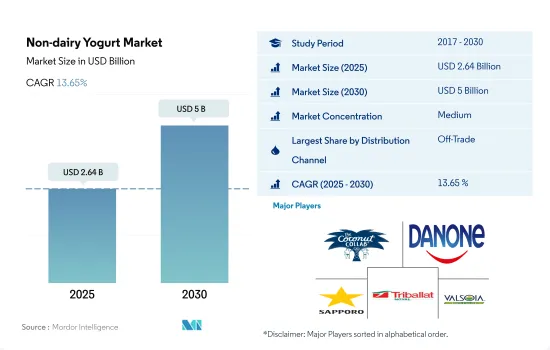
非乳製品ヨーグルト市場規模は2025年に26億4,000万米ドルと推定・予測され、2030年には50億米ドルに達し、予測期間中(2025~2030年)のCAGRは13.65%で成長すると予測されます。
複数のブランドが利用可能であり、プロモーションも提供されることから、予測期間中にオンライン小売媒体が成長する可能性が高いです。
- レビュー期間中(2017~2022年)、世界のオフトレード小売は小売セグメント全体を支配しました。2022年には、消費者の満足度がこれらの小売業者に関連する主要な要因であることが観察されました。消費者は、乳製品以外のヨーグルトを購入する際に、より大きな利便性と快適さを得ることができるため、取引外の小売業に非常に魅了されています。世界の流通チャネルは、2021年から6.84%の成長を観察しています。
- 地域別では、アジア太平洋が最大で、オフトレード流通チャネル全体で48.73%のシェアを占めています。アジア太平洋では、非乳製品ヨーグルトは様々な価格(低価格、中価格、高価格)で販売されています。価格は2.55米ドルから16.4米ドルです。様々な価格で乳製品以外のヨーグルトが入手可能なため、消費者は自分の購入しやすい価格帯に合った製品を購入することができ、消費者の購買力も促進されます。
- オントレードの小売業者は、無糖、チョコレート、バニラなどの異なるフレーバーを含む、様々な非乳製品ヨーグルトを提供することに重点を置いています。さまざまなフレーバーを提供しているにもかかわらず、これらの小売業者は、製品の詳細(使用されている原料、使用されている種子など)といった完全な情報を消費者に提供することができないです。消費者は非乳製品ヨーグルトを取引外の形態で購入することに従事しています。2022年、欧州は7.41%のシェアを占め、オントレードチャネルで最も急成長している地域と考えられています。
- 2018~2022年にかけて、オフトレードチャネルでは、専門店が消費者に製品に関するより高い可視性を提供するため、大きな需要を獲得しました。非乳製品ヨーグルトの需要を考慮すると、世界の流通セグメントは2022~2025年にかけて24.7%の成長が見込まれます。
欧州と北米における菜食主義の普及が非乳製品ヨーグルト市場に拍車をかけています。
- 非乳製品ヨーグルトの世界消費量は2019~2022年にかけて82%成長が見込まれています。非乳製品ヨーグルトは、さまざまな国で日常生活の一部となっています。欧州と北米は、世界最大の非乳製品ヨーグルト消費者であり、2022年の市場数量シェアはそれぞれ73%と20%を記録しています。
- 英国とフランスはこの地域の主要市場であり、2022年の非乳製品ヨーグルト数量全体の65.25%を占めます。植物性食品を好む人口が急増したことで、英国全土でヴィーガンヨーグルトの需要が高まっています。英国の消費者の約60%は、2022年に植物性タンパク質に興味を持っていました。英国政府は、食料品店や小売店、eコマースストアの棚に並ぶ製品を制限する規制を設け、塩分、糖分、脂肪分の高い製品や飲料、あるいは健康的でない製品を公開の場で宣伝しています。このため、従来のヨーグルトに代わる健康的な選択肢として、乳製品を使わないヨーグルトを選ぶ人が増えています。
- 北米では、非乳製品ヨーグルトの売上高は2023~2026年の間に4.50%の値で拡大し、2026年には401億314万米ドルに達すると推定されています。非乳製品ヨーグルトは、この地域で最も消費されているカテゴリーの一つであり、米国やカナダなどの主要国ではフルーツフレーバーが最も人気があります。2021年時点で、米国では62%にあたる7,900万世帯が植物性製品を購入しています。これは2020年の61%、7,700万世帯からの増加です。
- アジア太平洋は非乳製品ヨーグルト市場で最も急成長しており、2024~2027年の間に64%の成長が見込まれています。この市場成長は、非乳製品ヨーグルトの栄養プロファイルに関する消費者意識の高まりに起因しています。
世界の非乳製品ヨーグルト市場動向
菜食主義者の大幅な増加、乳糖不耐症人口の増加、革新的な植物ベースのヨーグルトオプションの利用可能性は、非乳製品ヨーグルトの消費を促進します。
- ヴィーガン人口の大幅な増加と乳糖不耐症人口の増加により、様々なタイプの乳製品代替製品の消費は世界的に増加しています。ヴィーガンの展示会/見本市や音楽祭でさえ、各国で開催されています。例えば、オーストラリアは国民一人当たりの菜食主義者の割合が世界で3番目に高いです。2022年現在、同国には250万人のヴィーガンとベジタリアンがいます。
- 2021年、米国における植物性ヨーグルトの小売売上高は9%増、すなわち従来のヨーグルトの3倍となり、市場シェアは4.5%に達しました。植物性ヨーグルトの販売個数は、2021年には54%増の1億7,000万個に急成長します。各社は、食欲をそそる植物性ヨーグルトを開発するために革新的なアプローチをとっており、ヴィーガンの消費者層の要求を満たすために新しいフレーバーや組み合わせを導入しています。乳製品を使用しないヨーグルトの消費は、市場における植物性食品の利点に関する認識により増加すると予想されます。
- ドイツ、フランス、イタリアは非乳製品ヨーグルトの一人当たり消費量が最も多いです。主にドイツで乳製品代替食品の人気が高まっていることが、植物性ヨーグルトの急成長につながりました。国内ではヴィーガンヨーグルトの需要が伸びており、国内の消費者は海外の消費者と共にヴィーガン主義を採用しています。
非乳製品ヨーグルト産業概要
非乳製品ヨーグルト市場は適度に統合されており、上位5社で59.16%を占めています。この市場の主要企業は、Coconut Collaborative Ltd、Danone SA、Sapporo Holdings Ltd(POKKA SAPPORO Food & Beverage Ltd)、Triballat Noyal SAS、Valsoia SpAなどです。
その他の特典
- エクセル形式の市場予測(ME)シート
- 3ヶ月のアナリストサポート
目次
第1章 エグゼクティブサマリーと主要調査結果
第2章 レポートのオファー
第3章 イントロダクション
- 調査の前提条件と市場定義
- 調査範囲
- 調査手法
第4章 主要産業動向
- 一人当たり消費量
- 原料/商品生産
- 代替乳製品-原料生産
- 規制の枠組み
- カナダ
- フランス
- ドイツ
- イタリア
- メキシコ
- スペイン
- 英国
- 米国
- バリューチェーンと流通チャネル分析
第5章 市場セグメンテーション
- 流通チャネル
- オフトレード
- コンビニエンスストア
- オンライン小売
- 専門小売店
- スーパーマーケットとハイパーマーケット
- その他(倉庫クラブ、ガソリンスタンドなど)
- オフトレード
- 地域
- アフリカ
- 流通チャネル別
- 南アフリカ
- アジア太平洋
- 流通チャネル別
- オーストラリア
- 日本
- ニュージーランド
- その他のアジア太平洋
- 欧州
- 流通チャネル別
- ベルギー
- フランス
- ドイツ
- イタリア
- オランダ
- ロシア
- スペイン
- 英国
- その他の欧州
- 中東
- 流通チャネル別
- サウジアラビア
- アラブ首長国連邦
- 北米
- 流通チャネル別
- カナダ
- 米国
- 南米
- 流通チャネル別
- ブラジル
- アフリカ
第6章 競合情勢
- 主要な戦略動向
- 市場シェア分析
- 企業情勢
- 企業プロファイル
- Blue Diamond Growers
- Califia Farms LLC
- Coconut Collaborative Ltd
- Danone SA
- Oatly Group AB
- Sapporo Holdings Ltd(POKKA SAPPORO Food & Beverage Ltd)
- Triballat Noyal SAS
- Valsoia SpA
第7章 CEOへの主要戦略的質問
第8章 付録
- 世界概要
- 概要
- ファイブフォース分析フレームワーク
- 世界のバリューチェーン分析
- 市場力学(DROs)
- 情報源と参考文献
- 図表一覧
- 主要な洞察
- データパック
- 用語集
The Non-dairy Yogurt Market size is estimated at 2.64 billion USD in 2025, and is expected to reach 5 billion USD by 2030, growing at a CAGR of 13.65% during the forecast period (2025-2030).
Availability of multiple brands coupled with promotional offers is likely to boost the online retail medium during the forecast period
- Global off-trade retailing dominated the overall retail space during the review period (2017-2022). In 2022, it was observed that consumer satisfaction was the major factor associated with these retailers. Consumers are highly fascinated by off-trade retailing due to the greater convenience and comfort they get during purchasing non-dairy yogurt. The global distribution channel has observed a growth of 6.84% from 2021.
- By region, Asia-Pacific is marked as the largest, holding a share of 48.73% in the overall off-trade distribution channels. In the Asia-Pacific region, off-trade channels offer non-dairy yogurt at varied prices (low, medium, and high). The price ranges from USD 2.55 to USD 16.4. The availability of non-dairy yogurt at varied prices also promotes the buying power among consumers as they can purchase the products that suit their affordability parameters.
- On-trade retailers focus on providing a variety of non-dairy yogurt, including different flavors such as unsweetened, chocolate, and vanilla. Despite offering different flavors, these retailers cannot provide complete information, such as product specifics (ingredient used, seed used, and others), to consumers. Consumers are engaged in purchasing non-dairy yogurt through off-trade modes. In 2022, Europe was considered the fastest-growing region for on-trade channels, as it held a share of 7.41%.
- Between 2018 and 2022, in off-trade channels, specialty stores gained significant demand as they offered higher visibility about the product to consumers. Considering the demand for non-dairy yogurt, the global distribution segment is expected to grow by 24.7% in 2025 from 2022.
The increasing prevalence of veganism in Europe and North America is fueling the market for non-dairy yogurt
- Global consumption of non-dairy yogurt grew by 82% from 2019 to 2022. Non-dairy yogurt has become a part of daily life across different countries. Europe and North America are the largest non-dairy yogurt consumers, globally, registering market volume shares of 73% and 20%, respectively, in 2022.
- The United Kingdom and France are identified as the region's major markets, collectively accounting for a 65.25% share of the overall non-dairy yogurt volume sales in 2022. The rapid spike in the country's population preferring plant-based food has bolstered the demand for vegan yogurt across the United Kingdom. Around 60% of UK consumers were interested in plant-based proteins in 2022. The UK government has set regulations restricting the products on grocery or retail shelves or any e-commerce store, promoting products or drinks high in salt, sugar, and fat or those less healthy in an open forum. This has influenced the population to opt for non-dairy yogurt as a healthy alternative to conventional yogurt.
- In North America, non-dairy yogurt sales are estimated to expand at a value of 4.50% during 2023-2026, reaching USD 40,103.14 million in 2026. Non-dairy yogurt is one of the largest consumed categories across the region, with fruit flavors being the most popular in key countries such as the United States and Canada. As of 2021, 62% or 79 million households in the United States, bought plant-based products. This is an increase from 61% or 77 million in 2020.
- Asia-Pacific is identified as the fastest-growing non-dairy yogurt market, with anticipated value growth of 64% during 2024-2027. The market growth can be attributed to the rising consumer awareness about the nutritional profile of non-dairy yogurt.
Global Non-dairy Yogurt Market Trends
The significant rise in the vegan population, the growing lactose intolerant population, and the availability of innovative plant-based yogurt options drive the consumption of non-dairy yogurt.
- The consumption of different types of dairy alternative products is rising globally owing to a significant rise in the vegan population and the growing lactose-intolerant population. Even vegan exhibitions/trade shows and music festivals are conducted in different countries. For example, Australia has the third-highest percentage of vegans per capita globally. As of 2022, the country had 2.5 million vegans and vegetarians.
- In 2021, plant-based yogurt retail sales in the United States increased by 9%, i.e., three times more than traditional yogurt, reaching a 4.5% market share. Plant-based yogurt unit sales grew rapidly from 54% to 170 million units in 2021. Companies are taking innovative approaches to develop appetizing plant-based yogurts and introducing new flavors and combinations to meet the requirements of their vegan consumer base. Non-dairy yogurt consumption is anticipated to increase due to awareness about the advantages of plant-based foods in the market.
- Germany, France, and Italy have the highest per capita consumption of non-dairy yogurt. The growing popularity of dairy alternatives, primarily in Germany, has led to the rapid growth of plant-based yogurt. The demand for vegan yogurt is growing within the country, and domestic consumers, along with international consumers, are adopting veganism.
Non-dairy Yogurt Industry Overview
The Non-dairy Yogurt Market is moderately consolidated, with the top five companies occupying 59.16%. The major players in this market are Coconut Collaborative Ltd, Danone SA, Sapporo Holdings Ltd (POKKA SAPPORO Food & Beverage Ltd), Triballat Noyal SAS and Valsoia SpA (sorted alphabetically).
Additional Benefits:
- The market estimate (ME) sheet in Excel format
- 3 months of analyst support
TABLE OF CONTENTS
1 EXECUTIVE SUMMARY & KEY FINDINGS
2 REPORT OFFERS
3 INTRODUCTION
- 3.1 Study Assumptions & Market Definition
- 3.2 Scope of the Study
- 3.3 Research Methodology
4 KEY INDUSTRY TRENDS
- 4.1 Per Capita Consumption
- 4.2 Raw Material/commodity Production
- 4.2.1 Dairy Alternative - Raw Material Production
- 4.3 Regulatory Framework
- 4.3.1 Canada
- 4.3.2 France
- 4.3.3 Germany
- 4.3.4 Italy
- 4.3.5 Mexico
- 4.3.6 Spain
- 4.3.7 United Kingdom
- 4.3.8 United States
- 4.4 Value Chain & Distribution Channel Analysis
5 MARKET SEGMENTATION (includes market size in Value in USD and Volume, Forecasts up to 2030 and analysis of growth prospects)
- 5.1 Distribution Channel
- 5.1.1 Off-Trade
- 5.1.1.1 Convenience Stores
- 5.1.1.2 Online Retail
- 5.1.1.3 Specialist Retailers
- 5.1.1.4 Supermarkets and Hypermarkets
- 5.1.1.5 Others (Warehouse clubs, gas stations, etc.)
- 5.1.1 Off-Trade
- 5.2 Region
- 5.2.1 Africa
- 5.2.1.1 By Distribution Channel
- 5.2.1.2 South Africa
- 5.2.2 Asia-Pacific
- 5.2.2.1 By Distribution Channel
- 5.2.2.2 Australia
- 5.2.2.3 Japan
- 5.2.2.4 New Zealand
- 5.2.2.5 Rest of Asia Pacific
- 5.2.3 Europe
- 5.2.3.1 By Distribution Channel
- 5.2.3.2 Belgium
- 5.2.3.3 France
- 5.2.3.4 Germany
- 5.2.3.5 Italy
- 5.2.3.6 Netherlands
- 5.2.3.7 Russia
- 5.2.3.8 Spain
- 5.2.3.9 United Kingdom
- 5.2.3.10 Rest of Europe
- 5.2.4 Middle East
- 5.2.4.1 By Distribution Channel
- 5.2.4.2 Saudi Arabia
- 5.2.4.3 United Arab Emirates
- 5.2.5 North America
- 5.2.5.1 By Distribution Channel
- 5.2.5.2 Canada
- 5.2.5.3 United States
- 5.2.6 South America
- 5.2.6.1 By Distribution Channel
- 5.2.6.2 Brazil
- 5.2.1 Africa
6 COMPETITIVE LANDSCAPE
- 6.1 Key Strategic Moves
- 6.2 Market Share Analysis
- 6.3 Company Landscape
- 6.4 Company Profiles (includes Global Level Overview, Market Level Overview, Core Business Segments, Financials, Headcount, Key Information, Market Rank, Market Share, Products and Services, and Analysis of Recent Developments).
- 6.4.1 Blue Diamond Growers
- 6.4.2 Califia Farms LLC
- 6.4.3 Coconut Collaborative Ltd
- 6.4.4 Danone SA
- 6.4.5 Oatly Group AB
- 6.4.6 Sapporo Holdings Ltd (POKKA SAPPORO Food & Beverage Ltd)
- 6.4.7 Triballat Noyal SAS
- 6.4.8 Valsoia SpA
7 KEY STRATEGIC QUESTIONS FOR DAIRY AND DAIRY ALTERNATIVE CEOS
8 APPENDIX
- 8.1 Global Overview
- 8.1.1 Overview
- 8.1.2 Porter's Five Forces Framework
- 8.1.3 Global Value Chain Analysis
- 8.1.4 Market Dynamics (DROs)
- 8.2 Sources & References
- 8.3 List of Tables & Figures
- 8.4 Primary Insights
- 8.5 Data Pack
- 8.6 Glossary of Terms

